Zip Codes with the Highest Percentage of Population Employed in Food Preparation & Serving in Bainbridge, GA
RELATED REPORTS & OPTIONS
Food Preparation & Serving
Bainbridge
Compare Zip Codes
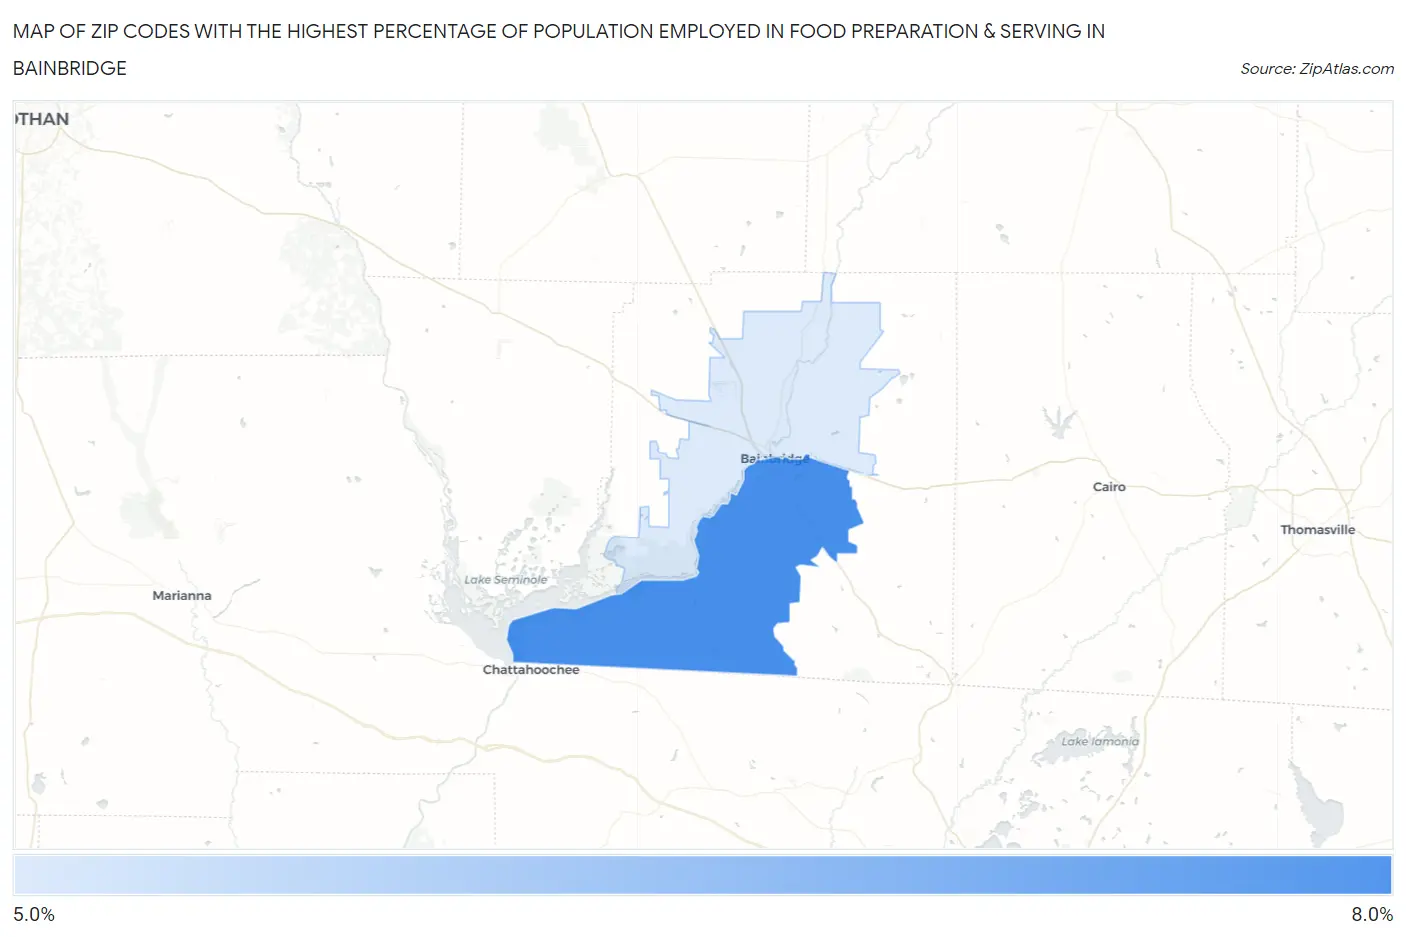
Map of Zip Codes with the Highest Percentage of Population Employed in Food Preparation & Serving in Bainbridge
5.6%
6.8%
Zip Codes with the Highest Percentage of Population Employed in Food Preparation & Serving in Bainbridge, GA
| Zip Code | % Employed | vs State | vs National | |
| 1. | 39819 | 6.8% | 5.1%(+1.69)#138 | 5.3%(+1.55)#6,971 |
| 2. | 39817 | 5.6% | 5.1%(+0.442)#247 | 5.3%(+0.301)#10,754 |
1
Common Questions
What are the Top Zip Codes with the Highest Percentage of Population Employed in Food Preparation & Serving in Bainbridge, GA?
Top Zip Codes with the Highest Percentage of Population Employed in Food Preparation & Serving in Bainbridge, GA are:
What zip code has the Highest Percentage of Population Employed in Food Preparation & Serving in Bainbridge, GA?
39819 has the Highest Percentage of Population Employed in Food Preparation & Serving in Bainbridge, GA with 6.8%.
What is the Percentage of Population Employed in Food Preparation & Serving in Bainbridge, GA?
Percentage of Population Employed in Food Preparation & Serving in Bainbridge is 6.4%.
What is the Percentage of Population Employed in Food Preparation & Serving in Georgia?
Percentage of Population Employed in Food Preparation & Serving in Georgia is 5.1%.
What is the Percentage of Population Employed in Food Preparation & Serving in the United States?
Percentage of Population Employed in Food Preparation & Serving in the United States is 5.3%.