Zip Codes with the Highest Percentage of Population Employed in Food Preparation & Serving in Marietta, GA
RELATED REPORTS & OPTIONS
Food Preparation & Serving
Marietta
Compare Zip Codes
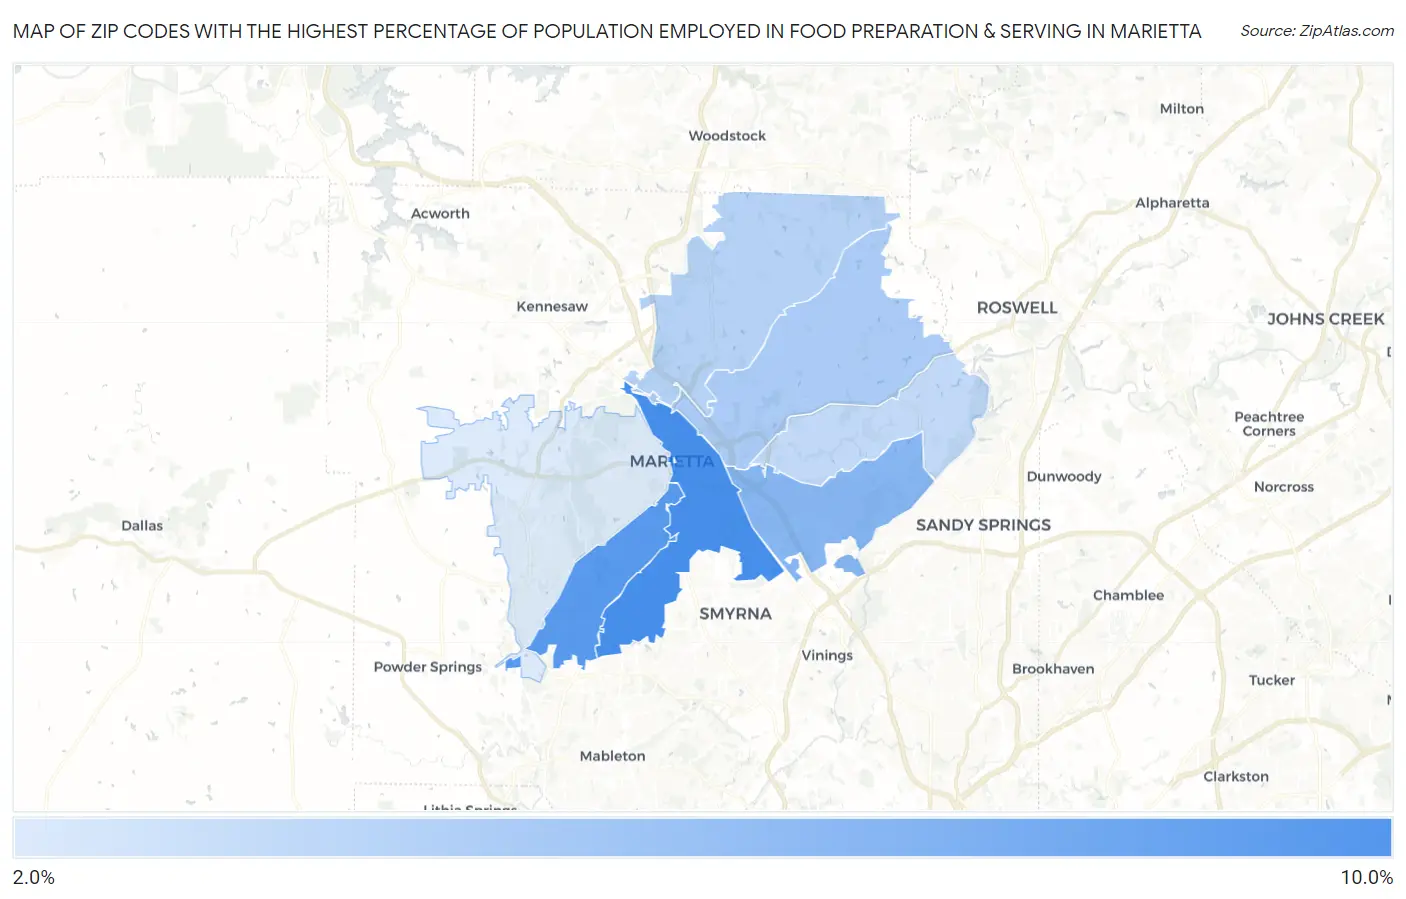
Map of Zip Codes with the Highest Percentage of Population Employed in Food Preparation & Serving in Marietta
2.8%
9.0%
Zip Codes with the Highest Percentage of Population Employed in Food Preparation & Serving in Marietta, GA
| Zip Code | % Employed | vs State | vs National | |
| 1. | 30060 | 9.0% | 5.1%(+3.82)#68 | 5.3%(+3.68)#3,558 |
| 2. | 30008 | 8.3% | 5.1%(+3.11)#85 | 5.3%(+2.97)#4,365 |
| 3. | 30067 | 6.3% | 5.1%(+1.13)#176 | 5.3%(+0.993)#8,490 |
| 4. | 30062 | 4.8% | 5.1%(-0.340)#316 | 5.3%(-0.482)#13,746 |
| 5. | 30066 | 4.3% | 5.1%(-0.802)#365 | 5.3%(-0.943)#15,686 |
| 6. | 30068 | 3.9% | 5.1%(-1.29)#412 | 5.3%(-1.43)#17,708 |
| 7. | 30064 | 2.8% | 5.1%(-2.38)#527 | 5.3%(-2.52)#22,201 |
1
Common Questions
What are the Top 5 Zip Codes with the Highest Percentage of Population Employed in Food Preparation & Serving in Marietta, GA?
Top 5 Zip Codes with the Highest Percentage of Population Employed in Food Preparation & Serving in Marietta, GA are:
What zip code has the Highest Percentage of Population Employed in Food Preparation & Serving in Marietta, GA?
30060 has the Highest Percentage of Population Employed in Food Preparation & Serving in Marietta, GA with 9.0%.
What is the Percentage of Population Employed in Food Preparation & Serving in Marietta, GA?
Percentage of Population Employed in Food Preparation & Serving in Marietta is 8.1%.
What is the Percentage of Population Employed in Food Preparation & Serving in Georgia?
Percentage of Population Employed in Food Preparation & Serving in Georgia is 5.1%.
What is the Percentage of Population Employed in Food Preparation & Serving in the United States?
Percentage of Population Employed in Food Preparation & Serving in the United States is 5.3%.