Zip Codes with the Highest Percentage of Population Employed in Food Preparation & Serving in Conyers, GA
RELATED REPORTS & OPTIONS
Food Preparation & Serving
Conyers
Compare Zip Codes
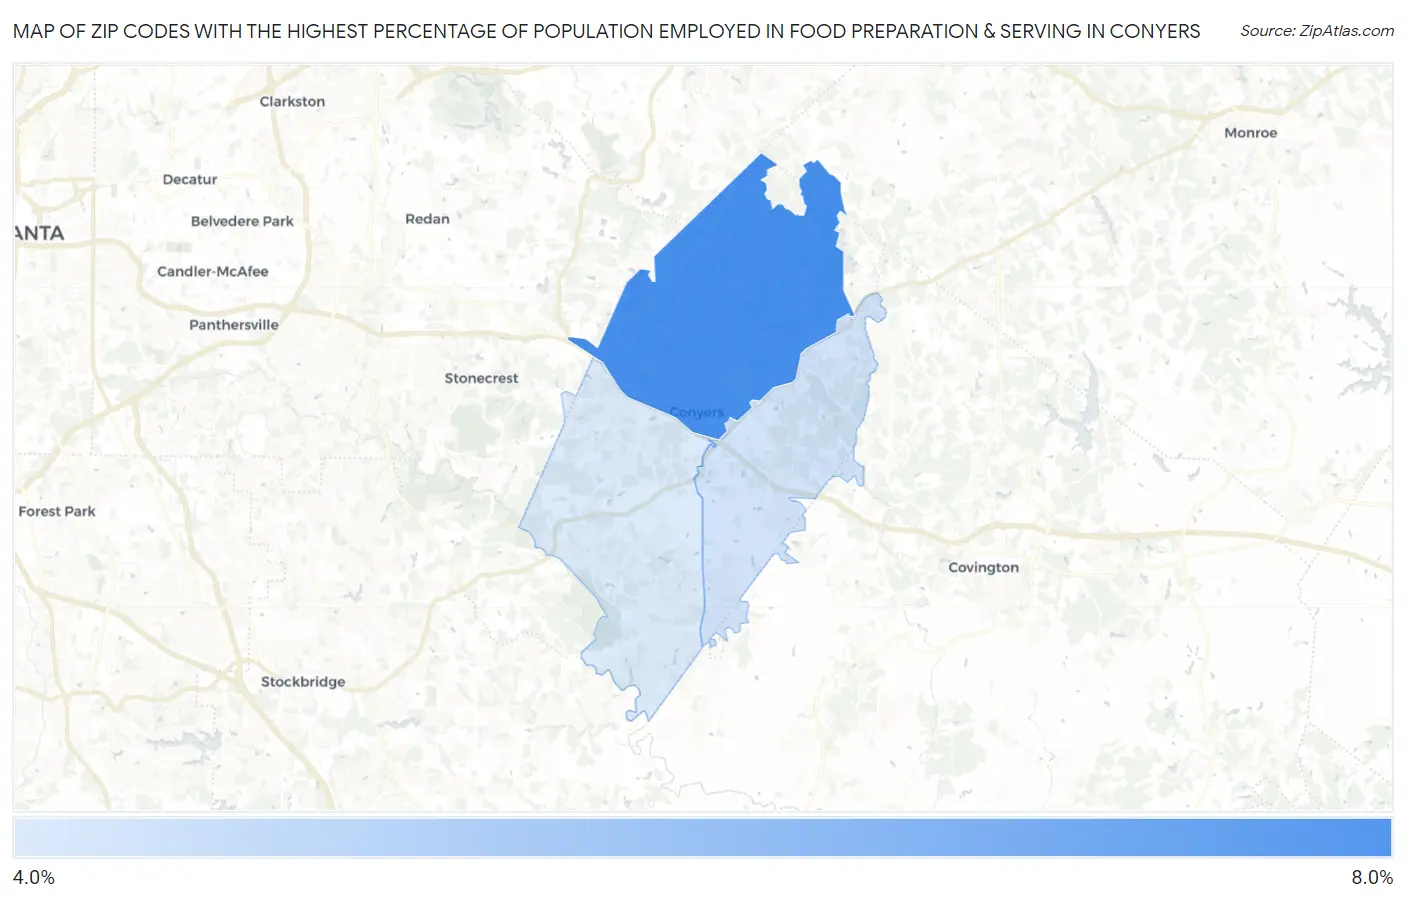
Map of Zip Codes with the Highest Percentage of Population Employed in Food Preparation & Serving in Conyers
4.2%
6.2%
Zip Codes with the Highest Percentage of Population Employed in Food Preparation & Serving in Conyers, GA
| Zip Code | % Employed | vs State | vs National | |
| 1. | 30012 | 6.2% | 5.1%(+1.03)#192 | 5.3%(+0.885)#8,817 |
| 2. | 30013 | 4.4% | 5.1%(-0.783)#362 | 5.3%(-0.924)#15,594 |
| 3. | 30094 | 4.2% | 5.1%(-0.920)#375 | 5.3%(-1.06)#16,223 |
1
Common Questions
What are the Top Zip Codes with the Highest Percentage of Population Employed in Food Preparation & Serving in Conyers, GA?
Top Zip Codes with the Highest Percentage of Population Employed in Food Preparation & Serving in Conyers, GA are:
What zip code has the Highest Percentage of Population Employed in Food Preparation & Serving in Conyers, GA?
30012 has the Highest Percentage of Population Employed in Food Preparation & Serving in Conyers, GA with 6.2%.
What is the Percentage of Population Employed in Food Preparation & Serving in Conyers, GA?
Percentage of Population Employed in Food Preparation & Serving in Conyers is 3.6%.
What is the Percentage of Population Employed in Food Preparation & Serving in Georgia?
Percentage of Population Employed in Food Preparation & Serving in Georgia is 5.1%.
What is the Percentage of Population Employed in Food Preparation & Serving in the United States?
Percentage of Population Employed in Food Preparation & Serving in the United States is 5.3%.