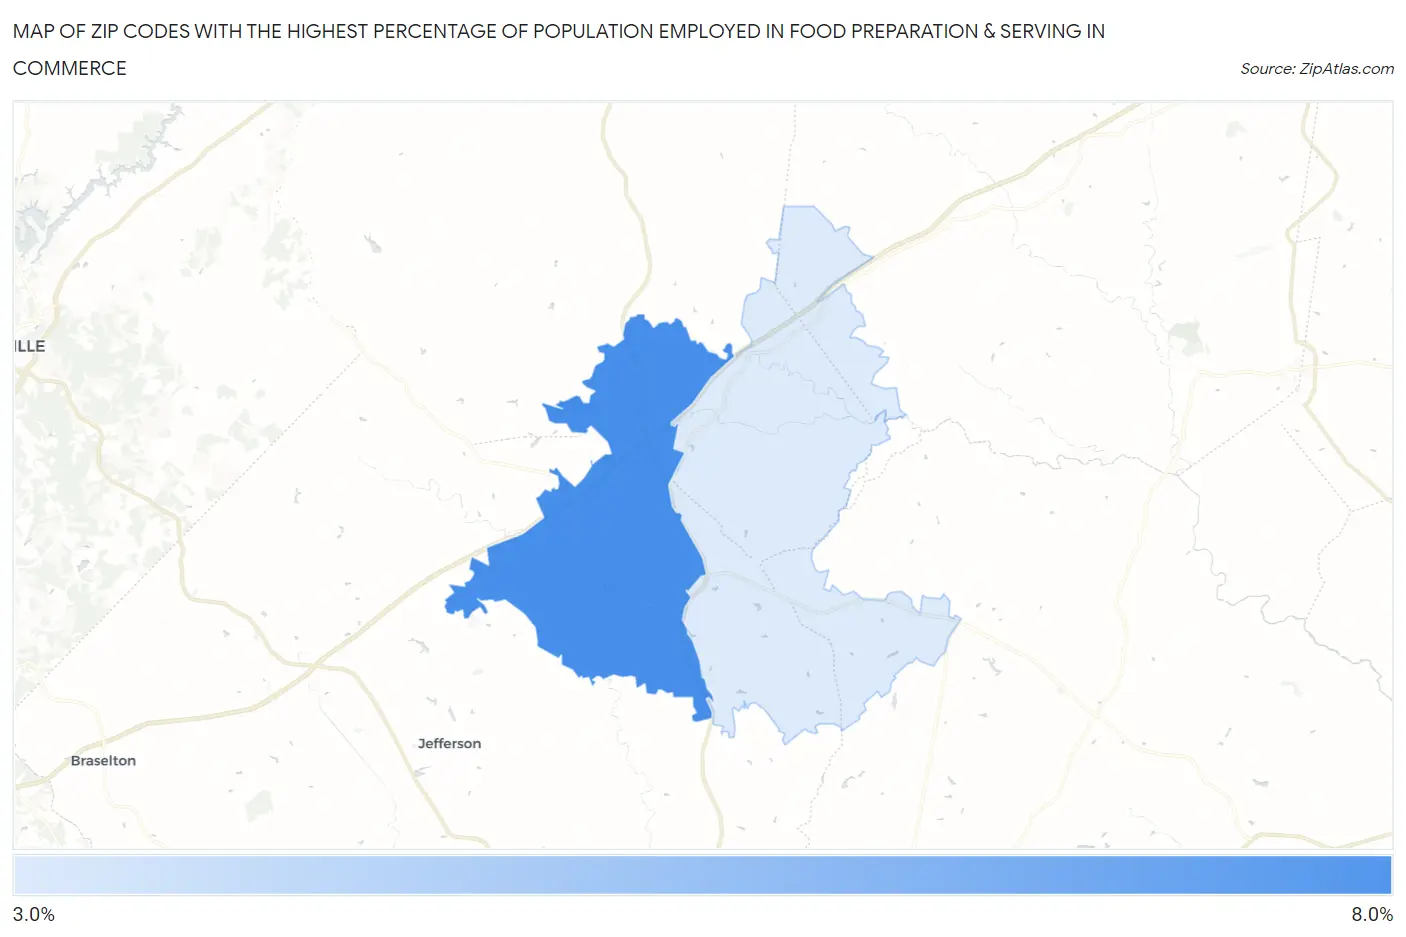
Zip Codes with the Highest Percentage of Population Employed in Food Preparation & Serving in Commerce, GA
RELATED REPORTS & OPTIONS
Food Preparation & Serving
Commerce
Compare Zip Codes
Map of Zip Codes with the Highest Percentage of Population Employed in Food Preparation & Serving in Commerce
3.5%
7.6%
Zip Codes with the Highest Percentage of Population Employed in Food Preparation & Serving in Commerce, GA
| Zip Code | % Employed | vs State | vs National | |
| 1. | 30529 | 7.6% | 5.1%(+2.41)#106 | 5.3%(+2.27)#5,457 |
| 2. | 30530 | 3.5% | 5.1%(-1.68)#463 | 5.3%(-1.82)#19,328 |
1
Common Questions
What are the Top Zip Codes with the Highest Percentage of Population Employed in Food Preparation & Serving in Commerce, GA?
Top Zip Codes with the Highest Percentage of Population Employed in Food Preparation & Serving in Commerce, GA are:
What zip code has the Highest Percentage of Population Employed in Food Preparation & Serving in Commerce, GA?
30529 has the Highest Percentage of Population Employed in Food Preparation & Serving in Commerce, GA with 7.6%.
What is the Percentage of Population Employed in Food Preparation & Serving in Commerce, GA?
Percentage of Population Employed in Food Preparation & Serving in Commerce is 8.7%.
What is the Percentage of Population Employed in Food Preparation & Serving in Georgia?
Percentage of Population Employed in Food Preparation & Serving in Georgia is 5.1%.
What is the Percentage of Population Employed in Food Preparation & Serving in the United States?
Percentage of Population Employed in Food Preparation & Serving in the United States is 5.3%.