Zip Codes with the Highest Percentage of Population Employed in Food Preparation & Serving in Austell, GA
RELATED REPORTS & OPTIONS
Food Preparation & Serving
Austell
Compare Zip Codes
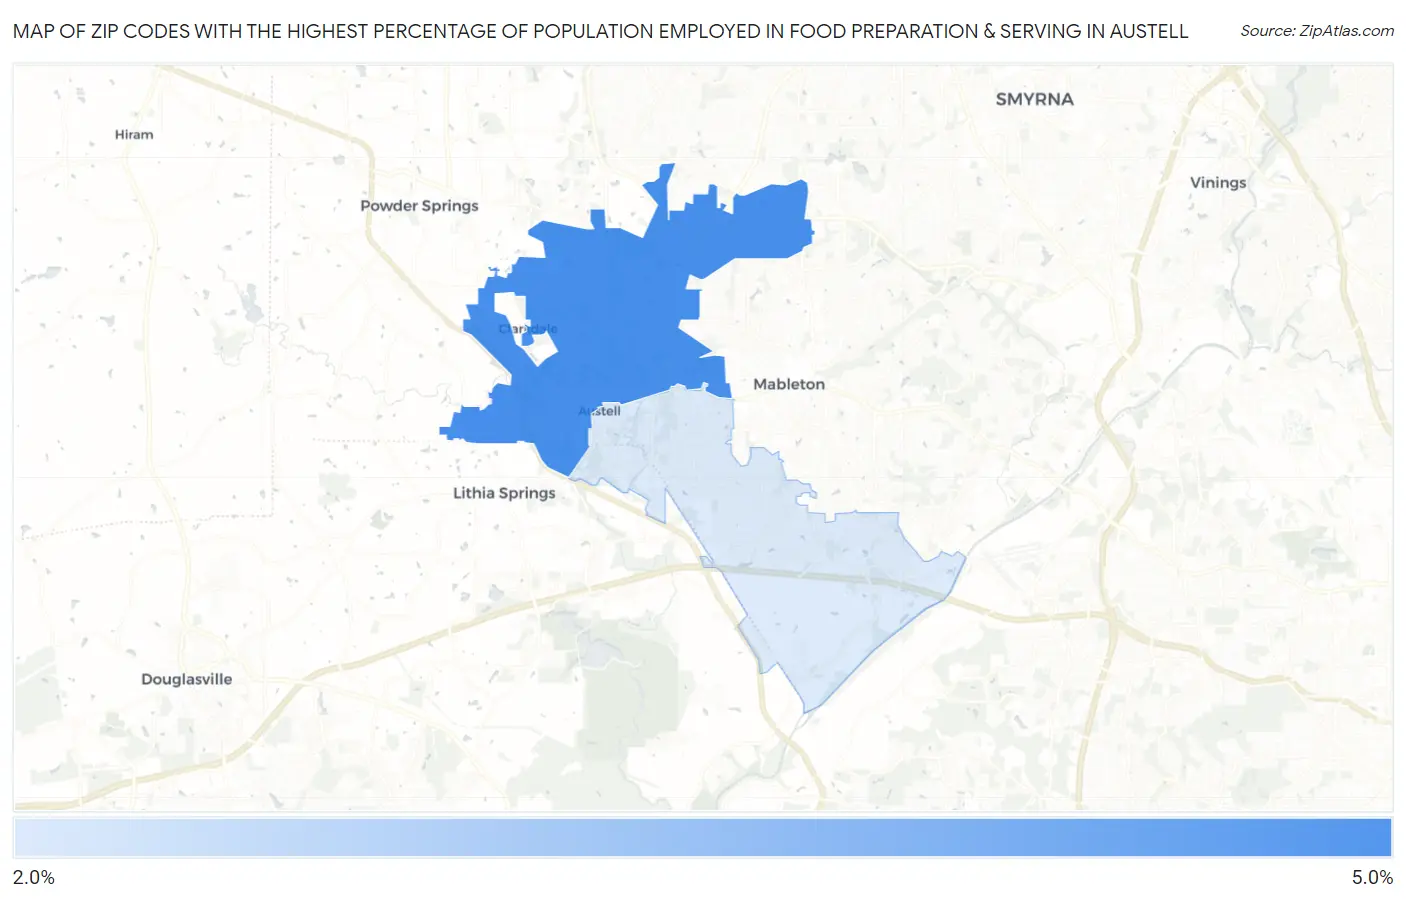
Map of Zip Codes with the Highest Percentage of Population Employed in Food Preparation & Serving in Austell
2.9%
4.7%
Zip Codes with the Highest Percentage of Population Employed in Food Preparation & Serving in Austell, GA
| Zip Code | % Employed | vs State | vs National | |
| 1. | 30106 | 4.7% | 5.1%(-0.492)#332 | 5.3%(-0.633)#14,354 |
| 2. | 30168 | 2.9% | 5.1%(-2.28)#516 | 5.3%(-2.42)#21,808 |
1
Common Questions
What are the Top Zip Codes with the Highest Percentage of Population Employed in Food Preparation & Serving in Austell, GA?
Top Zip Codes with the Highest Percentage of Population Employed in Food Preparation & Serving in Austell, GA are:
What zip code has the Highest Percentage of Population Employed in Food Preparation & Serving in Austell, GA?
30106 has the Highest Percentage of Population Employed in Food Preparation & Serving in Austell, GA with 4.7%.
What is the Percentage of Population Employed in Food Preparation & Serving in Austell, GA?
Percentage of Population Employed in Food Preparation & Serving in Austell is 8.0%.
What is the Percentage of Population Employed in Food Preparation & Serving in Georgia?
Percentage of Population Employed in Food Preparation & Serving in Georgia is 5.1%.
What is the Percentage of Population Employed in Food Preparation & Serving in the United States?
Percentage of Population Employed in Food Preparation & Serving in the United States is 5.3%.