Zip Codes with the Highest Percentage of Population Employed in Food Preparation & Serving in Atlanta, GA
RELATED REPORTS & OPTIONS
Food Preparation & Serving
Atlanta
Compare Zip Codes
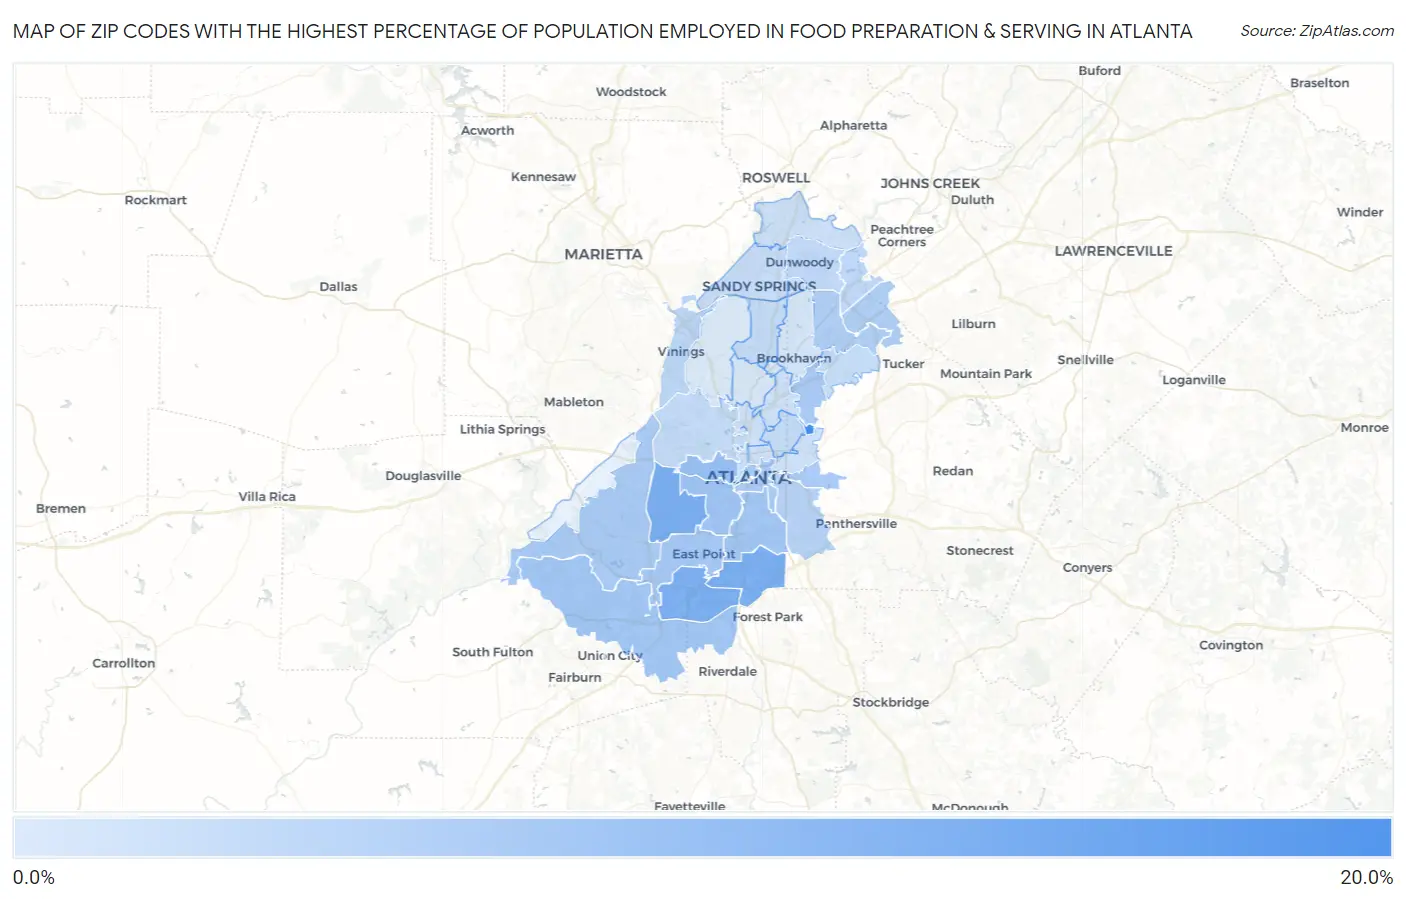
Map of Zip Codes with the Highest Percentage of Population Employed in Food Preparation & Serving in Atlanta
0.98%
17.4%
Zip Codes with the Highest Percentage of Population Employed in Food Preparation & Serving in Atlanta, GA
| Zip Code | % Employed | vs State | vs National | |
| 1. | 30322 | 17.4% | 5.1%(+12.2)#14 | 5.3%(+12.1)#717 |
| 2. | 30354 | 11.4% | 5.1%(+6.22)#34 | 5.3%(+6.08)#1,888 |
| 3. | 30311 | 11.2% | 5.1%(+6.05)#36 | 5.3%(+5.91)#1,963 |
| 4. | 30337 | 11.0% | 5.1%(+5.82)#39 | 5.3%(+5.68)#2,069 |
| 5. | 30314 | 8.1% | 5.1%(+2.99)#89 | 5.3%(+2.85)#4,530 |
| 6. | 30310 | 7.3% | 5.1%(+2.19)#114 | 5.3%(+2.05)#5,870 |
| 7. | 30315 | 7.1% | 5.1%(+1.91)#131 | 5.3%(+1.77)#6,428 |
| 8. | 30349 | 6.9% | 5.1%(+1.78)#136 | 5.3%(+1.64)#6,755 |
| 9. | 30344 | 6.8% | 5.1%(+1.62)#143 | 5.3%(+1.48)#7,147 |
| 10. | 30303 | 6.5% | 5.1%(+1.35)#157 | 5.3%(+1.21)#7,899 |
| 11. | 30331 | 6.3% | 5.1%(+1.18)#173 | 5.3%(+1.04)#8,367 |
| 12. | 30317 | 6.3% | 5.1%(+1.11)#177 | 5.3%(+0.972)#8,552 |
| 13. | 30329 | 6.2% | 5.1%(+1.05)#190 | 5.3%(+0.904)#8,767 |
| 14. | 30312 | 5.9% | 5.1%(+0.770)#210 | 5.3%(+0.629)#9,621 |
| 15. | 30341 | 5.6% | 5.1%(+0.493)#241 | 5.3%(+0.352)#10,566 |
| 16. | 30340 | 5.6% | 5.1%(+0.449)#245 | 5.3%(+0.308)#10,729 |
| 17. | 30316 | 4.9% | 5.1%(-0.261)#309 | 5.3%(-0.403)#13,427 |
| 18. | 30339 | 4.4% | 5.1%(-0.760)#358 | 5.3%(-0.901)#15,488 |
| 19. | 30360 | 4.1% | 5.1%(-1.05)#385 | 5.3%(-1.19)#16,740 |
| 20. | 30338 | 3.7% | 5.1%(-1.43)#437 | 5.3%(-1.57)#18,268 |
| 21. | 30318 | 3.7% | 5.1%(-1.47)#441 | 5.3%(-1.61)#18,473 |
| 22. | 30342 | 3.3% | 5.1%(-1.82)#476 | 5.3%(-1.96)#19,935 |
| 23. | 30345 | 3.3% | 5.1%(-1.86)#480 | 5.3%(-2.00)#20,144 |
| 24. | 30306 | 3.3% | 5.1%(-1.87)#481 | 5.3%(-2.01)#20,149 |
| 25. | 30328 | 3.1% | 5.1%(-2.08)#498 | 5.3%(-2.22)#21,015 |
| 26. | 30346 | 2.9% | 5.1%(-2.23)#512 | 5.3%(-2.37)#21,591 |
| 27. | 30363 | 2.8% | 5.1%(-2.35)#522 | 5.3%(-2.49)#22,077 |
| 28. | 30313 | 2.8% | 5.1%(-2.39)#528 | 5.3%(-2.53)#22,238 |
| 29. | 30308 | 2.7% | 5.1%(-2.43)#532 | 5.3%(-2.57)#22,383 |
| 30. | 30350 | 2.7% | 5.1%(-2.44)#534 | 5.3%(-2.58)#22,426 |
| 31. | 30307 | 2.5% | 5.1%(-2.64)#549 | 5.3%(-2.79)#23,153 |
| 32. | 30309 | 2.4% | 5.1%(-2.79)#556 | 5.3%(-2.93)#23,614 |
| 33. | 30324 | 2.3% | 5.1%(-2.81)#557 | 5.3%(-2.95)#23,657 |
| 34. | 30326 | 1.8% | 5.1%(-3.35)#586 | 5.3%(-3.49)#25,275 |
| 35. | 30319 | 1.8% | 5.1%(-3.39)#590 | 5.3%(-3.53)#25,380 |
| 36. | 30305 | 1.6% | 5.1%(-3.59)#606 | 5.3%(-3.73)#25,862 |
| 37. | 30332 | 1.0% | 5.1%(-4.13)#630 | 5.3%(-4.27)#26,949 |
| 38. | 30327 | 0.98% | 5.1%(-4.17)#631 | 5.3%(-4.31)#27,009 |
1
Common Questions
What are the Top 10 Zip Codes with the Highest Percentage of Population Employed in Food Preparation & Serving in Atlanta, GA?
Top 10 Zip Codes with the Highest Percentage of Population Employed in Food Preparation & Serving in Atlanta, GA are:
What zip code has the Highest Percentage of Population Employed in Food Preparation & Serving in Atlanta, GA?
30322 has the Highest Percentage of Population Employed in Food Preparation & Serving in Atlanta, GA with 17.4%.
What is the Percentage of Population Employed in Food Preparation & Serving in Atlanta, GA?
Percentage of Population Employed in Food Preparation & Serving in Atlanta is 4.5%.
What is the Percentage of Population Employed in Food Preparation & Serving in Georgia?
Percentage of Population Employed in Food Preparation & Serving in Georgia is 5.1%.
What is the Percentage of Population Employed in Food Preparation & Serving in the United States?
Percentage of Population Employed in Food Preparation & Serving in the United States is 5.3%.