Zip Codes with the Highest Percentage of Population Employed in Food Preparation & Serving in Kennesaw, GA
RELATED REPORTS & OPTIONS
Food Preparation & Serving
Kennesaw
Compare Zip Codes
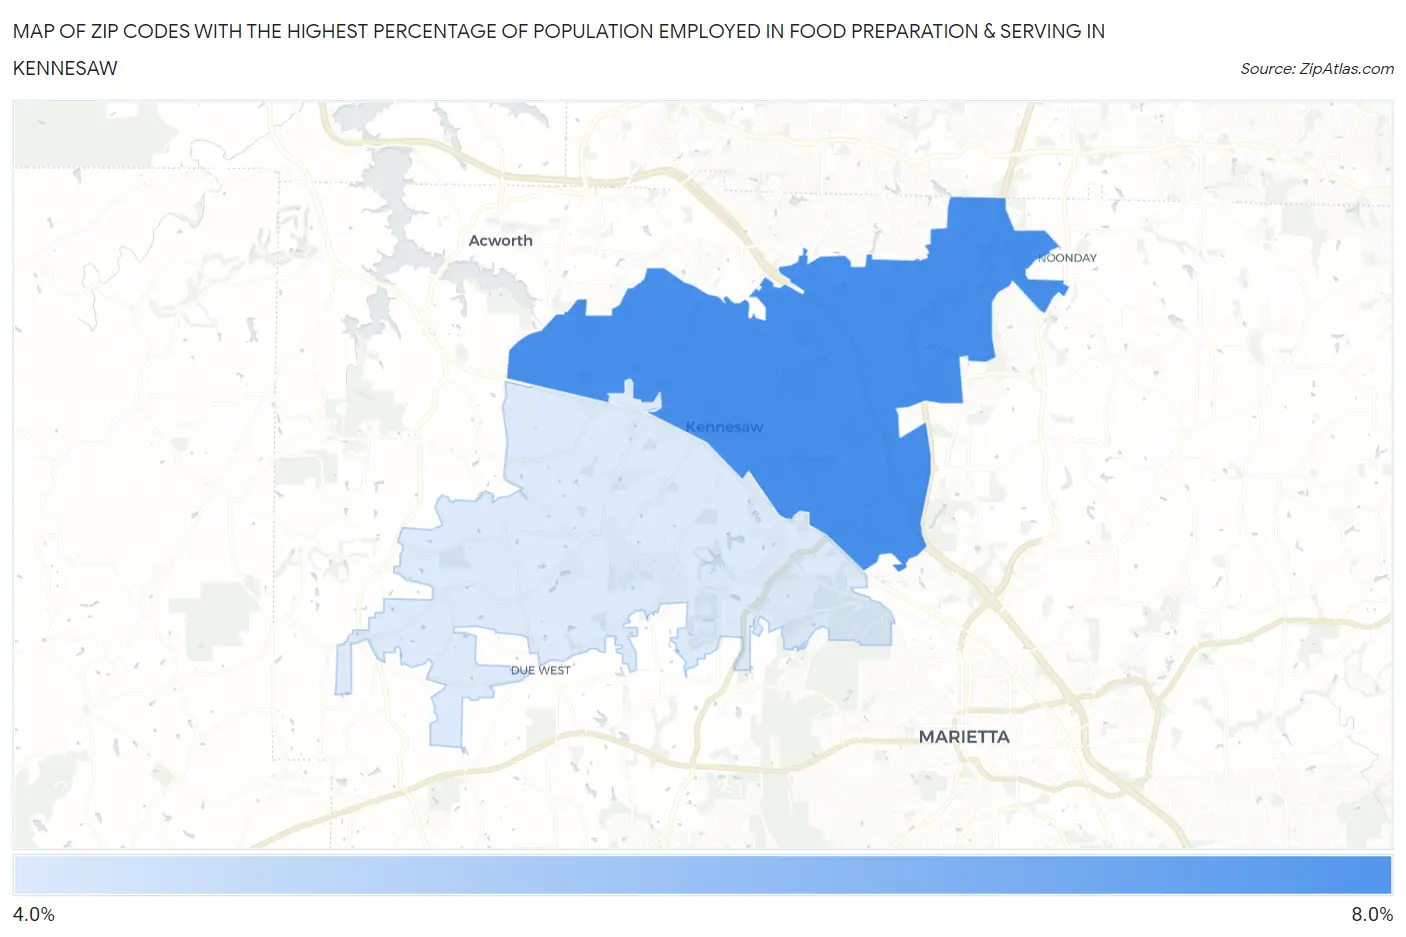
Map of Zip Codes with the Highest Percentage of Population Employed in Food Preparation & Serving in Kennesaw
4.7%
7.9%
Zip Codes with the Highest Percentage of Population Employed in Food Preparation & Serving in Kennesaw, GA
| Zip Code | % Employed | vs State | vs National | |
| 1. | 30144 | 7.9% | 5.1%(+2.77)#93 | 5.3%(+2.63)#4,868 |
| 2. | 30152 | 4.7% | 5.1%(-0.432)#326 | 5.3%(-0.574)#14,114 |
1
Common Questions
What are the Top Zip Codes with the Highest Percentage of Population Employed in Food Preparation & Serving in Kennesaw, GA?
Top Zip Codes with the Highest Percentage of Population Employed in Food Preparation & Serving in Kennesaw, GA are:
What zip code has the Highest Percentage of Population Employed in Food Preparation & Serving in Kennesaw, GA?
30144 has the Highest Percentage of Population Employed in Food Preparation & Serving in Kennesaw, GA with 7.9%.
What is the Percentage of Population Employed in Food Preparation & Serving in Kennesaw, GA?
Percentage of Population Employed in Food Preparation & Serving in Kennesaw is 7.0%.
What is the Percentage of Population Employed in Food Preparation & Serving in Georgia?
Percentage of Population Employed in Food Preparation & Serving in Georgia is 5.1%.
What is the Percentage of Population Employed in Food Preparation & Serving in the United States?
Percentage of Population Employed in Food Preparation & Serving in the United States is 5.3%.