Zip Codes with the Highest Percentage of Population with a Degree in Arts and Humanities in Georgia
RELATED REPORTS & OPTIONS
Arts and Humanities
Georgia
Compare Zip Codes
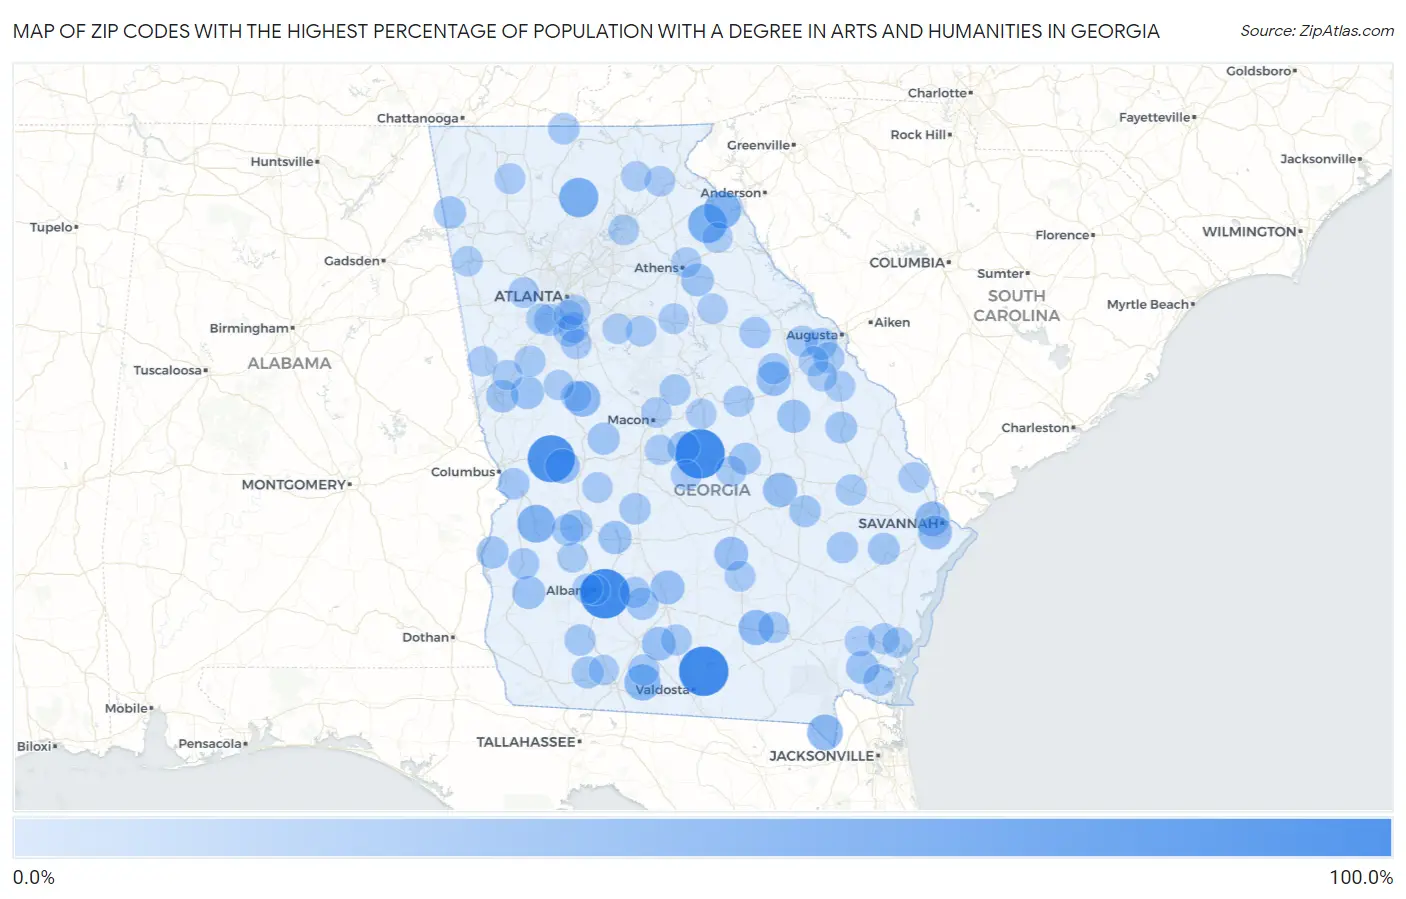
Map of Zip Codes with the Highest Percentage of Population with a Degree in Arts and Humanities in Georgia
0.0%
100.0%
Zip Codes with the Highest Percentage of Population with a Degree in Arts and Humanities in Georgia
| Zip Code | % Graduates | vs State | vs National | |
| 1. | 31699 | 100.0% | 6.4%(+93.6)#1 | 6.0%(+94.0)#14 |
| 2. | 31704 | 100.0% | 6.4%(+93.6)#2 | 6.0%(+94.0)#47 |
| 3. | 31003 | 100.0% | 6.4%(+93.6)#3 | 6.0%(+94.0)#60 |
| 4. | 31810 | 88.9% | 6.4%(+82.5)#4 | 6.0%(+82.9)#86 |
| 5. | 30148 | 52.1% | 6.4%(+45.8)#5 | 6.0%(+46.1)#192 |
| 6. | 30639 | 50.0% | 6.4%(+43.6)#6 | 6.0%(+44.0)#237 |
| 7. | 31825 | 46.1% | 6.4%(+39.8)#7 | 6.0%(+40.1)#268 |
| 8. | 30516 | 43.8% | 6.4%(+37.4)#8 | 6.0%(+37.8)#292 |
| 9. | 31720 | 38.5% | 6.4%(+32.1)#9 | 6.0%(+32.5)#378 |
| 10. | 30285 | 37.5% | 6.4%(+31.1)#10 | 6.0%(+31.5)#407 |
| 11. | 31562 | 36.4% | 6.4%(+30.0)#11 | 6.0%(+30.4)#433 |
| 12. | 31624 | 34.3% | 6.4%(+27.9)#12 | 6.0%(+28.3)#489 |
| 13. | 31408 | 31.2% | 6.4%(+24.8)#13 | 6.0%(+25.2)#616 |
| 14. | 31058 | 31.2% | 6.4%(+24.8)#14 | 6.0%(+25.2)#617 |
| 15. | 30803 | 29.6% | 6.4%(+23.3)#15 | 6.0%(+23.6)#675 |
| 16. | 30470 | 29.5% | 6.4%(+23.1)#16 | 6.0%(+23.5)#679 |
| 17. | 31733 | 27.8% | 6.4%(+21.5)#17 | 6.0%(+21.9)#771 |
| 18. | 31409 | 27.8% | 6.4%(+21.4)#18 | 6.0%(+21.8)#775 |
| 19. | 31544 | 27.8% | 6.4%(+21.4)#19 | 6.0%(+21.8)#777 |
| 20. | 31747 | 26.9% | 6.4%(+20.6)#20 | 6.0%(+20.9)#828 |
| 21. | 31735 | 25.0% | 6.4%(+18.6)#21 | 6.0%(+19.0)#959 |
| 22. | 30222 | 24.9% | 6.4%(+18.6)#22 | 6.0%(+18.9)#984 |
| 23. | 30477 | 24.8% | 6.4%(+18.4)#23 | 6.0%(+18.8)#991 |
| 24. | 39846 | 24.5% | 6.4%(+18.1)#24 | 6.0%(+18.5)#1,000 |
| 25. | 31568 | 23.6% | 6.4%(+17.2)#25 | 6.0%(+17.6)#1,061 |
| 26. | 30619 | 23.2% | 6.4%(+16.8)#26 | 6.0%(+17.2)#1,100 |
| 27. | 30241 | 22.0% | 6.4%(+15.7)#27 | 6.0%(+16.0)#1,230 |
| 28. | 31719 | 21.5% | 6.4%(+15.1)#28 | 6.0%(+15.5)#1,291 |
| 29. | 30730 | 20.7% | 6.4%(+14.3)#29 | 6.0%(+14.7)#1,386 |
| 30. | 31044 | 20.6% | 6.4%(+14.3)#30 | 6.0%(+14.6)#1,396 |
| 31. | 31078 | 20.6% | 6.4%(+14.3)#31 | 6.0%(+14.6)#1,399 |
| 32. | 31789 | 20.3% | 6.4%(+14.0)#32 | 6.0%(+14.3)#1,438 |
| 33. | 39854 | 20.1% | 6.4%(+13.7)#33 | 6.0%(+14.1)#1,464 |
| 34. | 39827 | 19.2% | 6.4%(+12.8)#34 | 6.0%(+13.2)#1,625 |
| 35. | 31315 | 19.1% | 6.4%(+12.7)#35 | 6.0%(+13.1)#1,635 |
| 36. | 30905 | 19.0% | 6.4%(+12.7)#36 | 6.0%(+13.0)#1,649 |
| 37. | 31027 | 18.8% | 6.4%(+12.5)#37 | 6.0%(+12.8)#1,679 |
| 38. | 30442 | 18.7% | 6.4%(+12.3)#38 | 6.0%(+12.7)#1,694 |
| 39. | 30291 | 18.4% | 6.4%(+12.1)#39 | 6.0%(+12.4)#1,745 |
| 40. | 30436 | 18.2% | 6.4%(+11.8)#40 | 6.0%(+12.2)#1,795 |
| 41. | 31780 | 17.9% | 6.4%(+11.6)#41 | 6.0%(+11.9)#1,860 |
| 42. | 31070 | 17.7% | 6.4%(+11.4)#42 | 6.0%(+11.7)#1,907 |
| 43. | 30555 | 17.4% | 6.4%(+11.0)#43 | 6.0%(+11.4)#1,998 |
| 44. | 31778 | 17.1% | 6.4%(+10.7)#44 | 6.0%(+11.1)#2,065 |
| 45. | 30821 | 16.8% | 6.4%(+10.5)#45 | 6.0%(+10.8)#2,115 |
| 46. | 31730 | 16.8% | 6.4%(+10.4)#46 | 6.0%(+10.8)#2,116 |
| 47. | 31905 | 16.8% | 6.4%(+10.4)#47 | 6.0%(+10.8)#2,120 |
| 48. | 39840 | 16.7% | 6.4%(+10.4)#48 | 6.0%(+10.7)#2,129 |
| 49. | 31569 | 16.7% | 6.4%(+10.3)#49 | 6.0%(+10.7)#2,139 |
| 50. | 30427 | 16.7% | 6.4%(+10.3)#50 | 6.0%(+10.7)#2,181 |
| 51. | 31552 | 16.1% | 6.4%(+9.70)#51 | 6.0%(+10.1)#2,325 |
| 52. | 30810 | 16.0% | 6.4%(+9.59)#52 | 6.0%(+9.96)#2,361 |
| 53. | 30814 | 15.8% | 6.4%(+9.41)#53 | 6.0%(+9.78)#2,403 |
| 54. | 30259 | 15.8% | 6.4%(+9.41)#54 | 6.0%(+9.78)#2,404 |
| 55. | 31033 | 15.6% | 6.4%(+9.27)#55 | 6.0%(+9.64)#2,440 |
| 56. | 30452 | 15.6% | 6.4%(+9.23)#56 | 6.0%(+9.61)#2,456 |
| 57. | 31523 | 15.5% | 6.4%(+9.13)#57 | 6.0%(+9.50)#2,494 |
| 58. | 31781 | 15.2% | 6.4%(+8.87)#58 | 6.0%(+9.24)#2,581 |
| 59. | 30815 | 15.0% | 6.4%(+8.58)#59 | 6.0%(+8.95)#2,699 |
| 60. | 31647 | 14.8% | 6.4%(+8.42)#60 | 6.0%(+8.80)#2,761 |
| 61. | 31082 | 14.7% | 6.4%(+8.36)#61 | 6.0%(+8.74)#2,786 |
| 62. | 30238 | 14.6% | 6.4%(+8.23)#62 | 6.0%(+8.61)#2,840 |
| 63. | 31329 | 14.5% | 6.4%(+8.17)#63 | 6.0%(+8.54)#2,866 |
| 64. | 30830 | 14.4% | 6.4%(+8.06)#64 | 6.0%(+8.44)#2,910 |
| 65. | 30236 | 14.3% | 6.4%(+7.89)#65 | 6.0%(+8.26)#3,009 |
| 66. | 30288 | 14.1% | 6.4%(+7.76)#66 | 6.0%(+8.14)#3,058 |
| 67. | 31519 | 14.1% | 6.4%(+7.69)#67 | 6.0%(+8.07)#3,096 |
| 68. | 31068 | 14.0% | 6.4%(+7.62)#68 | 6.0%(+7.99)#3,134 |
| 69. | 30735 | 13.9% | 6.4%(+7.53)#69 | 6.0%(+7.90)#3,172 |
| 70. | 30228 | 13.8% | 6.4%(+7.43)#70 | 6.0%(+7.81)#3,218 |
| 71. | 30256 | 13.8% | 6.4%(+7.42)#71 | 6.0%(+7.80)#3,220 |
| 72. | 30134 | 13.7% | 6.4%(+7.33)#72 | 6.0%(+7.71)#3,258 |
| 73. | 31014 | 13.6% | 6.4%(+7.20)#73 | 6.0%(+7.58)#3,323 |
| 74. | 30055 | 13.5% | 6.4%(+7.18)#74 | 6.0%(+7.55)#3,336 |
| 75. | 31566 | 13.4% | 6.4%(+7.01)#75 | 6.0%(+7.39)#3,419 |
| 76. | 31211 | 13.3% | 6.4%(+6.90)#76 | 6.0%(+7.28)#3,485 |
| 77. | 31021 | 13.3% | 6.4%(+6.88)#77 | 6.0%(+7.26)#3,495 |
| 78. | 30213 | 13.2% | 6.4%(+6.82)#78 | 6.0%(+7.19)#3,524 |
| 79. | 30535 | 13.0% | 6.4%(+6.66)#79 | 6.0%(+7.04)#3,626 |
| 80. | 30650 | 13.0% | 6.4%(+6.62)#80 | 6.0%(+7.00)#3,644 |
| 81. | 30125 | 13.0% | 6.4%(+6.59)#81 | 6.0%(+6.97)#3,669 |
| 82. | 31520 | 12.8% | 6.4%(+6.39)#82 | 6.0%(+6.77)#3,791 |
| 83. | 30669 | 12.7% | 6.4%(+6.34)#83 | 6.0%(+6.72)#3,828 |
| 84. | 30016 | 12.6% | 6.4%(+6.26)#84 | 6.0%(+6.63)#3,875 |
| 85. | 30217 | 12.6% | 6.4%(+6.23)#85 | 6.0%(+6.61)#3,887 |
| 86. | 31701 | 12.6% | 6.4%(+6.20)#86 | 6.0%(+6.58)#3,903 |
| 87. | 30566 | 12.6% | 6.4%(+6.19)#87 | 6.0%(+6.57)#3,912 |
| 88. | 31054 | 12.6% | 6.4%(+6.18)#88 | 6.0%(+6.56)#3,915 |
| 89. | 30624 | 12.5% | 6.4%(+6.17)#89 | 6.0%(+6.54)#3,926 |
| 90. | 30206 | 12.5% | 6.4%(+6.13)#90 | 6.0%(+6.50)#3,945 |
| 91. | 31707 | 12.4% | 6.4%(+6.05)#91 | 6.0%(+6.43)#4,030 |
| 92. | 31773 | 12.4% | 6.4%(+6.02)#92 | 6.0%(+6.40)#4,049 |
| 93. | 30528 | 12.3% | 6.4%(+5.90)#93 | 6.0%(+6.27)#4,133 |
| 94. | 39826 | 12.2% | 6.4%(+5.87)#94 | 6.0%(+6.25)#4,148 |
| 95. | 30601 | 12.2% | 6.4%(+5.85)#95 | 6.0%(+6.23)#4,164 |
| 96. | 30816 | 12.1% | 6.4%(+5.75)#96 | 6.0%(+6.13)#4,221 |
| 97. | 30230 | 12.1% | 6.4%(+5.74)#97 | 6.0%(+6.12)#4,232 |
| 98. | 31098 | 12.1% | 6.4%(+5.71)#98 | 6.0%(+6.08)#4,259 |
| 99. | 30805 | 12.1% | 6.4%(+5.71)#99 | 6.0%(+6.08)#4,260 |
| 100. | 30297 | 12.1% | 6.4%(+5.69)#100 | 6.0%(+6.07)#4,268 |
Common Questions
What are the Top 10 Zip Codes with the Highest Percentage of Population with a Degree in Arts and Humanities in Georgia?
Top 10 Zip Codes with the Highest Percentage of Population with a Degree in Arts and Humanities in Georgia are:
What zip code has the Highest Percentage of Population with a Degree in Arts and Humanities in Georgia?
31699 has the Highest Percentage of Population with a Degree in Arts and Humanities in Georgia with 100.0%.
What is the Percentage of Population with a Degree in Arts and Humanities in the State of Georgia?
Percentage of Population with a Degree in Arts and Humanities in Georgia is 6.4%.
What is the Percentage of Population with a Degree in Arts and Humanities in the United States?
Percentage of Population with a Degree in Arts and Humanities in the United States is 6.0%.