Zip Codes with the Highest Percentage of Population Employed in Food Preparation & Serving in Americus, GA
RELATED REPORTS & OPTIONS
Food Preparation & Serving
Americus
Compare Zip Codes
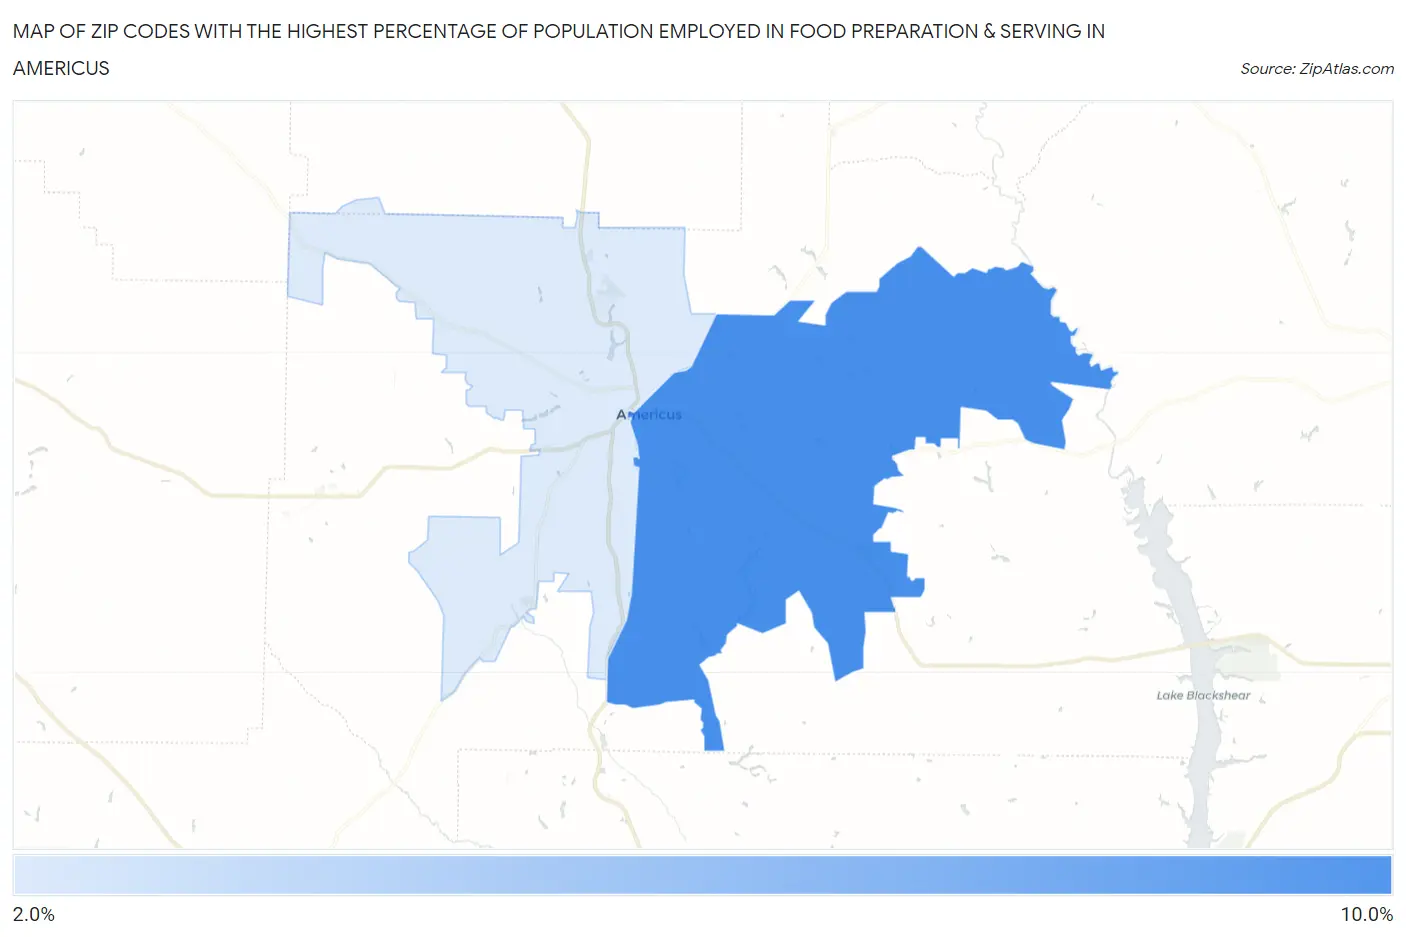
Map of Zip Codes with the Highest Percentage of Population Employed in Food Preparation & Serving in Americus
2.9%
8.7%
Zip Codes with the Highest Percentage of Population Employed in Food Preparation & Serving in Americus, GA
| Zip Code | % Employed | vs State | vs National | |
| 1. | 31709 | 8.7% | 5.1%(+3.57)#73 | 5.3%(+3.43)#3,827 |
| 2. | 31719 | 2.9% | 5.1%(-2.25)#515 | 5.3%(-2.40)#21,695 |
1
Common Questions
What are the Top Zip Codes with the Highest Percentage of Population Employed in Food Preparation & Serving in Americus, GA?
Top Zip Codes with the Highest Percentage of Population Employed in Food Preparation & Serving in Americus, GA are:
What zip code has the Highest Percentage of Population Employed in Food Preparation & Serving in Americus, GA?
31709 has the Highest Percentage of Population Employed in Food Preparation & Serving in Americus, GA with 8.7%.
What is the Percentage of Population Employed in Food Preparation & Serving in Americus, GA?
Percentage of Population Employed in Food Preparation & Serving in Americus is 7.9%.
What is the Percentage of Population Employed in Food Preparation & Serving in Georgia?
Percentage of Population Employed in Food Preparation & Serving in Georgia is 5.1%.
What is the Percentage of Population Employed in Food Preparation & Serving in the United States?
Percentage of Population Employed in Food Preparation & Serving in the United States is 5.3%.