Zip Codes with the Highest Percentage of Population Employed in Food Preparation & Serving in Cartersville, GA
RELATED REPORTS & OPTIONS
Food Preparation & Serving
Cartersville
Compare Zip Codes
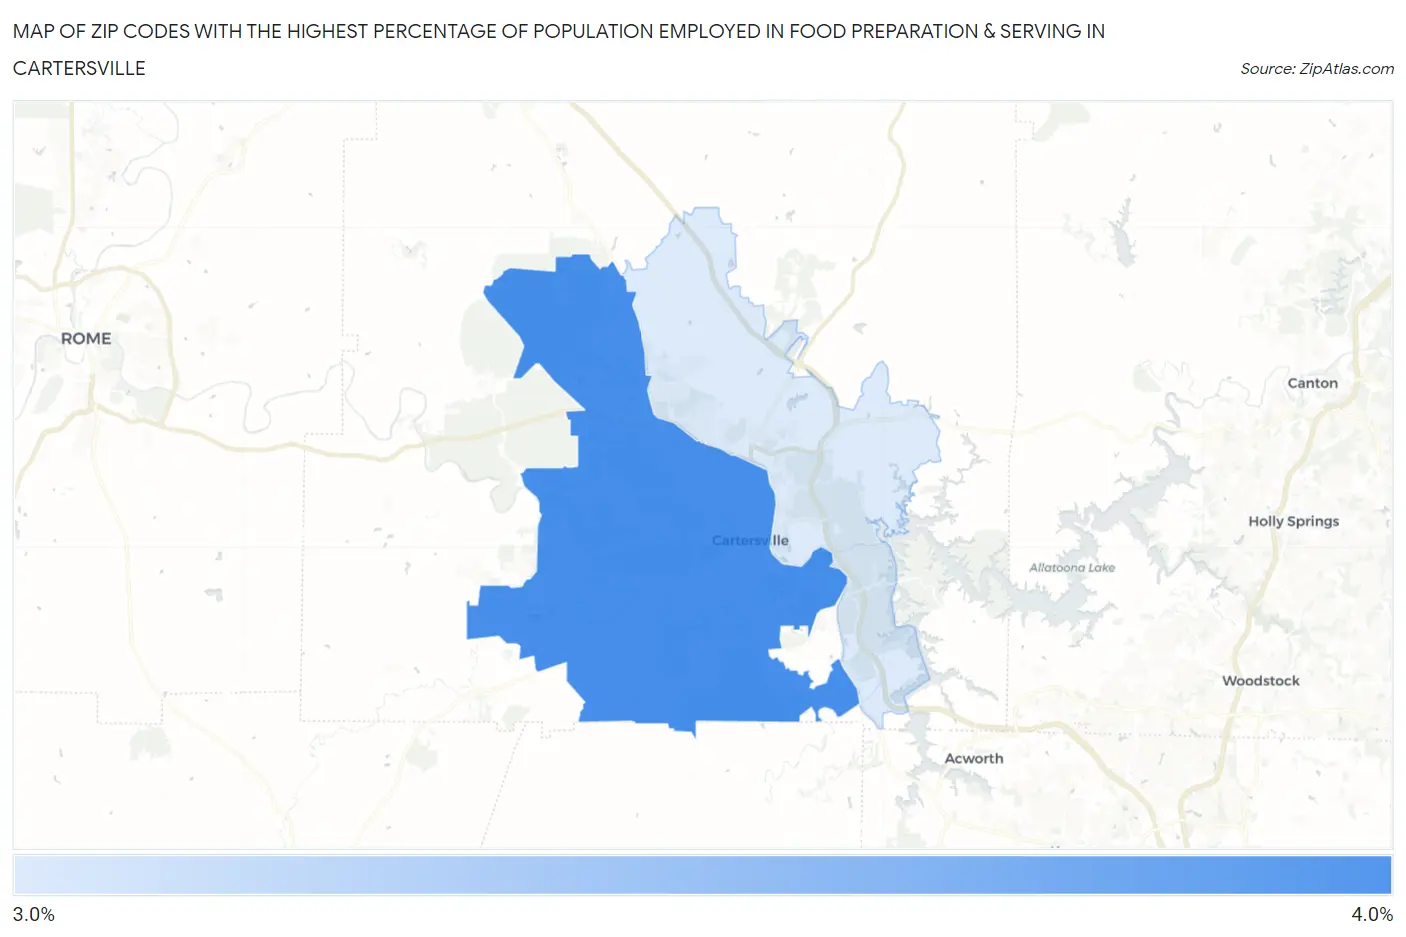
Map of Zip Codes with the Highest Percentage of Population Employed in Food Preparation & Serving in Cartersville
3.3%
3.8%
Zip Codes with the Highest Percentage of Population Employed in Food Preparation & Serving in Cartersville, GA
| Zip Code | % Employed | vs State | vs National | |
| 1. | 30120 | 3.8% | 5.1%(-1.31)#418 | 5.3%(-1.45)#17,798 |
| 2. | 30121 | 3.3% | 5.1%(-1.83)#478 | 5.3%(-1.98)#20,024 |
1
Common Questions
What are the Top Zip Codes with the Highest Percentage of Population Employed in Food Preparation & Serving in Cartersville, GA?
Top Zip Codes with the Highest Percentage of Population Employed in Food Preparation & Serving in Cartersville, GA are:
What zip code has the Highest Percentage of Population Employed in Food Preparation & Serving in Cartersville, GA?
30120 has the Highest Percentage of Population Employed in Food Preparation & Serving in Cartersville, GA with 3.8%.
What is the Percentage of Population Employed in Food Preparation & Serving in Cartersville, GA?
Percentage of Population Employed in Food Preparation & Serving in Cartersville is 3.2%.
What is the Percentage of Population Employed in Food Preparation & Serving in Georgia?
Percentage of Population Employed in Food Preparation & Serving in Georgia is 5.1%.
What is the Percentage of Population Employed in Food Preparation & Serving in the United States?
Percentage of Population Employed in Food Preparation & Serving in the United States is 5.3%.