Zip Codes with the Highest Percentage of Population Employed in Farming, Fishing & Forestry in Georgia
RELATED REPORTS & OPTIONS
Farming, Fishing & Forestry
Georgia
Compare Zip Codes
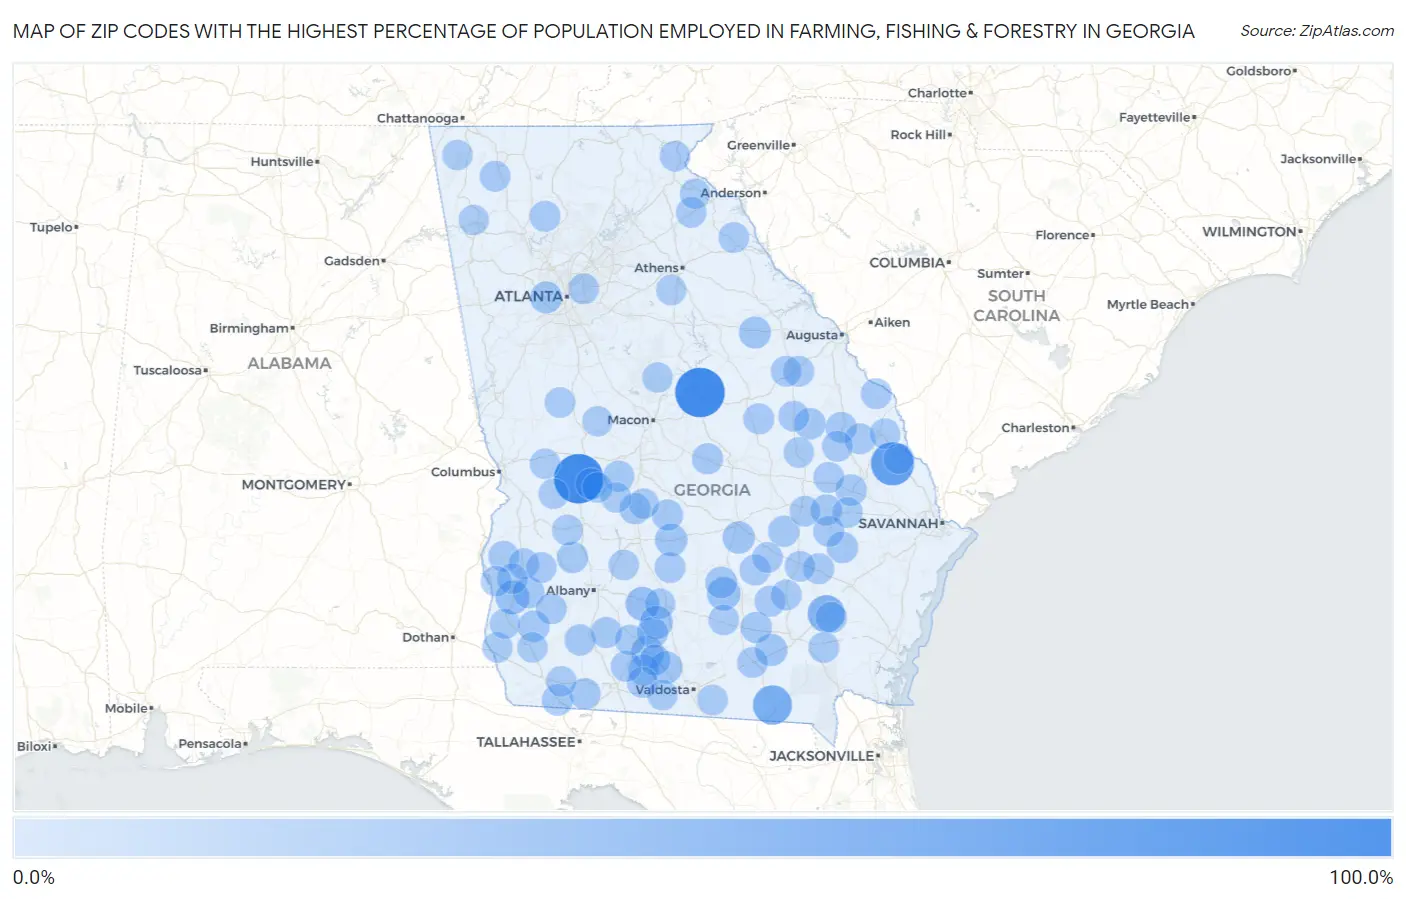
Map of Zip Codes with the Highest Percentage of Population Employed in Farming, Fishing & Forestry in Georgia
0.0%
100.0%
Zip Codes with the Highest Percentage of Population Employed in Farming, Fishing & Forestry in Georgia
| Zip Code | % Employed | vs State | vs National | |
| 1. | 31062 | 100.0% | 0.45%(+99.5)#1 | 0.61%(+99.4)#7 |
| 2. | 31081 | 100.0% | 0.45%(+99.5)#2 | 0.61%(+99.4)#8 |
| 3. | 30449 | 66.7% | 0.45%(+66.2)#3 | 0.61%(+66.1)#26 |
| 4. | 31631 | 46.9% | 0.45%(+46.5)#4 | 0.61%(+46.3)#66 |
| 5. | 31556 | 36.8% | 0.45%(+36.4)#5 | 0.61%(+36.2)#122 |
| 6. | 31789 | 19.2% | 0.45%(+18.8)#6 | 0.61%(+18.6)#436 |
| 7. | 39824 | 18.8% | 0.45%(+18.4)#7 | 0.61%(+18.2)#450 |
| 8. | 31512 | 17.4% | 0.45%(+16.9)#8 | 0.61%(+16.8)#514 |
| 9. | 31775 | 16.5% | 0.45%(+16.0)#9 | 0.61%(+15.9)#564 |
| 10. | 31788 | 14.2% | 0.45%(+13.7)#10 | 0.61%(+13.6)#704 |
| 11. | 31079 | 13.0% | 0.45%(+12.5)#11 | 0.61%(+12.4)#814 |
| 12. | 31625 | 12.4% | 0.45%(+12.0)#12 | 0.61%(+11.8)#882 |
| 13. | 31550 | 12.1% | 0.45%(+11.7)#13 | 0.61%(+11.5)#920 |
| 14. | 31055 | 12.0% | 0.45%(+11.5)#14 | 0.61%(+11.4)#933 |
| 15. | 30821 | 10.4% | 0.45%(+9.93)#15 | 0.61%(+9.78)#1,146 |
| 16. | 30336 | 10.0% | 0.45%(+9.55)#16 | 0.61%(+9.39)#1,206 |
| 17. | 31798 | 9.3% | 0.45%(+8.86)#17 | 0.61%(+8.70)#1,338 |
| 18. | 39841 | 8.4% | 0.45%(+7.98)#18 | 0.61%(+7.82)#1,540 |
| 19. | 39846 | 8.3% | 0.45%(+7.80)#19 | 0.61%(+7.65)#1,588 |
| 20. | 30441 | 8.2% | 0.45%(+7.70)#20 | 0.61%(+7.55)#1,620 |
| 21. | 30427 | 7.9% | 0.45%(+7.50)#21 | 0.61%(+7.34)#1,683 |
| 22. | 39815 | 7.6% | 0.45%(+7.17)#22 | 0.61%(+7.02)#1,784 |
| 23. | 31624 | 7.5% | 0.45%(+7.01)#23 | 0.61%(+6.86)#1,830 |
| 24. | 31041 | 7.1% | 0.45%(+6.69)#24 | 0.61%(+6.54)#1,929 |
| 25. | 30452 | 7.0% | 0.45%(+6.57)#25 | 0.61%(+6.42)#1,968 |
| 26. | 39826 | 6.9% | 0.45%(+6.49)#26 | 0.61%(+6.33)#2,004 |
| 27. | 30473 | 6.9% | 0.45%(+6.45)#27 | 0.61%(+6.30)#2,020 |
| 28. | 31071 | 6.9% | 0.45%(+6.40)#28 | 0.61%(+6.25)#2,041 |
| 29. | 39828 | 6.7% | 0.45%(+6.23)#29 | 0.61%(+6.07)#2,100 |
| 30. | 31557 | 6.4% | 0.45%(+5.95)#30 | 0.61%(+5.80)#2,199 |
| 31. | 31778 | 6.3% | 0.45%(+5.86)#31 | 0.61%(+5.70)#2,232 |
| 32. | 31065 | 6.3% | 0.45%(+5.84)#32 | 0.61%(+5.69)#2,238 |
| 33. | 31730 | 6.2% | 0.45%(+5.79)#33 | 0.61%(+5.64)#2,275 |
| 34. | 31057 | 6.1% | 0.45%(+5.67)#34 | 0.61%(+5.52)#2,329 |
| 35. | 31070 | 6.1% | 0.45%(+5.65)#35 | 0.61%(+5.49)#2,345 |
| 36. | 31771 | 6.0% | 0.45%(+5.60)#36 | 0.61%(+5.44)#2,370 |
| 37. | 31784 | 6.0% | 0.45%(+5.53)#37 | 0.61%(+5.37)#2,400 |
| 38. | 31722 | 5.9% | 0.45%(+5.41)#38 | 0.61%(+5.26)#2,462 |
| 39. | 30421 | 5.8% | 0.45%(+5.34)#39 | 0.61%(+5.19)#2,497 |
| 40. | 30453 | 5.7% | 0.45%(+5.28)#40 | 0.61%(+5.12)#2,534 |
| 41. | 30442 | 5.7% | 0.45%(+5.22)#41 | 0.61%(+5.06)#2,565 |
| 42. | 30455 | 5.4% | 0.45%(+4.98)#42 | 0.61%(+4.83)#2,687 |
| 43. | 31554 | 5.3% | 0.45%(+4.89)#43 | 0.61%(+4.73)#2,726 |
| 44. | 31035 | 5.3% | 0.45%(+4.83)#44 | 0.61%(+4.68)#2,753 |
| 45. | 30833 | 5.3% | 0.45%(+4.82)#45 | 0.61%(+4.66)#2,761 |
| 46. | 31563 | 5.2% | 0.45%(+4.72)#46 | 0.61%(+4.56)#2,817 |
| 47. | 31634 | 5.1% | 0.45%(+4.61)#47 | 0.61%(+4.46)#2,888 |
| 48. | 31720 | 5.1% | 0.45%(+4.60)#48 | 0.61%(+4.44)#2,897 |
| 49. | 31738 | 5.0% | 0.45%(+4.59)#49 | 0.61%(+4.44)#2,901 |
| 50. | 30425 | 5.0% | 0.45%(+4.57)#50 | 0.61%(+4.42)#2,914 |
| 51. | 31783 | 5.0% | 0.45%(+4.57)#51 | 0.61%(+4.41)#2,916 |
| 52. | 30746 | 5.0% | 0.45%(+4.54)#52 | 0.61%(+4.39)#2,934 |
| 53. | 31532 | 5.0% | 0.45%(+4.52)#53 | 0.61%(+4.36)#2,949 |
| 54. | 39862 | 4.9% | 0.45%(+4.47)#54 | 0.61%(+4.31)#2,981 |
| 55. | 30439 | 4.9% | 0.45%(+4.46)#55 | 0.61%(+4.31)#2,987 |
| 56. | 31510 | 4.9% | 0.45%(+4.46)#56 | 0.61%(+4.31)#2,988 |
| 57. | 30183 | 4.9% | 0.45%(+4.43)#57 | 0.61%(+4.28)#3,007 |
| 58. | 31780 | 4.8% | 0.45%(+4.39)#58 | 0.61%(+4.24)#3,036 |
| 59. | 30823 | 4.7% | 0.45%(+4.26)#59 | 0.61%(+4.11)#3,142 |
| 60. | 30426 | 4.7% | 0.45%(+4.23)#60 | 0.61%(+4.07)#3,167 |
| 61. | 31542 | 4.7% | 0.45%(+4.21)#61 | 0.61%(+4.05)#3,183 |
| 62. | 30021 | 4.5% | 0.45%(+4.00)#62 | 0.61%(+3.85)#3,347 |
| 63. | 39867 | 4.4% | 0.45%(+3.93)#63 | 0.61%(+3.77)#3,393 |
| 64. | 30477 | 4.3% | 0.45%(+3.83)#64 | 0.61%(+3.67)#3,477 |
| 65. | 31539 | 4.3% | 0.45%(+3.82)#65 | 0.61%(+3.67)#3,478 |
| 66. | 30634 | 4.2% | 0.45%(+3.71)#66 | 0.61%(+3.55)#3,578 |
| 67. | 39840 | 4.1% | 0.45%(+3.65)#67 | 0.61%(+3.49)#3,633 |
| 68. | 31643 | 3.9% | 0.45%(+3.50)#68 | 0.61%(+3.34)#3,765 |
| 69. | 30436 | 3.9% | 0.45%(+3.45)#69 | 0.61%(+3.30)#3,807 |
| 70. | 31636 | 3.8% | 0.45%(+3.37)#70 | 0.61%(+3.22)#3,879 |
| 71. | 39886 | 3.8% | 0.45%(+3.37)#71 | 0.61%(+3.21)#3,884 |
| 72. | 39836 | 3.8% | 0.45%(+3.34)#72 | 0.61%(+3.19)#3,909 |
| 73. | 39851 | 3.7% | 0.45%(+3.29)#73 | 0.61%(+3.14)#3,949 |
| 74. | 31513 | 3.7% | 0.45%(+3.28)#74 | 0.61%(+3.12)#3,970 |
| 75. | 30521 | 3.6% | 0.45%(+3.12)#75 | 0.61%(+2.96)#4,127 |
| 76. | 31650 | 3.6% | 0.45%(+3.12)#76 | 0.61%(+2.96)#4,130 |
| 77. | 30552 | 3.5% | 0.45%(+3.08)#77 | 0.61%(+2.93)#4,166 |
| 78. | 30417 | 3.5% | 0.45%(+3.00)#78 | 0.61%(+2.85)#4,251 |
| 79. | 30467 | 3.4% | 0.45%(+2.97)#79 | 0.61%(+2.81)#4,301 |
| 80. | 30621 | 3.4% | 0.45%(+2.96)#80 | 0.61%(+2.81)#4,310 |
| 81. | 31091 | 3.4% | 0.45%(+2.92)#81 | 0.61%(+2.76)#4,370 |
| 82. | 30401 | 3.3% | 0.45%(+2.85)#82 | 0.61%(+2.69)#4,439 |
| 83. | 31768 | 3.2% | 0.45%(+2.79)#83 | 0.61%(+2.64)#4,499 |
| 84. | 39861 | 3.2% | 0.45%(+2.72)#84 | 0.61%(+2.56)#4,599 |
| 85. | 31063 | 3.1% | 0.45%(+2.64)#85 | 0.61%(+2.48)#4,699 |
| 86. | 30446 | 3.1% | 0.45%(+2.61)#86 | 0.61%(+2.45)#4,732 |
| 87. | 30258 | 3.0% | 0.45%(+2.55)#87 | 0.61%(+2.40)#4,809 |
| 88. | 31796 | 2.9% | 0.45%(+2.50)#88 | 0.61%(+2.34)#4,888 |
| 89. | 39834 | 2.9% | 0.45%(+2.50)#89 | 0.61%(+2.34)#4,889 |
| 90. | 31016 | 2.9% | 0.45%(+2.48)#90 | 0.61%(+2.33)#4,913 |
| 91. | 31801 | 2.8% | 0.45%(+2.31)#91 | 0.61%(+2.16)#5,163 |
| 92. | 31793 | 2.8% | 0.45%(+2.30)#92 | 0.61%(+2.15)#5,175 |
| 93. | 31068 | 2.7% | 0.45%(+2.27)#93 | 0.61%(+2.11)#5,215 |
| 94. | 30538 | 2.7% | 0.45%(+2.26)#94 | 0.61%(+2.10)#5,232 |
| 95. | 39837 | 2.7% | 0.45%(+2.21)#95 | 0.61%(+2.05)#5,309 |
| 96. | 31038 | 2.7% | 0.45%(+2.20)#96 | 0.61%(+2.05)#5,319 |
| 97. | 39823 | 2.6% | 0.45%(+2.19)#97 | 0.61%(+2.03)#5,328 |
| 98. | 30707 | 2.6% | 0.45%(+2.11)#98 | 0.61%(+1.95)#5,458 |
| 99. | 31803 | 2.5% | 0.45%(+2.09)#99 | 0.61%(+1.93)#5,485 |
| 100. | 30149 | 2.5% | 0.45%(+2.08)#100 | 0.61%(+1.93)#5,493 |
Common Questions
What are the Top 10 Zip Codes with the Highest Percentage of Population Employed in Farming, Fishing & Forestry in Georgia?
Top 10 Zip Codes with the Highest Percentage of Population Employed in Farming, Fishing & Forestry in Georgia are:
What zip code has the Highest Percentage of Population Employed in Farming, Fishing & Forestry in Georgia?
31062 has the Highest Percentage of Population Employed in Farming, Fishing & Forestry in Georgia with 100.0%.
What is the Percentage of Population Employed in Farming, Fishing & Forestry in the State of Georgia?
Percentage of Population Employed in Farming, Fishing & Forestry in Georgia is 0.45%.
What is the Percentage of Population Employed in Farming, Fishing & Forestry in the United States?
Percentage of Population Employed in Farming, Fishing & Forestry in the United States is 0.61%.