Zip Codes with the Highest Percentage of Population with a Degree in Bio, Nature & Agricultural in Georgia
RELATED REPORTS & OPTIONS
Bio, Nature & Agricultural
Georgia
Compare Zip Codes
Map of Zip Codes with the Highest Percentage of Population with a Degree in Bio, Nature & Agricultural in Georgia
0.0%
80.0%
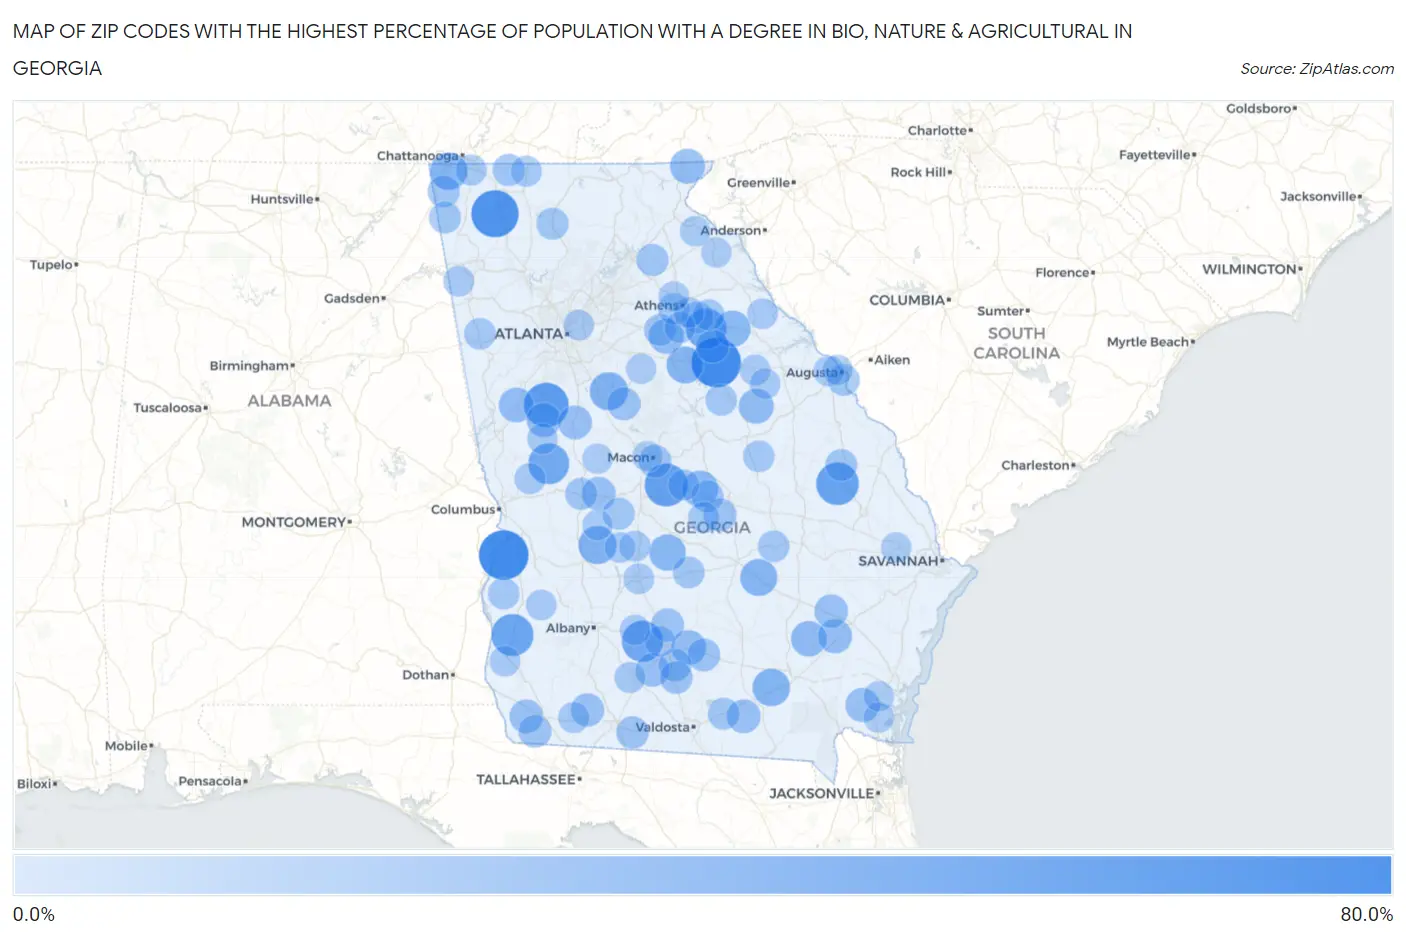
Zip Codes with the Highest Percentage of Population with a Degree in Bio, Nature & Agricultural in Georgia
| Zip Code | % Graduates | vs State | vs National | |
| 1. | 30665 | 63.6% | 5.6% (+58.0)#1 | 6.4% (+57.3)#201 |
| 2. | 31821 | 63.6% | 5.6% (+58.0)#2 | 6.4% (+57.3)#203 |
| 3. | 30746 | 57.1% | 5.6% (+51.5)#3 | 6.4% (+50.8)#246 |
| 4. | 30229 | 50.0% | 5.6% (+44.4)#4 | 6.4% (+43.6)#365 |
| 5. | 31020 | 45.5% | 5.6% (+39.9)#5 | 6.4% (+39.1)#435 |
| 6. | 30425 | 44.4% | 5.6% (+38.8)#6 | 6.4% (+38.0)#472 |
| 7. | 39824 | 42.7% | 5.6% (+37.1)#7 | 6.4% (+36.4)#505 |
| 8. | 31789 | 40.7% | 5.6% (+35.1)#8 | 6.4% (+34.3)#549 |
| 9. | 31836 | 39.6% | 5.6% (+34.0)#9 | 6.4% (+33.2)#589 |
| 10. | 30667 | 38.9% | 5.6% (+33.3)#10 | 6.4% (+32.6)#608 |
| 11. | 30234 | 31.9% | 5.6% (+26.3)#11 | 6.4% (+25.6)#958 |
| 12. | 31711 | 31.9% | 5.6% (+26.3)#12 | 6.4% (+25.6)#961 |
| 13. | 31550 | 30.3% | 5.6% (+24.7)#13 | 6.4% (+23.9)#1,060 |
| 14. | 30757 | 29.8% | 5.6% (+24.2)#14 | 6.4% (+23.5)#1,101 |
| 15. | 31549 | 28.8% | 5.6% (+23.3)#15 | 6.4% (+22.5)#1,171 |
| 16. | 30625 | 28.3% | 5.6% (+22.7)#16 | 6.4% (+21.9)#1,217 |
| 17. | 31071 | 27.7% | 5.6% (+22.1)#17 | 6.4% (+21.3)#1,283 |
| 18. | 31017 | 27.2% | 5.6% (+21.6)#18 | 6.4% (+20.9)#1,330 |
| 19. | 30660 | 26.7% | 5.6% (+21.1)#19 | 6.4% (+20.4)#1,369 |
| 20. | 31551 | 24.8% | 5.6% (+19.2)#20 | 6.4% (+18.4)#1,632 |
| 21. | 30623 | 24.0% | 5.6% (+18.4)#21 | 6.4% (+17.6)#1,720 |
| 22. | 30820 | 23.4% | 5.6% (+17.8)#22 | 6.4% (+17.1)#1,813 |
| 23. | 30537 | 23.1% | 5.6% (+17.5)#23 | 6.4% (+16.7)#1,875 |
| 24. | 30220 | 22.9% | 5.6% (+17.3)#24 | 6.4% (+16.6)#1,893 |
| 25. | 31749 | 22.4% | 5.6% (+16.8)#25 | 6.4% (+16.1)#1,989 |
| 26. | 30218 | 21.6% | 5.6% (+16.0)#26 | 6.4% (+15.2)#2,177 |
| 27. | 31560 | 21.3% | 5.6% (+15.7)#27 | 6.4% (+14.9)#2,247 |
| 28. | 31568 | 20.8% | 5.6% (+15.2)#28 | 6.4% (+14.5)#2,332 |
| 29. | 31630 | 20.4% | 5.6% (+14.8)#29 | 6.4% (+14.0)#2,438 |
| 30. | 30295 | 20.3% | 5.6% (+14.8)#30 | 6.4% (+14.0)#2,445 |
| 31. | 31076 | 20.1% | 5.6% (+14.5)#31 | 6.4% (+13.7)#2,493 |
| 32. | 31771 | 19.9% | 5.6% (+14.3)#32 | 6.4% (+13.5)#2,583 |
| 33. | 31555 | 19.5% | 5.6% (+13.9)#33 | 6.4% (+13.2)#2,659 |
| 34. | 39825 | 19.4% | 5.6% (+13.8)#34 | 6.4% (+13.1)#2,669 |
| 35. | 39827 | 19.0% | 5.6% (+13.4)#35 | 6.4% (+12.6)#2,785 |
| 36. | 30669 | 18.6% | 5.6% (+13.0)#36 | 6.4% (+12.3)#2,887 |
| 37. | 31733 | 18.6% | 5.6% (+13.0)#37 | 6.4% (+12.2)#2,908 |
| 38. | 31019 | 18.3% | 5.6% (+12.7)#38 | 6.4% (+12.0)#2,984 |
| 39. | 30216 | 18.2% | 5.6% (+12.6)#39 | 6.4% (+11.9)#3,009 |
| 40. | 31622 | 17.8% | 5.6% (+12.2)#40 | 6.4% (+11.4)#3,158 |
| 41. | 31201 | 17.6% | 5.6% (+12.0)#41 | 6.4% (+11.3)#3,217 |
| 42. | 39819 | 17.5% | 5.6% (+11.9)#42 | 6.4% (+11.2)#3,246 |
| 43. | 31637 | 17.2% | 5.6% (+11.6)#43 | 6.4% (+10.8)#3,363 |
| 44. | 31647 | 16.8% | 5.6% (+11.2)#44 | 6.4% (+10.5)#3,483 |
| 45. | 31626 | 16.8% | 5.6% (+11.2)#45 | 6.4% (+10.4)#3,498 |
| 46. | 31065 | 16.0% | 5.6% (+10.4)#46 | 6.4% (+9.65)#3,809 |
| 47. | 30543 | 15.8% | 5.6% (+10.3)#47 | 6.4% (+9.50)#3,869 |
| 48. | 30710 | 15.8% | 5.6% (+10.2)#48 | 6.4% (+9.43)#3,898 |
| 49. | 30738 | 15.7% | 5.6% (+10.1)#49 | 6.4% (+9.34)#3,928 |
| 50. | 31006 | 15.6% | 5.6% (+10.0)#50 | 6.4% (+9.28)#3,955 |
| 51. | 30175 | 15.5% | 5.6% (+9.92)#51 | 6.4% (+9.16)#3,996 |
| 52. | 31057 | 15.5% | 5.6% (+9.89)#52 | 6.4% (+9.13)#4,010 |
| 53. | 30731 | 15.0% | 5.6% (+9.38)#53 | 6.4% (+8.62)#4,263 |
| 54. | 31649 | 14.9% | 5.6% (+9.31)#54 | 6.4% (+8.55)#4,300 |
| 55. | 30442 | 14.9% | 5.6% (+9.31)#55 | 6.4% (+8.55)#4,304 |
| 56. | 30641 | 14.9% | 5.6% (+9.27)#56 | 6.4% (+8.51)#4,322 |
| 57. | 30901 | 14.8% | 5.6% (+9.18)#57 | 6.4% (+8.42)#4,370 |
| 58. | 31001 | 14.6% | 5.6% (+8.99)#58 | 6.4% (+8.24)#4,460 |
| 59. | 30619 | 14.4% | 5.6% (+8.85)#59 | 6.4% (+8.09)#4,528 |
| 60. | 30445 | 14.4% | 5.6% (+8.83)#60 | 6.4% (+8.07)#4,544 |
| 61. | 30110 | 14.2% | 5.6% (+8.57)#61 | 6.4% (+7.81)#4,684 |
| 62. | 30606 | 14.0% | 5.6% (+8.42)#62 | 6.4% (+7.66)#4,755 |
| 63. | 31087 | 14.0% | 5.6% (+8.39)#63 | 6.4% (+7.63)#4,780 |
| 64. | 31035 | 14.0% | 5.6% (+8.38)#64 | 6.4% (+7.63)#4,783 |
| 65. | 39867 | 14.0% | 5.6% (+8.36)#65 | 6.4% (+7.60)#4,801 |
| 66. | 30630 | 13.5% | 5.6% (+7.94)#66 | 6.4% (+7.18)#5,056 |
| 67. | 31012 | 13.0% | 5.6% (+7.39)#67 | 6.4% (+6.63)#5,388 |
| 68. | 31070 | 12.9% | 5.6% (+7.31)#68 | 6.4% (+6.55)#5,442 |
| 69. | 30677 | 12.8% | 5.6% (+7.25)#69 | 6.4% (+6.49)#5,492 |
| 70. | 31044 | 12.8% | 5.6% (+7.22)#70 | 6.4% (+6.46)#5,517 |
| 71. | 30711 | 12.8% | 5.6% (+7.19)#71 | 6.4% (+6.43)#5,529 |
| 72. | 31831 | 12.7% | 5.6% (+7.13)#72 | 6.4% (+6.37)#5,578 |
| 73. | 30742 | 12.7% | 5.6% (+7.11)#73 | 6.4% (+6.35)#5,584 |
| 74. | 39897 | 12.6% | 5.6% (+7.04)#74 | 6.4% (+6.28)#5,641 |
| 75. | 31768 | 12.6% | 5.6% (+7.02)#75 | 6.4% (+6.26)#5,658 |
| 76. | 31793 | 12.3% | 5.6% (+6.67)#76 | 6.4% (+5.91)#5,943 |
| 77. | 30821 | 12.1% | 5.6% (+6.55)#77 | 6.4% (+5.80)#6,028 |
| 78. | 39823 | 12.1% | 5.6% (+6.47)#78 | 6.4% (+5.71)#6,098 |
| 79. | 30668 | 12.0% | 5.6% (+6.37)#79 | 6.4% (+5.61)#6,180 |
| 80. | 39886 | 12.0% | 5.6% (+6.36)#80 | 6.4% (+5.60)#6,188 |
| 81. | 30124 | 11.9% | 5.6% (+6.34)#81 | 6.4% (+5.58)#6,211 |
| 82. | 30605 | 11.9% | 5.6% (+6.29)#82 | 6.4% (+5.53)#6,254 |
| 83. | 31007 | 11.8% | 5.6% (+6.17)#83 | 6.4% (+5.41)#6,341 |
| 84. | 31015 | 11.8% | 5.6% (+6.16)#84 | 6.4% (+5.40)#6,367 |
| 85. | 30033 | 11.6% | 5.6% (+6.01)#85 | 6.4% (+5.25)#6,495 |
| 86. | 30828 | 11.5% | 5.6% (+5.88)#86 | 6.4% (+5.12)#6,596 |
| 87. | 31781 | 11.4% | 5.6% (+5.83)#87 | 6.4% (+5.08)#6,639 |
| 88. | 30293 | 11.4% | 5.6% (+5.82)#88 | 6.4% (+5.06)#6,652 |
| 89. | 30909 | 11.4% | 5.6% (+5.78)#89 | 6.4% (+5.02)#6,700 |
| 90. | 30904 | 11.3% | 5.6% (+5.66)#90 | 6.4% (+4.91)#6,804 |
| 91. | 31016 | 11.2% | 5.6% (+5.56)#91 | 6.4% (+4.80)#6,897 |
| 92. | 31308 | 11.1% | 5.6% (+5.52)#92 | 6.4% (+4.76)#6,922 |
| 93. | 30520 | 11.1% | 5.6% (+5.52)#93 | 6.4% (+4.76)#6,923 |
| 94. | 31204 | 11.1% | 5.6% (+5.51)#94 | 6.4% (+4.75)#6,984 |
| 95. | 30055 | 11.1% | 5.6% (+5.47)#95 | 6.4% (+4.72)#7,004 |
| 96. | 30538 | 11.1% | 5.6% (+5.47)#96 | 6.4% (+4.71)#7,016 |
| 97. | 31569 | 11.0% | 5.6% (+5.45)#97 | 6.4% (+4.69)#7,035 |
| 98. | 30607 | 11.0% | 5.6% (+5.40)#98 | 6.4% (+4.64)#7,069 |
| 99. | 31565 | 10.9% | 5.6% (+5.29)#99 | 6.4% (+4.53)#7,159 |
| 100. | 31068 | 10.9% | 5.6% (+5.29)#100 | 6.4% (+4.53)#7,168 |
Common Questions
What are the Top 10 Zip Codes with the Highest Percentage of Population with a Degree in Bio, Nature & Agricultural in Georgia?
Top 10 Zip Codes with the Highest Percentage of Population with a Degree in Bio, Nature & Agricultural in Georgia are:
What zip code has the Highest Percentage of Population with a Degree in Bio, Nature & Agricultural in Georgia?
30665 has the Highest Percentage of Population with a Degree in Bio, Nature & Agricultural in Georgia with 63.6%.
What is the Percentage of Population with a Degree in Bio, Nature & Agricultural in the State of Georgia?
Percentage of Population with a Degree in Bio, Nature & Agricultural in Georgia is 5.6%.
What is the Percentage of Population with a Degree in Bio, Nature & Agricultural in the United States?
Percentage of Population with a Degree in Bio, Nature & Agricultural in the United States is 6.4%.