Zip Codes with the Highest Percentage of Households with Income Above $100,000 in Georgia
RELATED REPORTS & OPTIONS
Household Income | $100k+
Georgia
Compare Zip Codes
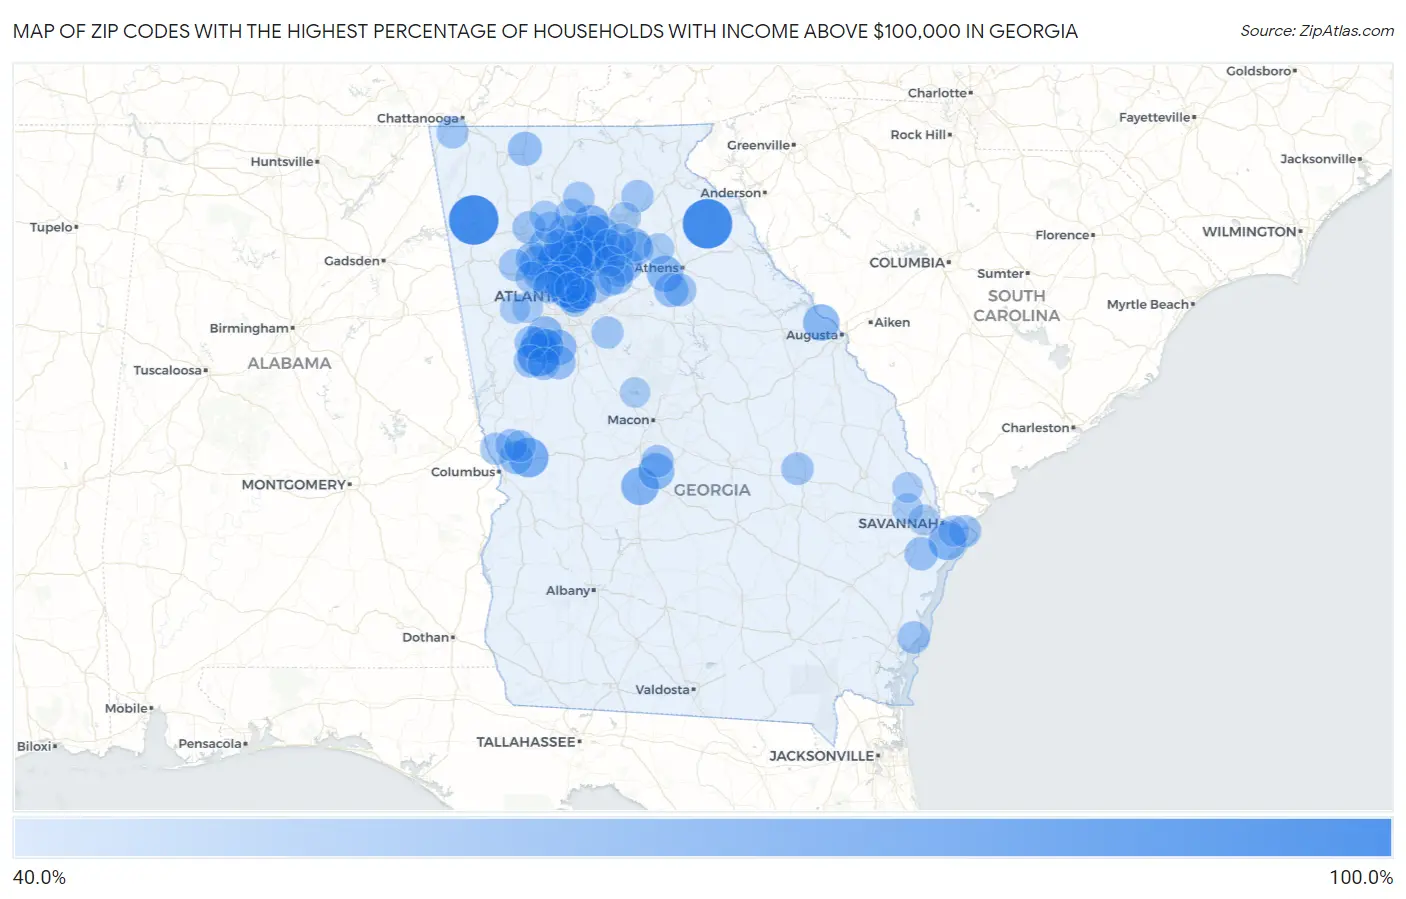
Map of Zip Codes with the Highest Percentage of Households with Income Above $100,000 in Georgia
40.0%
100.0%
Zip Codes with the Highest Percentage of Households with Income Above $100,000 in Georgia
| Zip Code | Households with Income > $100k | vs State | vs National | |
| 1. | 30149 | 100.0% | 34.7%(+65.3)#1 | 37.3%(+62.7)#6 |
| 2. | 30639 | 100.0% | 34.7%(+65.3)#2 | 37.3%(+62.7)#96 |
| 3. | 30289 | 78.3% | 34.7%(+43.6)#3 | 37.3%(+41.0)#410 |
| 4. | 30005 | 75.5% | 34.7%(+40.8)#4 | 37.3%(+38.2)#546 |
| 5. | 31829 | 70.4% | 34.7%(+35.7)#5 | 37.3%(+33.1)#924 |
| 6. | 30075 | 68.6% | 34.7%(+33.9)#6 | 37.3%(+31.3)#1,092 |
| 7. | 30327 | 67.1% | 34.7%(+32.4)#7 | 37.3%(+29.8)#1,250 |
| 8. | 30041 | 65.4% | 34.7%(+30.7)#8 | 37.3%(+28.1)#1,474 |
| 9. | 31411 | 65.4% | 34.7%(+30.7)#9 | 37.3%(+28.1)#1,481 |
| 10. | 31025 | 64.6% | 34.7%(+29.9)#10 | 37.3%(+27.3)#1,604 |
| 11. | 30022 | 64.2% | 34.7%(+29.5)#11 | 37.3%(+26.9)#1,648 |
| 12. | 30004 | 64.1% | 34.7%(+29.4)#12 | 37.3%(+26.8)#1,662 |
| 13. | 30068 | 64.0% | 34.7%(+29.3)#13 | 37.3%(+26.7)#1,676 |
| 14. | 30028 | 63.6% | 34.7%(+28.9)#14 | 37.3%(+26.3)#1,735 |
| 15. | 30024 | 63.2% | 34.7%(+28.5)#15 | 37.3%(+25.9)#1,803 |
| 16. | 30307 | 63.0% | 34.7%(+28.3)#16 | 37.3%(+25.7)#1,843 |
| 17. | 30040 | 62.7% | 34.7%(+28.0)#17 | 37.3%(+25.4)#1,891 |
| 18. | 30809 | 61.2% | 34.7%(+26.5)#18 | 37.3%(+23.9)#2,128 |
| 19. | 30319 | 61.0% | 34.7%(+26.3)#19 | 37.3%(+23.7)#2,173 |
| 20. | 30622 | 60.5% | 34.7%(+25.8)#20 | 37.3%(+23.2)#2,273 |
| 21. | 31047 | 60.4% | 34.7%(+25.7)#21 | 37.3%(+23.1)#2,287 |
| 22. | 30338 | 60.1% | 34.7%(+25.4)#22 | 37.3%(+22.8)#2,337 |
| 23. | 30062 | 59.9% | 34.7%(+25.2)#23 | 37.3%(+22.6)#2,380 |
| 24. | 30277 | 58.7% | 34.7%(+24.0)#24 | 37.3%(+21.4)#2,623 |
| 25. | 30097 | 58.5% | 34.7%(+23.8)#25 | 37.3%(+21.2)#2,653 |
| 26. | 30009 | 58.3% | 34.7%(+23.6)#26 | 37.3%(+21.0)#2,707 |
| 27. | 30215 | 57.8% | 34.7%(+23.1)#27 | 37.3%(+20.5)#2,797 |
| 28. | 30152 | 57.7% | 34.7%(+23.0)#28 | 37.3%(+20.4)#2,822 |
| 29. | 30064 | 57.1% | 34.7%(+22.4)#29 | 37.3%(+19.8)#2,944 |
| 30. | 30306 | 57.1% | 34.7%(+22.4)#30 | 37.3%(+19.8)#2,952 |
| 31. | 30290 | 56.8% | 34.7%(+22.1)#31 | 37.3%(+19.5)#3,028 |
| 32. | 30030 | 56.7% | 34.7%(+22.0)#32 | 37.3%(+19.4)#3,045 |
| 33. | 30269 | 56.6% | 34.7%(+21.9)#33 | 37.3%(+19.3)#3,071 |
| 34. | 30326 | 56.6% | 34.7%(+21.9)#34 | 37.3%(+19.3)#3,080 |
| 35. | 30342 | 55.8% | 34.7%(+21.1)#35 | 37.3%(+18.5)#3,236 |
| 36. | 30115 | 55.4% | 34.7%(+20.7)#36 | 37.3%(+18.1)#3,344 |
| 37. | 30309 | 55.1% | 34.7%(+20.4)#37 | 37.3%(+17.8)#3,423 |
| 38. | 30019 | 54.9% | 34.7%(+20.2)#38 | 37.3%(+17.6)#3,471 |
| 39. | 30621 | 54.9% | 34.7%(+20.2)#39 | 37.3%(+17.6)#3,485 |
| 40. | 30066 | 54.8% | 34.7%(+20.1)#40 | 37.3%(+17.5)#3,493 |
| 41. | 30724 | 54.5% | 34.7%(+19.8)#41 | 37.3%(+17.2)#3,605 |
| 42. | 30017 | 54.0% | 34.7%(+19.3)#42 | 37.3%(+16.7)#3,714 |
| 43. | 30548 | 53.9% | 34.7%(+19.2)#43 | 37.3%(+16.6)#3,743 |
| 44. | 30205 | 53.7% | 34.7%(+19.0)#44 | 37.3%(+16.4)#3,793 |
| 45. | 30189 | 53.3% | 34.7%(+18.6)#45 | 37.3%(+16.0)#3,883 |
| 46. | 31324 | 52.9% | 34.7%(+18.2)#46 | 37.3%(+15.6)#3,981 |
| 47. | 31820 | 52.9% | 34.7%(+18.2)#47 | 37.3%(+15.6)#3,994 |
| 48. | 30101 | 52.8% | 34.7%(+18.1)#48 | 37.3%(+15.5)#4,014 |
| 49. | 30033 | 52.7% | 34.7%(+18.0)#49 | 37.3%(+15.4)#4,054 |
| 50. | 30317 | 52.7% | 34.7%(+18.0)#50 | 37.3%(+15.4)#4,063 |
| 51. | 30517 | 52.5% | 34.7%(+17.8)#51 | 37.3%(+15.2)#4,113 |
| 52. | 30363 | 52.5% | 34.7%(+17.8)#52 | 37.3%(+15.2)#4,122 |
| 53. | 30076 | 52.0% | 34.7%(+17.3)#53 | 37.3%(+14.7)#4,234 |
| 54. | 30265 | 51.8% | 34.7%(+17.1)#54 | 37.3%(+14.5)#4,289 |
| 55. | 30305 | 51.2% | 34.7%(+16.5)#55 | 37.3%(+13.9)#4,479 |
| 56. | 30328 | 51.0% | 34.7%(+16.3)#56 | 37.3%(+13.7)#4,531 |
| 57. | 30677 | 50.7% | 34.7%(+16.0)#57 | 37.3%(+13.4)#4,628 |
| 58. | 30345 | 50.6% | 34.7%(+15.9)#58 | 37.3%(+13.3)#4,658 |
| 59. | 30082 | 50.5% | 34.7%(+15.8)#59 | 37.3%(+13.2)#4,683 |
| 60. | 30184 | 50.4% | 34.7%(+15.7)#60 | 37.3%(+13.1)#4,719 |
| 61. | 30188 | 50.3% | 34.7%(+15.6)#61 | 37.3%(+13.0)#4,732 |
| 62. | 30259 | 50.3% | 34.7%(+15.6)#62 | 37.3%(+13.0)#4,755 |
| 63. | 30448 | 50.0% | 34.7%(+15.3)#63 | 37.3%(+12.7)#4,876 |
| 64. | 30107 | 49.9% | 34.7%(+15.2)#64 | 37.3%(+12.6)#4,891 |
| 65. | 30276 | 49.8% | 34.7%(+15.1)#65 | 37.3%(+12.5)#4,920 |
| 66. | 31522 | 49.8% | 34.7%(+15.1)#66 | 37.3%(+12.5)#4,923 |
| 67. | 31005 | 49.7% | 34.7%(+15.0)#67 | 37.3%(+12.4)#4,954 |
| 68. | 31328 | 49.6% | 34.7%(+14.9)#68 | 37.3%(+12.3)#4,995 |
| 69. | 30519 | 49.5% | 34.7%(+14.8)#69 | 37.3%(+12.2)#5,006 |
| 70. | 30527 | 49.5% | 34.7%(+14.8)#70 | 37.3%(+12.2)#5,027 |
| 71. | 31808 | 48.9% | 34.7%(+14.2)#71 | 37.3%(+11.6)#5,204 |
| 72. | 30132 | 48.8% | 34.7%(+14.1)#72 | 37.3%(+11.5)#5,227 |
| 73. | 30252 | 48.8% | 34.7%(+14.1)#73 | 37.3%(+11.5)#5,228 |
| 74. | 30750 | 48.7% | 34.7%(+14.0)#74 | 37.3%(+11.4)#5,271 |
| 75. | 30339 | 48.5% | 34.7%(+13.8)#75 | 37.3%(+11.2)#5,316 |
| 76. | 31804 | 48.5% | 34.7%(+13.8)#76 | 37.3%(+11.2)#5,326 |
| 77. | 30127 | 48.2% | 34.7%(+13.5)#77 | 37.3%(+10.9)#5,412 |
| 78. | 30518 | 47.9% | 34.7%(+13.2)#78 | 37.3%(+10.6)#5,525 |
| 79. | 30045 | 47.8% | 34.7%(+13.1)#79 | 37.3%(+10.5)#5,557 |
| 80. | 30126 | 47.8% | 34.7%(+13.1)#80 | 37.3%(+10.5)#5,558 |
| 81. | 31807 | 47.4% | 34.7%(+12.7)#81 | 37.3%(+10.1)#5,711 |
| 82. | 30114 | 46.8% | 34.7%(+12.1)#82 | 37.3%(+9.50)#5,899 |
| 83. | 30148 | 46.8% | 34.7%(+12.1)#83 | 37.3%(+9.50)#5,923 |
| 84. | 30316 | 46.1% | 34.7%(+11.4)#84 | 37.3%(+8.80)#6,159 |
| 85. | 31410 | 46.1% | 34.7%(+11.4)#85 | 37.3%(+8.80)#6,162 |
| 86. | 30087 | 46.0% | 34.7%(+11.3)#86 | 37.3%(+8.70)#6,199 |
| 87. | 30549 | 45.9% | 34.7%(+11.2)#87 | 37.3%(+8.60)#6,247 |
| 88. | 30183 | 45.7% | 34.7%(+11.0)#88 | 37.3%(+8.40)#6,339 |
| 89. | 30506 | 45.3% | 34.7%(+10.6)#89 | 37.3%(+8.00)#6,491 |
| 90. | 30542 | 45.2% | 34.7%(+10.5)#90 | 37.3%(+7.90)#6,535 |
| 91. | 30002 | 45.2% | 34.7%(+10.5)#91 | 37.3%(+7.90)#6,553 |
| 92. | 31307 | 45.1% | 34.7%(+10.4)#92 | 37.3%(+7.80)#6,593 |
| 93. | 30135 | 45.0% | 34.7%(+10.3)#93 | 37.3%(+7.70)#6,609 |
| 94. | 31322 | 45.0% | 34.7%(+10.3)#94 | 37.3%(+7.70)#6,620 |
| 95. | 30043 | 44.8% | 34.7%(+10.1)#95 | 37.3%(+7.50)#6,688 |
| 96. | 31312 | 44.4% | 34.7%(+9.70)#96 | 37.3%(+7.10)#6,851 |
| 97. | 30324 | 44.3% | 34.7%(+9.60)#97 | 37.3%(+7.00)#6,887 |
| 98. | 31046 | 43.7% | 34.7%(+9.00)#98 | 37.3%(+6.40)#7,136 |
| 99. | 30187 | 43.5% | 34.7%(+8.80)#99 | 37.3%(+6.20)#7,214 |
| 100. | 30078 | 43.4% | 34.7%(+8.70)#100 | 37.3%(+6.10)#7,239 |
Common Questions
What are the Top 10 Zip Codes with the Highest Percentage of Households with Income Above $100,000 in Georgia?
Top 10 Zip Codes with the Highest Percentage of Households with Income Above $100,000 in Georgia are:
What zip code has the Highest Percentage of Households with Income Above $100,000 in Georgia?
30149 has the Highest Percentage of Households with Income Above $100,000 in Georgia with 100.0%.
What is the Percentage of Households with Income Above $100,000 in the State of Georgia?
Percentage of Households with Income Above $100,000 in Georgia is 34.7%.
What is the Percentage of Households with Income Above $100,000 in the United States?
Percentage of Households with Income Above $100,000 in the United States is 37.3%.