Zip Codes with the Highest Percentage of Population Employed in Food Preparation & Serving in Athens, GA
RELATED REPORTS & OPTIONS
Food Preparation & Serving
Athens
Compare Zip Codes
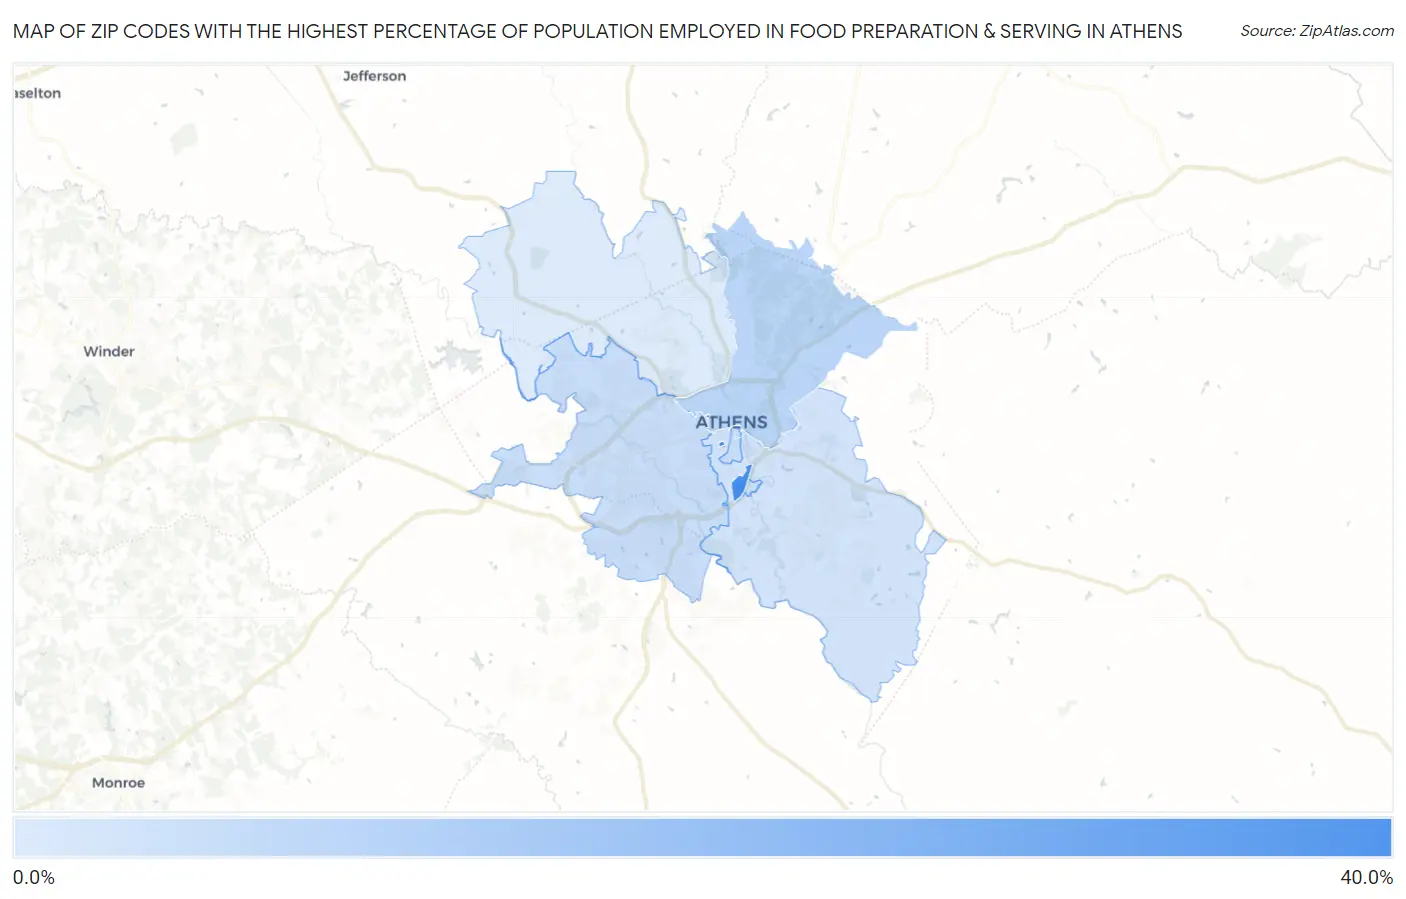
Map of Zip Codes with the Highest Percentage of Population Employed in Food Preparation & Serving in Athens
5.5%
33.8%
Zip Codes with the Highest Percentage of Population Employed in Food Preparation & Serving in Athens, GA
| Zip Code | % Employed | vs State | vs National | |
| 1. | 30609 | 33.8% | 5.1%(+28.6)#4 | 5.3%(+28.5)#163 |
| 2. | 30601 | 11.2% | 5.1%(+6.10)#35 | 5.3%(+5.96)#1,939 |
| 3. | 30602 | 9.2% | 5.1%(+4.08)#60 | 5.3%(+3.94)#3,299 |
| 4. | 30606 | 8.8% | 5.1%(+3.67)#70 | 5.3%(+3.53)#3,718 |
| 5. | 30605 | 7.3% | 5.1%(+2.16)#117 | 5.3%(+2.02)#5,918 |
| 6. | 30607 | 5.5% | 5.1%(+0.325)#254 | 5.3%(+0.183)#11,154 |
1
Common Questions
What are the Top 5 Zip Codes with the Highest Percentage of Population Employed in Food Preparation & Serving in Athens, GA?
Top 5 Zip Codes with the Highest Percentage of Population Employed in Food Preparation & Serving in Athens, GA are:
What zip code has the Highest Percentage of Population Employed in Food Preparation & Serving in Athens, GA?
30609 has the Highest Percentage of Population Employed in Food Preparation & Serving in Athens, GA with 33.8%.
What is the Percentage of Population Employed in Food Preparation & Serving in Georgia?
Percentage of Population Employed in Food Preparation & Serving in Georgia is 5.1%.
What is the Percentage of Population Employed in Food Preparation & Serving in the United States?
Percentage of Population Employed in Food Preparation & Serving in the United States is 5.3%.