Zip Codes with the Highest Percentage of Population Employed in Sales & Related in Georgia
RELATED REPORTS & OPTIONS
Sales & Related
Georgia
Compare Zip Codes
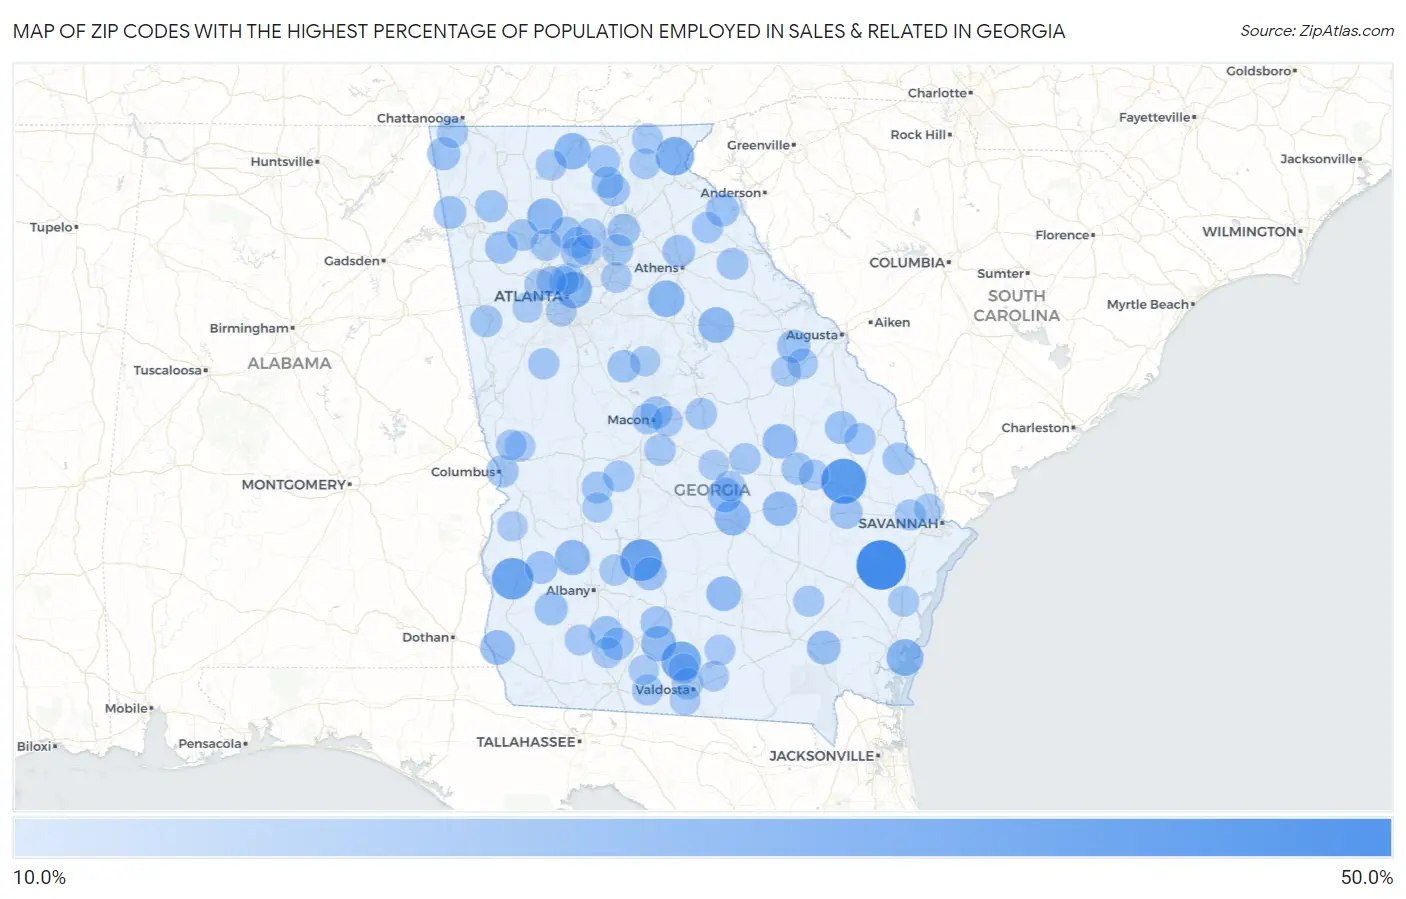
Map of Zip Codes with the Highest Percentage of Population Employed in Sales & Related in Georgia
10.0%
50.0%
Zip Codes with the Highest Percentage of Population Employed in Sales & Related in Georgia
| Zip Code | % Employed | vs State | vs National | |
| 1. | 31333 | 48.8% | 10.2%(+38.6)#1 | 9.6%(+39.2)#129 |
| 2. | 30451 | 40.0% | 10.2%(+29.8)#2 | 9.6%(+30.4)#206 |
| 3. | 39836 | 33.6% | 10.2%(+23.5)#3 | 9.6%(+24.1)#298 |
| 4. | 31712 | 33.6% | 10.2%(+23.5)#4 | 9.6%(+24.0)#299 |
| 5. | 31627 | 30.1% | 10.2%(+20.0)#5 | 9.6%(+20.5)#396 |
| 6. | 30552 | 27.9% | 10.2%(+17.8)#6 | 9.6%(+18.3)#479 |
| 7. | 31527 | 24.7% | 10.2%(+14.5)#7 | 9.6%(+15.1)#669 |
| 8. | 30623 | 24.5% | 10.2%(+14.3)#8 | 9.6%(+14.9)#685 |
| 9. | 30322 | 24.3% | 10.2%(+14.1)#9 | 9.6%(+14.7)#698 |
| 10. | 30522 | 24.1% | 10.2%(+13.9)#10 | 9.6%(+14.5)#708 |
| 11. | 31037 | 23.2% | 10.2%(+13.1)#11 | 9.6%(+13.6)#773 |
| 12. | 30183 | 23.1% | 10.2%(+12.9)#12 | 9.6%(+13.5)#784 |
| 13. | 30665 | 23.0% | 10.2%(+12.8)#13 | 9.6%(+13.4)#801 |
| 14. | 39826 | 22.0% | 10.2%(+11.9)#14 | 9.6%(+12.4)#893 |
| 15. | 31747 | 21.7% | 10.2%(+11.6)#15 | 9.6%(+12.1)#930 |
| 16. | 31009 | 21.2% | 10.2%(+11.0)#16 | 9.6%(+11.6)#1,002 |
| 17. | 31512 | 21.1% | 10.2%(+10.9)#17 | 9.6%(+11.5)#1,007 |
| 18. | 39861 | 21.0% | 10.2%(+10.9)#18 | 9.6%(+11.4)#1,010 |
| 19. | 31049 | 21.0% | 10.2%(+10.9)#19 | 9.6%(+11.4)#1,012 |
| 20. | 30410 | 20.7% | 10.2%(+10.5)#20 | 9.6%(+11.1)#1,064 |
| 21. | 31542 | 19.3% | 10.2%(+9.14)#21 | 9.6%(+9.70)#1,280 |
| 22. | 30738 | 18.2% | 10.2%(+8.06)#22 | 9.6%(+8.62)#1,511 |
| 23. | 30516 | 18.2% | 10.2%(+8.03)#23 | 9.6%(+8.60)#1,519 |
| 24. | 31714 | 18.1% | 10.2%(+7.94)#24 | 9.6%(+8.51)#1,550 |
| 25. | 39862 | 18.0% | 10.2%(+7.88)#25 | 9.6%(+8.44)#1,560 |
| 26. | 30808 | 18.0% | 10.2%(+7.79)#26 | 9.6%(+8.36)#1,579 |
| 27. | 31784 | 17.9% | 10.2%(+7.78)#27 | 9.6%(+8.35)#1,585 |
| 28. | 30442 | 17.7% | 10.2%(+7.58)#28 | 9.6%(+8.15)#1,630 |
| 29. | 30429 | 17.3% | 10.2%(+7.15)#29 | 9.6%(+7.71)#1,742 |
| 30. | 39886 | 17.3% | 10.2%(+7.15)#30 | 9.6%(+7.71)#1,743 |
| 31. | 30565 | 17.3% | 10.2%(+7.11)#31 | 9.6%(+7.67)#1,753 |
| 32. | 30730 | 17.2% | 10.2%(+7.05)#32 | 9.6%(+7.61)#1,771 |
| 33. | 30178 | 17.1% | 10.2%(+6.96)#33 | 9.6%(+7.53)#1,801 |
| 34. | 30216 | 17.0% | 10.2%(+6.85)#34 | 9.6%(+7.41)#1,832 |
| 35. | 31756 | 16.9% | 10.2%(+6.75)#35 | 9.6%(+7.31)#1,867 |
| 36. | 30446 | 16.8% | 10.2%(+6.67)#36 | 9.6%(+7.24)#1,885 |
| 37. | 30597 | 16.8% | 10.2%(+6.65)#37 | 9.6%(+7.21)#1,895 |
| 38. | 31775 | 16.7% | 10.2%(+6.55)#38 | 9.6%(+7.11)#1,921 |
| 39. | 30448 | 16.7% | 10.2%(+6.51)#39 | 9.6%(+7.07)#1,960 |
| 40. | 30572 | 16.6% | 10.2%(+6.45)#40 | 9.6%(+7.01)#1,978 |
| 41. | 30566 | 16.6% | 10.2%(+6.45)#41 | 9.6%(+7.01)#1,979 |
| 42. | 31906 | 16.5% | 10.2%(+6.39)#42 | 9.6%(+6.95)#2,004 |
| 43. | 31211 | 16.5% | 10.2%(+6.37)#43 | 9.6%(+6.93)#2,012 |
| 44. | 30733 | 16.2% | 10.2%(+6.07)#44 | 9.6%(+6.63)#2,131 |
| 45. | 30118 | 16.1% | 10.2%(+5.98)#45 | 9.6%(+6.54)#2,169 |
| 46. | 30533 | 16.1% | 10.2%(+5.97)#46 | 9.6%(+6.53)#2,177 |
| 47. | 31068 | 15.8% | 10.2%(+5.63)#47 | 9.6%(+6.19)#2,341 |
| 48. | 30121 | 15.7% | 10.2%(+5.52)#48 | 9.6%(+6.08)#2,395 |
| 49. | 30115 | 15.6% | 10.2%(+5.46)#49 | 9.6%(+6.03)#2,415 |
| 50. | 30627 | 15.6% | 10.2%(+5.43)#50 | 9.6%(+5.99)#2,426 |
| 51. | 30519 | 15.5% | 10.2%(+5.39)#51 | 9.6%(+5.95)#2,450 |
| 52. | 31054 | 15.5% | 10.2%(+5.35)#52 | 9.6%(+5.92)#2,468 |
| 53. | 31098 | 15.4% | 10.2%(+5.22)#53 | 9.6%(+5.78)#2,543 |
| 54. | 30455 | 15.2% | 10.2%(+5.06)#54 | 9.6%(+5.62)#2,615 |
| 55. | 30189 | 15.2% | 10.2%(+5.04)#55 | 9.6%(+5.60)#2,627 |
| 56. | 31027 | 15.2% | 10.2%(+5.03)#56 | 9.6%(+5.59)#2,632 |
| 57. | 30276 | 15.0% | 10.2%(+4.87)#57 | 9.6%(+5.43)#2,716 |
| 58. | 30662 | 15.0% | 10.2%(+4.84)#58 | 9.6%(+5.40)#2,733 |
| 59. | 31057 | 15.0% | 10.2%(+4.80)#59 | 9.6%(+5.36)#2,764 |
| 60. | 30004 | 14.8% | 10.2%(+4.64)#60 | 9.6%(+5.20)#2,873 |
| 61. | 31602 | 14.7% | 10.2%(+4.57)#61 | 9.6%(+5.13)#2,918 |
| 62. | 31772 | 14.7% | 10.2%(+4.56)#62 | 9.6%(+5.12)#2,919 |
| 63. | 31318 | 14.7% | 10.2%(+4.50)#63 | 9.6%(+5.06)#2,974 |
| 64. | 30750 | 14.6% | 10.2%(+4.44)#64 | 9.6%(+5.00)#3,023 |
| 65. | 30106 | 14.6% | 10.2%(+4.43)#65 | 9.6%(+4.99)#3,026 |
| 66. | 31629 | 14.5% | 10.2%(+4.31)#66 | 9.6%(+4.87)#3,104 |
| 67. | 31765 | 14.4% | 10.2%(+4.29)#67 | 9.6%(+4.85)#3,118 |
| 68. | 30540 | 14.3% | 10.2%(+4.19)#68 | 9.6%(+4.75)#3,205 |
| 69. | 31551 | 14.3% | 10.2%(+4.17)#69 | 9.6%(+4.73)#3,215 |
| 70. | 31204 | 14.3% | 10.2%(+4.13)#70 | 9.6%(+4.69)#3,243 |
| 71. | 30546 | 14.2% | 10.2%(+4.09)#71 | 9.6%(+4.65)#3,298 |
| 72. | 30571 | 14.2% | 10.2%(+4.09)#72 | 9.6%(+4.65)#3,300 |
| 73. | 30818 | 14.2% | 10.2%(+4.01)#73 | 9.6%(+4.57)#3,347 |
| 74. | 31331 | 14.1% | 10.2%(+3.97)#74 | 9.6%(+4.53)#3,376 |
| 75. | 30017 | 14.0% | 10.2%(+3.83)#75 | 9.6%(+4.40)#3,487 |
| 76. | 31075 | 14.0% | 10.2%(+3.82)#76 | 9.6%(+4.38)#3,499 |
| 77. | 31730 | 13.9% | 10.2%(+3.79)#77 | 9.6%(+4.35)#3,523 |
| 78. | 31601 | 13.9% | 10.2%(+3.79)#78 | 9.6%(+4.35)#3,525 |
| 79. | 30342 | 13.9% | 10.2%(+3.77)#79 | 9.6%(+4.33)#3,543 |
| 80. | 31807 | 13.9% | 10.2%(+3.74)#80 | 9.6%(+4.31)#3,562 |
| 81. | 30009 | 13.9% | 10.2%(+3.72)#81 | 9.6%(+4.28)#3,579 |
| 82. | 31804 | 13.8% | 10.2%(+3.60)#82 | 9.6%(+4.16)#3,697 |
| 83. | 30464 | 13.8% | 10.2%(+3.59)#83 | 9.6%(+4.15)#3,700 |
| 84. | 30327 | 13.7% | 10.2%(+3.55)#84 | 9.6%(+4.12)#3,738 |
| 85. | 31632 | 13.7% | 10.2%(+3.55)#85 | 9.6%(+4.11)#3,742 |
| 86. | 31217 | 13.7% | 10.2%(+3.53)#86 | 9.6%(+4.09)#3,764 |
| 87. | 31641 | 13.6% | 10.2%(+3.48)#87 | 9.6%(+4.04)#3,800 |
| 88. | 30337 | 13.6% | 10.2%(+3.44)#88 | 9.6%(+4.01)#3,837 |
| 89. | 31635 | 13.6% | 10.2%(+3.44)#89 | 9.6%(+4.00)#3,845 |
| 90. | 30040 | 13.6% | 10.2%(+3.43)#90 | 9.6%(+4.00)#3,849 |
| 91. | 30823 | 13.5% | 10.2%(+3.32)#91 | 9.6%(+3.89)#3,960 |
| 92. | 31064 | 13.4% | 10.2%(+3.20)#92 | 9.6%(+3.76)#4,093 |
| 93. | 30005 | 13.3% | 10.2%(+3.14)#93 | 9.6%(+3.71)#4,164 |
| 94. | 31407 | 13.2% | 10.2%(+3.06)#94 | 9.6%(+3.63)#4,253 |
| 95. | 31022 | 13.2% | 10.2%(+3.06)#95 | 9.6%(+3.62)#4,259 |
| 96. | 30135 | 13.2% | 10.2%(+3.03)#96 | 9.6%(+3.60)#4,281 |
| 97. | 31815 | 13.2% | 10.2%(+3.00)#97 | 9.6%(+3.56)#4,325 |
| 98. | 31711 | 13.0% | 10.2%(+2.89)#98 | 9.6%(+3.45)#4,434 |
| 99. | 30082 | 13.0% | 10.2%(+2.87)#99 | 9.6%(+3.44)#4,449 |
| 100. | 31778 | 13.0% | 10.2%(+2.86)#100 | 9.6%(+3.43)#4,456 |
Common Questions
What are the Top 10 Zip Codes with the Highest Percentage of Population Employed in Sales & Related in Georgia?
Top 10 Zip Codes with the Highest Percentage of Population Employed in Sales & Related in Georgia are:
What zip code has the Highest Percentage of Population Employed in Sales & Related in Georgia?
31333 has the Highest Percentage of Population Employed in Sales & Related in Georgia with 48.8%.
What is the Percentage of Population Employed in Sales & Related in the State of Georgia?
Percentage of Population Employed in Sales & Related in Georgia is 10.2%.
What is the Percentage of Population Employed in Sales & Related in the United States?
Percentage of Population Employed in Sales & Related in the United States is 9.6%.