Zip Codes with the Highest Percentage of Population Employed in Food Preparation & Serving in Brunswick, GA
RELATED REPORTS & OPTIONS
Food Preparation & Serving
Brunswick
Compare Zip Codes
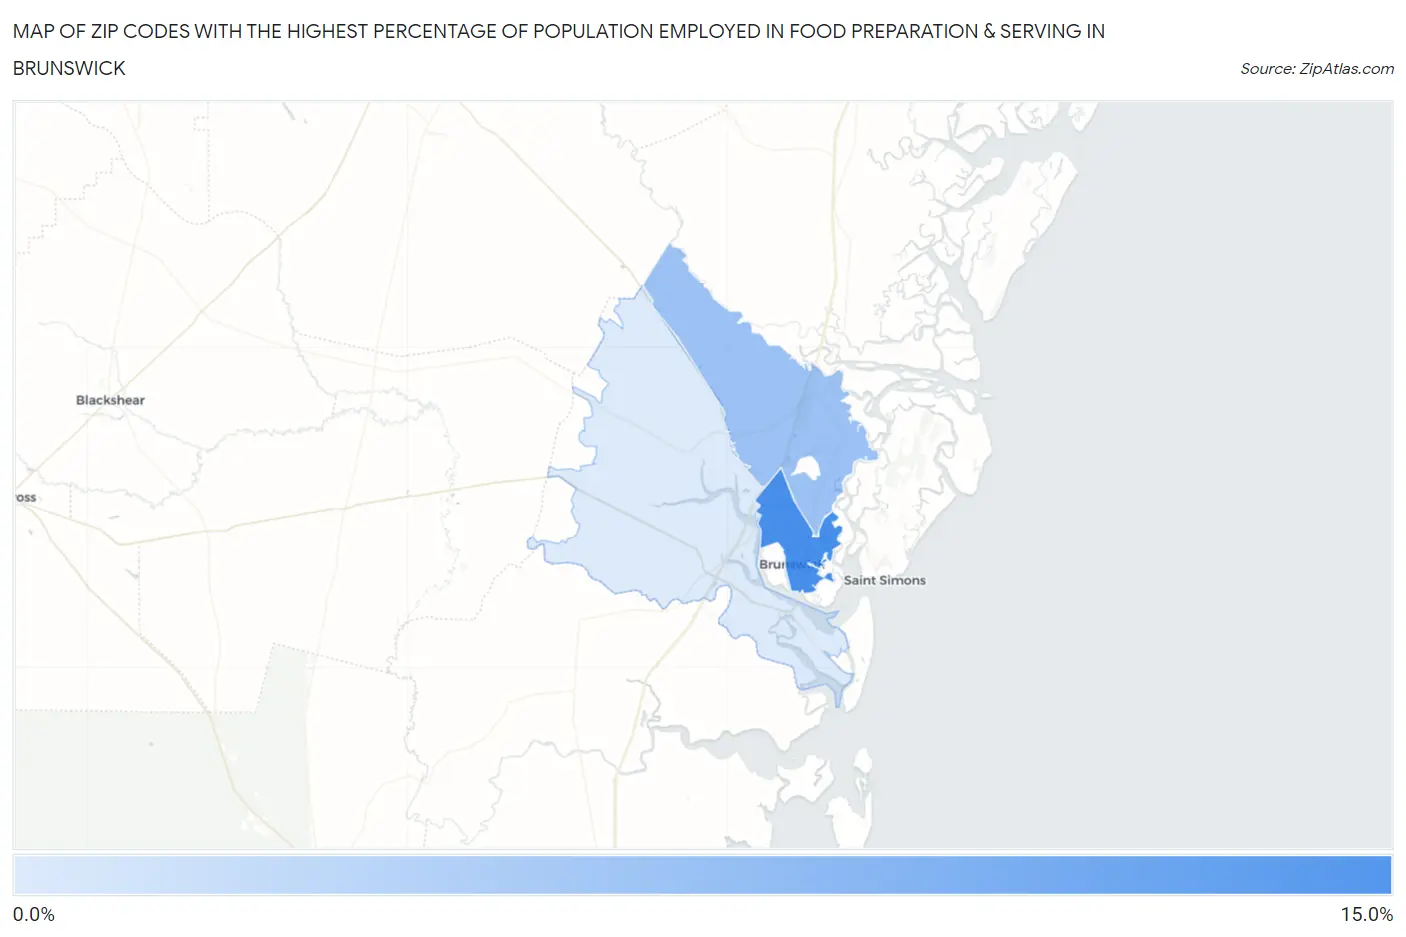
Map of Zip Codes with the Highest Percentage of Population Employed in Food Preparation & Serving in Brunswick
2.0%
13.1%
Zip Codes with the Highest Percentage of Population Employed in Food Preparation & Serving in Brunswick, GA
| Zip Code | % Employed | vs State | vs National | |
| 1. | 31520 | 13.1% | 5.1%(+7.92)#24 | 5.3%(+7.78)#1,378 |
| 2. | 31525 | 6.6% | 5.1%(+1.44)#152 | 5.3%(+1.30)#7,651 |
| 3. | 31523 | 2.0% | 5.1%(-3.16)#573 | 5.3%(-3.30)#24,753 |
1
Common Questions
What are the Top Zip Codes with the Highest Percentage of Population Employed in Food Preparation & Serving in Brunswick, GA?
Top Zip Codes with the Highest Percentage of Population Employed in Food Preparation & Serving in Brunswick, GA are:
What zip code has the Highest Percentage of Population Employed in Food Preparation & Serving in Brunswick, GA?
31520 has the Highest Percentage of Population Employed in Food Preparation & Serving in Brunswick, GA with 13.1%.
What is the Percentage of Population Employed in Food Preparation & Serving in Brunswick, GA?
Percentage of Population Employed in Food Preparation & Serving in Brunswick is 10.2%.
What is the Percentage of Population Employed in Food Preparation & Serving in Georgia?
Percentage of Population Employed in Food Preparation & Serving in Georgia is 5.1%.
What is the Percentage of Population Employed in Food Preparation & Serving in the United States?
Percentage of Population Employed in Food Preparation & Serving in the United States is 5.3%.