Zip Codes with the Highest Percentage of Population Employed in Food Preparation & Serving in Lithonia, GA
RELATED REPORTS & OPTIONS
Food Preparation & Serving
Lithonia
Compare Zip Codes
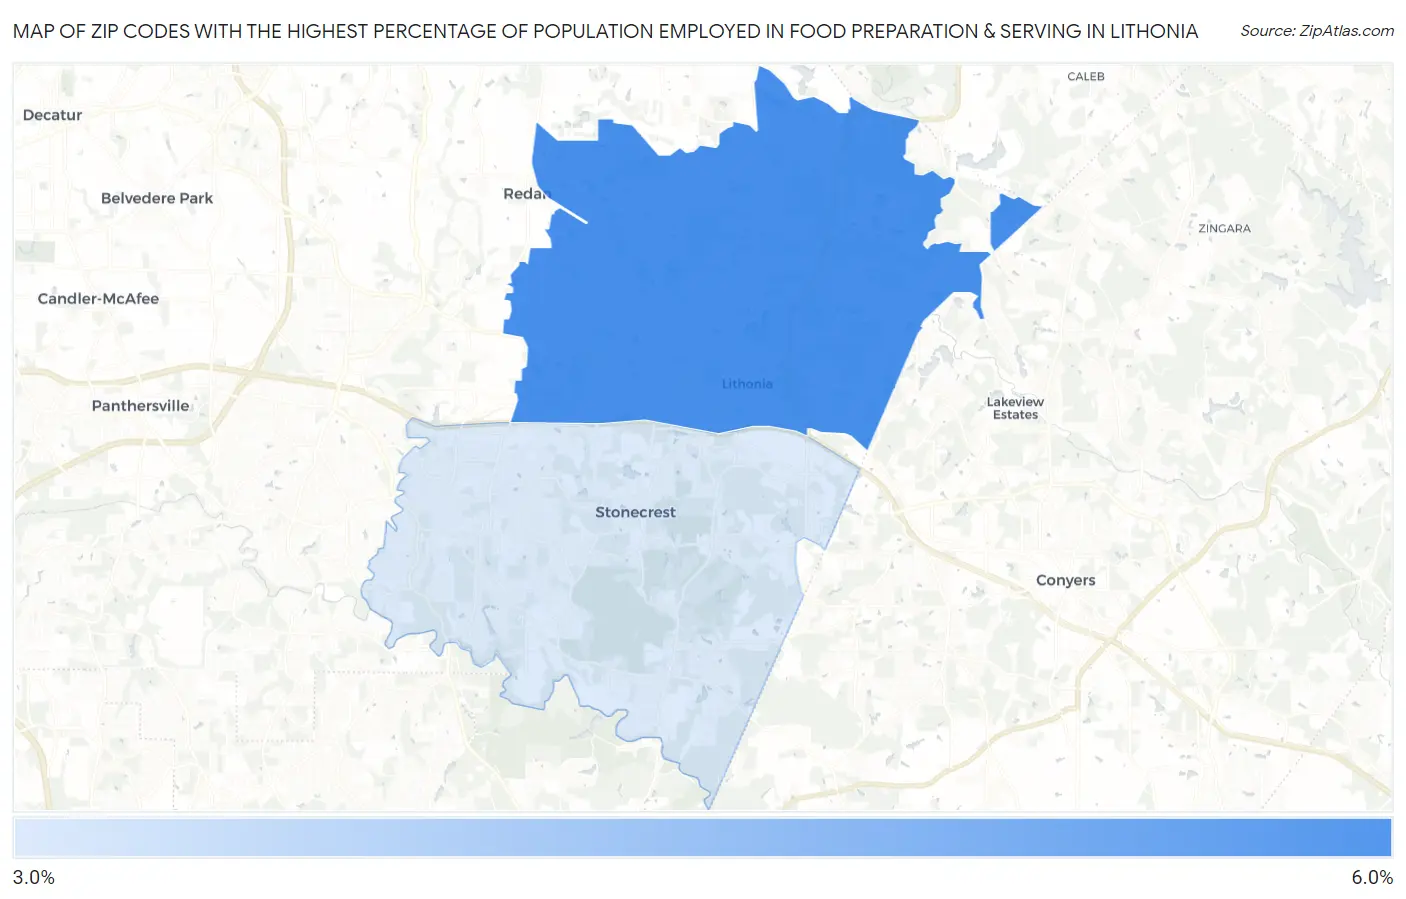
Map of Zip Codes with the Highest Percentage of Population Employed in Food Preparation & Serving in Lithonia
3.0%
5.9%
Zip Codes with the Highest Percentage of Population Employed in Food Preparation & Serving in Lithonia, GA
| Zip Code | % Employed | vs State | vs National | |
| 1. | 30058 | 5.9% | 5.1%(+0.760)#211 | 5.3%(+0.619)#9,662 |
| 2. | 30038 | 3.0% | 5.1%(-2.12)#501 | 5.3%(-2.26)#21,157 |
1
Common Questions
What are the Top Zip Codes with the Highest Percentage of Population Employed in Food Preparation & Serving in Lithonia, GA?
Top Zip Codes with the Highest Percentage of Population Employed in Food Preparation & Serving in Lithonia, GA are:
What zip code has the Highest Percentage of Population Employed in Food Preparation & Serving in Lithonia, GA?
30058 has the Highest Percentage of Population Employed in Food Preparation & Serving in Lithonia, GA with 5.9%.
What is the Percentage of Population Employed in Food Preparation & Serving in Lithonia, GA?
Percentage of Population Employed in Food Preparation & Serving in Lithonia is 6.7%.
What is the Percentage of Population Employed in Food Preparation & Serving in Georgia?
Percentage of Population Employed in Food Preparation & Serving in Georgia is 5.1%.
What is the Percentage of Population Employed in Food Preparation & Serving in the United States?
Percentage of Population Employed in Food Preparation & Serving in the United States is 5.3%.