Zip Codes with the Highest Percentage of Population Employed in Food Preparation & Serving in Alpharetta, GA
RELATED REPORTS & OPTIONS
Food Preparation & Serving
Alpharetta
Compare Zip Codes
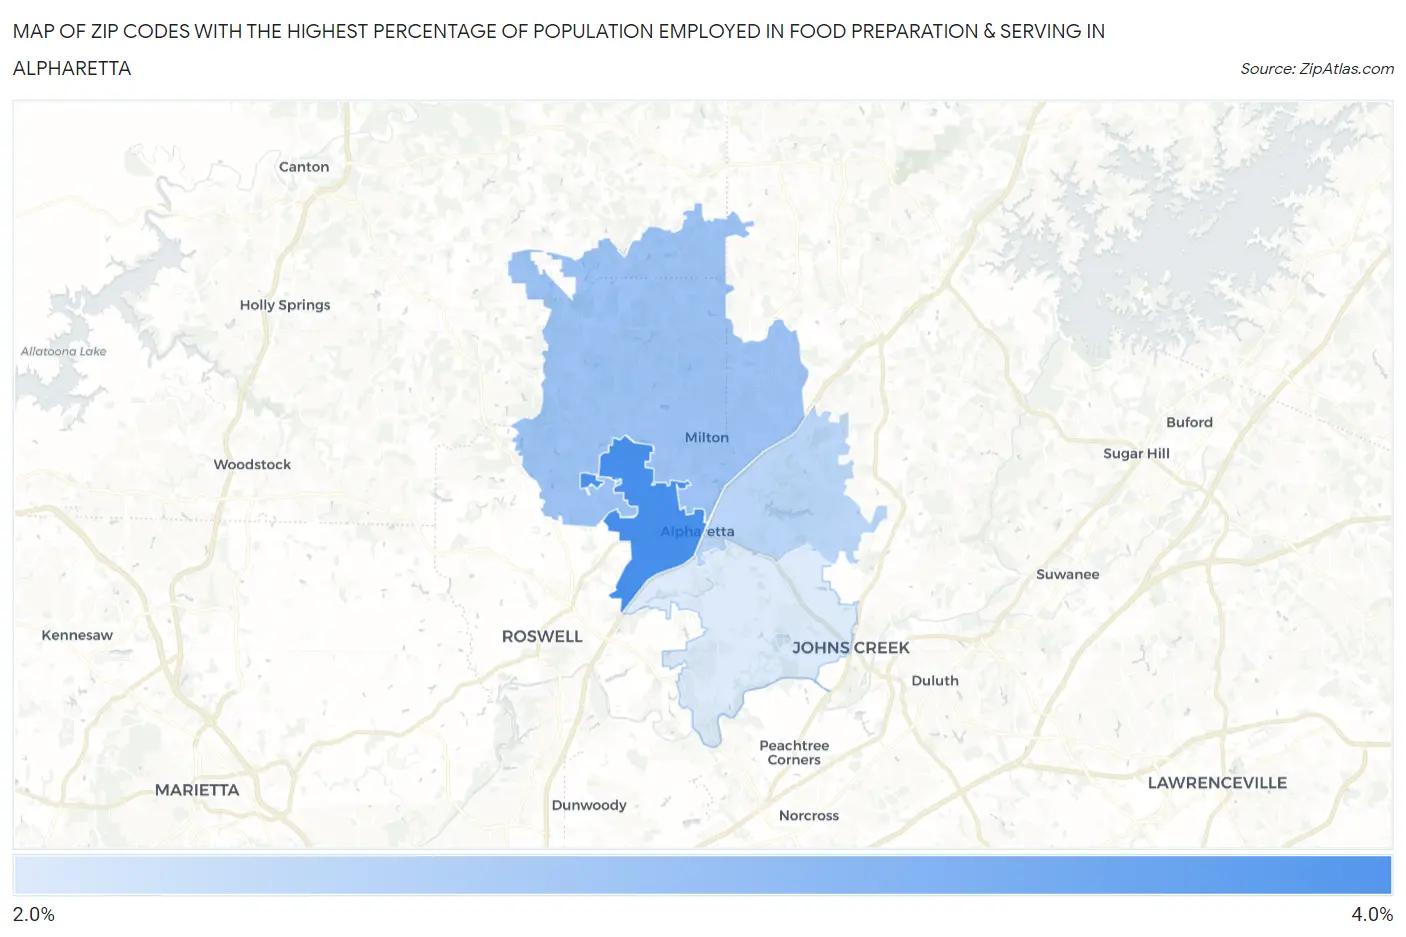
Map of Zip Codes with the Highest Percentage of Population Employed in Food Preparation & Serving in Alpharetta
2.9%
3.8%
Zip Codes with the Highest Percentage of Population Employed in Food Preparation & Serving in Alpharetta, GA
| Zip Code | % Employed | vs State | vs National | |
| 1. | 30009 | 3.8% | 5.1%(-1.34)#421 | 5.3%(-1.48)#17,923 |
| 2. | 30004 | 3.3% | 5.1%(-1.82)#477 | 5.3%(-1.96)#19,953 |
| 3. | 30005 | 3.1% | 5.1%(-2.01)#495 | 5.3%(-2.15)#20,745 |
| 4. | 30022 | 2.9% | 5.1%(-2.21)#509 | 5.3%(-2.35)#21,515 |
1
Common Questions
What are the Top 3 Zip Codes with the Highest Percentage of Population Employed in Food Preparation & Serving in Alpharetta, GA?
Top 3 Zip Codes with the Highest Percentage of Population Employed in Food Preparation & Serving in Alpharetta, GA are:
What zip code has the Highest Percentage of Population Employed in Food Preparation & Serving in Alpharetta, GA?
30009 has the Highest Percentage of Population Employed in Food Preparation & Serving in Alpharetta, GA with 3.8%.
What is the Percentage of Population Employed in Food Preparation & Serving in Alpharetta, GA?
Percentage of Population Employed in Food Preparation & Serving in Alpharetta is 3.1%.
What is the Percentage of Population Employed in Food Preparation & Serving in Georgia?
Percentage of Population Employed in Food Preparation & Serving in Georgia is 5.1%.
What is the Percentage of Population Employed in Food Preparation & Serving in the United States?
Percentage of Population Employed in Food Preparation & Serving in the United States is 5.3%.