Zip Codes with the Highest Percentage of Population Employed in Food Preparation & Serving in Jesup, GA
RELATED REPORTS & OPTIONS
Food Preparation & Serving
Jesup
Compare Zip Codes
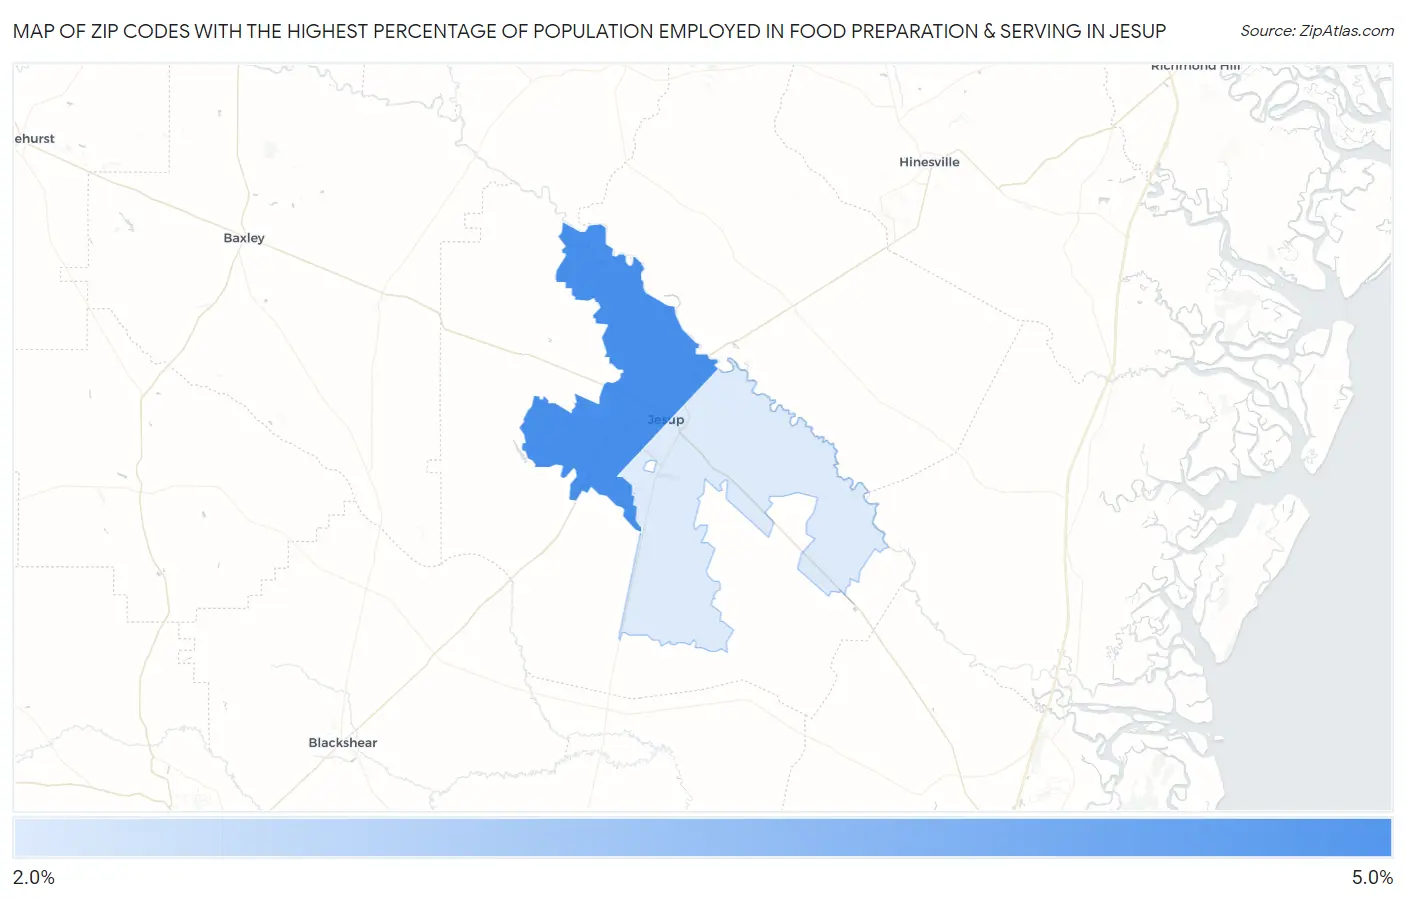
Map of Zip Codes with the Highest Percentage of Population Employed in Food Preparation & Serving in Jesup
3.0%
4.7%
Zip Codes with the Highest Percentage of Population Employed in Food Preparation & Serving in Jesup, GA
| Zip Code | % Employed | vs State | vs National | |
| 1. | 31545 | 4.7% | 5.1%(-0.402)#323 | 5.3%(-0.543)#13,976 |
| 2. | 31546 | 3.0% | 5.1%(-2.17)#507 | 5.3%(-2.31)#21,364 |
1
Common Questions
What are the Top Zip Codes with the Highest Percentage of Population Employed in Food Preparation & Serving in Jesup, GA?
Top Zip Codes with the Highest Percentage of Population Employed in Food Preparation & Serving in Jesup, GA are:
What zip code has the Highest Percentage of Population Employed in Food Preparation & Serving in Jesup, GA?
31545 has the Highest Percentage of Population Employed in Food Preparation & Serving in Jesup, GA with 4.7%.
What is the Percentage of Population Employed in Food Preparation & Serving in Jesup, GA?
Percentage of Population Employed in Food Preparation & Serving in Jesup is 5.9%.
What is the Percentage of Population Employed in Food Preparation & Serving in Georgia?
Percentage of Population Employed in Food Preparation & Serving in Georgia is 5.1%.
What is the Percentage of Population Employed in Food Preparation & Serving in the United States?
Percentage of Population Employed in Food Preparation & Serving in the United States is 5.3%.