Immigrants from Afghanistan Married-couple Households
COMPARE
Immigrants from Afghanistan
Select to Compare
Married-couple Households
Immigrants from Afghanistan Married-couple Households
47.2%
MARRIED-COUPLE HOUSEHOLDS
85.1/ 100
METRIC RATING
138th/ 347
METRIC RANK
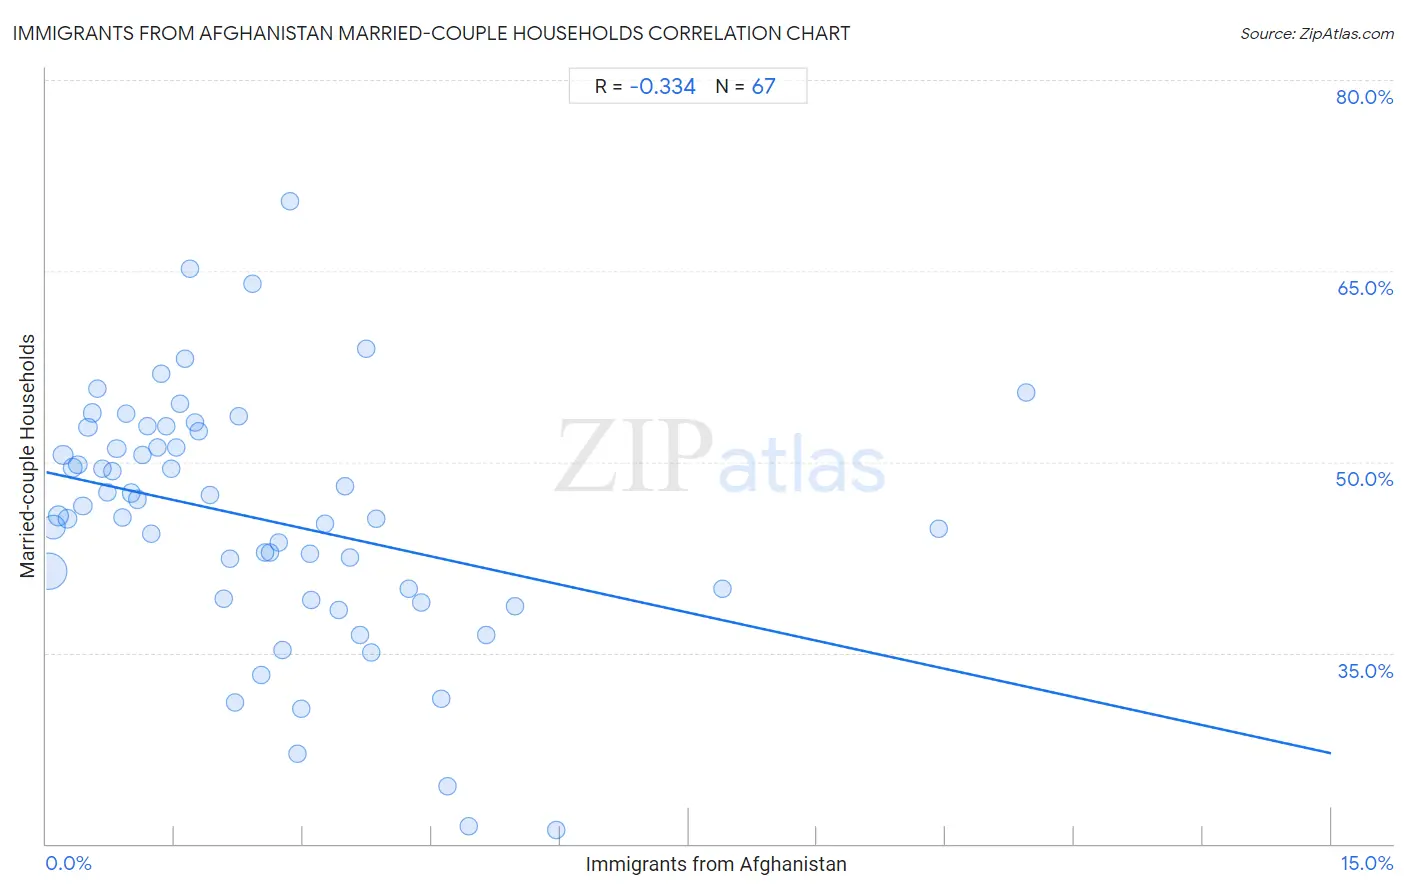
Immigrants from Afghanistan Married-couple Households Correlation Chart
The statistical analysis conducted on geographies consisting of 147,636,485 people shows a mild negative correlation between the proportion of Immigrants from Afghanistan and percentage of married-couple family households in the United States with a correlation coefficient (R) of -0.334 and weighted average of 47.2%. On average, for every 1% (one percent) increase in Immigrants from Afghanistan within a typical geography, there is a decrease of 1.5% in percentage of married-couple family households.
It is essential to understand that the correlation between the percentage of Immigrants from Afghanistan and percentage of married-couple family households does not imply a direct cause-and-effect relationship. It remains uncertain whether the presence of Immigrants from Afghanistan influences an upward or downward trend in the level of percentage of married-couple family households within an area, or if Immigrants from Afghanistan simply ended up residing in those areas with higher or lower levels of percentage of married-couple family households due to other factors.
Demographics Similar to Immigrants from Afghanistan by Married-couple Households
In terms of married-couple households, the demographic groups most similar to Immigrants from Afghanistan are New Zealander (47.2%, a difference of 0.010%), Immigrants from Malaysia (47.2%, a difference of 0.010%), Immigrants from Sweden (47.2%, a difference of 0.030%), Spanish (47.2%, a difference of 0.050%), and Costa Rican (47.2%, a difference of 0.050%).
| Demographics | Rating | Rank | Married-couple Households |
| Immigrants from Denmark | 87.5 /100 | #131 | Excellent 47.3% |
| Immigrants from Ukraine | 86.7 /100 | #132 | Excellent 47.3% |
| South Africans | 86.4 /100 | #133 | Excellent 47.3% |
| Immigrants from Greece | 86.0 /100 | #134 | Excellent 47.2% |
| Immigrants from Argentina | 86.0 /100 | #135 | Excellent 47.2% |
| New Zealanders | 85.3 /100 | #136 | Excellent 47.2% |
| Immigrants from Malaysia | 85.2 /100 | #137 | Excellent 47.2% |
| Immigrants from Afghanistan | 85.1 /100 | #138 | Excellent 47.2% |
| Immigrants from Sweden | 84.7 /100 | #139 | Excellent 47.2% |
| Spanish | 84.5 /100 | #140 | Excellent 47.2% |
| Costa Ricans | 84.4 /100 | #141 | Excellent 47.2% |
| Spaniards | 84.1 /100 | #142 | Excellent 47.2% |
| Immigrants from Belarus | 83.8 /100 | #143 | Excellent 47.2% |
| Mexicans | 83.4 /100 | #144 | Excellent 47.1% |
| Slovenes | 81.7 /100 | #145 | Excellent 47.1% |
Immigrants from Afghanistan Married-couple Households Correlation Summary
| Measurement | Immigrants from Afghanistan Data | Married-couple Households Data |
| Minimum | 0.029% | 21.1% |
| Maximum | 11.4% | 70.5% |
| Range | 11.4% | 49.4% |
| Mean | 2.5% | 45.5% |
| Median | 2.1% | 45.8% |
| Interquartile 25% (IQ1) | 0.93% | 39.3% |
| Interquartile 75% (IQ3) | 3.5% | 52.4% |
| Interquartile Range (IQR) | 2.5% | 13.1% |
| Standard Deviation (Sample) | 2.2% | 9.8% |
| Standard Deviation (Population) | 2.2% | 9.7% |
Correlation Details
| Immigrants from Afghanistan Percentile | Sample Size | Married-couple Households |
[ 0.0% - 0.5% ] 0.029% | 75,099,764 | 41.4% |
[ 0.0% - 0.5% ] 0.083% | 28,196,250 | 44.9% |
[ 0.0% - 0.5% ] 0.14% | 12,728,031 | 45.8% |
[ 0.0% - 0.5% ] 0.20% | 5,324,337 | 50.6% |
[ 0.0% - 0.5% ] 0.25% | 5,074,905 | 45.5% |
[ 0.0% - 0.5% ] 0.31% | 3,219,570 | 49.6% |
[ 0.0% - 0.5% ] 0.37% | 2,335,845 | 49.8% |
[ 0.0% - 0.5% ] 0.43% | 2,143,369 | 46.6% |
[ 0.0% - 0.5% ] 0.49% | 1,393,837 | 52.7% |
[ 0.5% - 1.0% ] 0.54% | 1,602,109 | 53.8% |
[ 0.5% - 1.0% ] 0.60% | 786,414 | 55.8% |
[ 0.5% - 1.0% ] 0.66% | 785,853 | 49.5% |
[ 0.5% - 1.0% ] 0.71% | 854,084 | 47.6% |
[ 0.5% - 1.0% ] 0.77% | 918,249 | 49.2% |
[ 0.5% - 1.0% ] 0.82% | 926,389 | 51.0% |
[ 0.5% - 1.0% ] 0.89% | 276,819 | 45.7% |
[ 0.5% - 1.0% ] 0.93% | 694,275 | 53.8% |
[ 0.5% - 1.0% ] 0.99% | 526,494 | 47.5% |
[ 1.0% - 1.5% ] 1.06% | 580,772 | 47.1% |
[ 1.0% - 1.5% ] 1.12% | 370,112 | 50.5% |
[ 1.0% - 1.5% ] 1.18% | 574,334 | 52.8% |
[ 1.0% - 1.5% ] 1.23% | 194,636 | 44.3% |
[ 1.0% - 1.5% ] 1.30% | 301,238 | 51.1% |
[ 1.0% - 1.5% ] 1.35% | 177,016 | 56.9% |
[ 1.0% - 1.5% ] 1.40% | 182,752 | 52.8% |
[ 1.0% - 1.5% ] 1.45% | 156,284 | 49.4% |
[ 1.5% - 2.0% ] 1.52% | 162,757 | 51.2% |
[ 1.5% - 2.0% ] 1.56% | 158,976 | 54.6% |
[ 1.5% - 2.0% ] 1.62% | 149,493 | 58.1% |
[ 1.5% - 2.0% ] 1.68% | 157,625 | 65.1% |
[ 1.5% - 2.0% ] 1.74% | 153,547 | 53.1% |
[ 1.5% - 2.0% ] 1.78% | 96,788 | 52.4% |
[ 1.5% - 2.0% ] 1.91% | 161,077 | 47.4% |
[ 2.0% - 2.5% ] 2.08% | 127,855 | 39.3% |
[ 2.0% - 2.5% ] 2.14% | 86,101 | 42.3% |
[ 2.0% - 2.5% ] 2.20% | 29,846 | 31.1% |
[ 2.0% - 2.5% ] 2.25% | 90,052 | 53.6% |
[ 2.0% - 2.5% ] 2.40% | 5,416 | 63.9% |
[ 2.5% - 3.0% ] 2.51% | 36,335 | 33.3% |
[ 2.5% - 3.0% ] 2.55% | 63,715 | 42.9% |
[ 2.5% - 3.0% ] 2.61% | 51,346 | 42.9% |
[ 2.5% - 3.0% ] 2.72% | 1,620 | 43.6% |
[ 2.5% - 3.0% ] 2.75% | 58,550 | 35.2% |
[ 2.5% - 3.0% ] 2.85% | 45,296 | 70.5% |
[ 2.5% - 3.0% ] 2.93% | 23,756 | 27.1% |
[ 2.5% - 3.0% ] 2.97% | 19,531 | 30.6% |
[ 3.0% - 3.5% ] 3.09% | 35,458 | 42.8% |
[ 3.0% - 3.5% ] 3.10% | 1,936 | 39.1% |
[ 3.0% - 3.5% ] 3.26% | 50,028 | 45.1% |
[ 3.0% - 3.5% ] 3.42% | 3,303 | 38.4% |
[ 3.0% - 3.5% ] 3.48% | 10,400 | 48.1% |
[ 3.5% - 4.0% ] 3.55% | 18,080 | 42.4% |
[ 3.5% - 4.0% ] 3.66% | 3,085 | 36.4% |
[ 3.5% - 4.0% ] 3.73% | 7,770 | 58.9% |
[ 3.5% - 4.0% ] 3.79% | 39,126 | 35.0% |
[ 3.5% - 4.0% ] 3.85% | 12,840 | 45.5% |
[ 4.0% - 4.5% ] 4.23% | 37,635 | 40.0% |
[ 4.0% - 4.5% ] 4.38% | 63,907 | 39.0% |
[ 4.5% - 5.0% ] 4.61% | 16,050 | 31.4% |
[ 4.5% - 5.0% ] 4.69% | 37,310 | 24.5% |
[ 4.5% - 5.0% ] 4.93% | 345 | 21.3% |
[ 5.0% - 5.5% ] 5.13% | 24,785 | 36.4% |
[ 5.0% - 5.5% ] 5.47% | 96,076 | 38.7% |
[ 5.5% - 6.0% ] 5.95% | 34,082 | 21.1% |
[ 7.5% - 8.0% ] 7.90% | 37,436 | 40.1% |
[ 10.0% - 10.5% ] 10.42% | 1,200 | 44.7% |
[ 11.0% - 11.5% ] 11.43% | 2,213 | 55.4% |