Immigrants from Kenya Married-couple Households
COMPARE
Immigrants from Kenya
Select to Compare
Married-couple Households
Immigrants from Kenya Married-couple Households
44.1%
MARRIED-COUPLE HOUSEHOLDS
0.4/ 100
METRIC RATING
249th/ 347
METRIC RANK
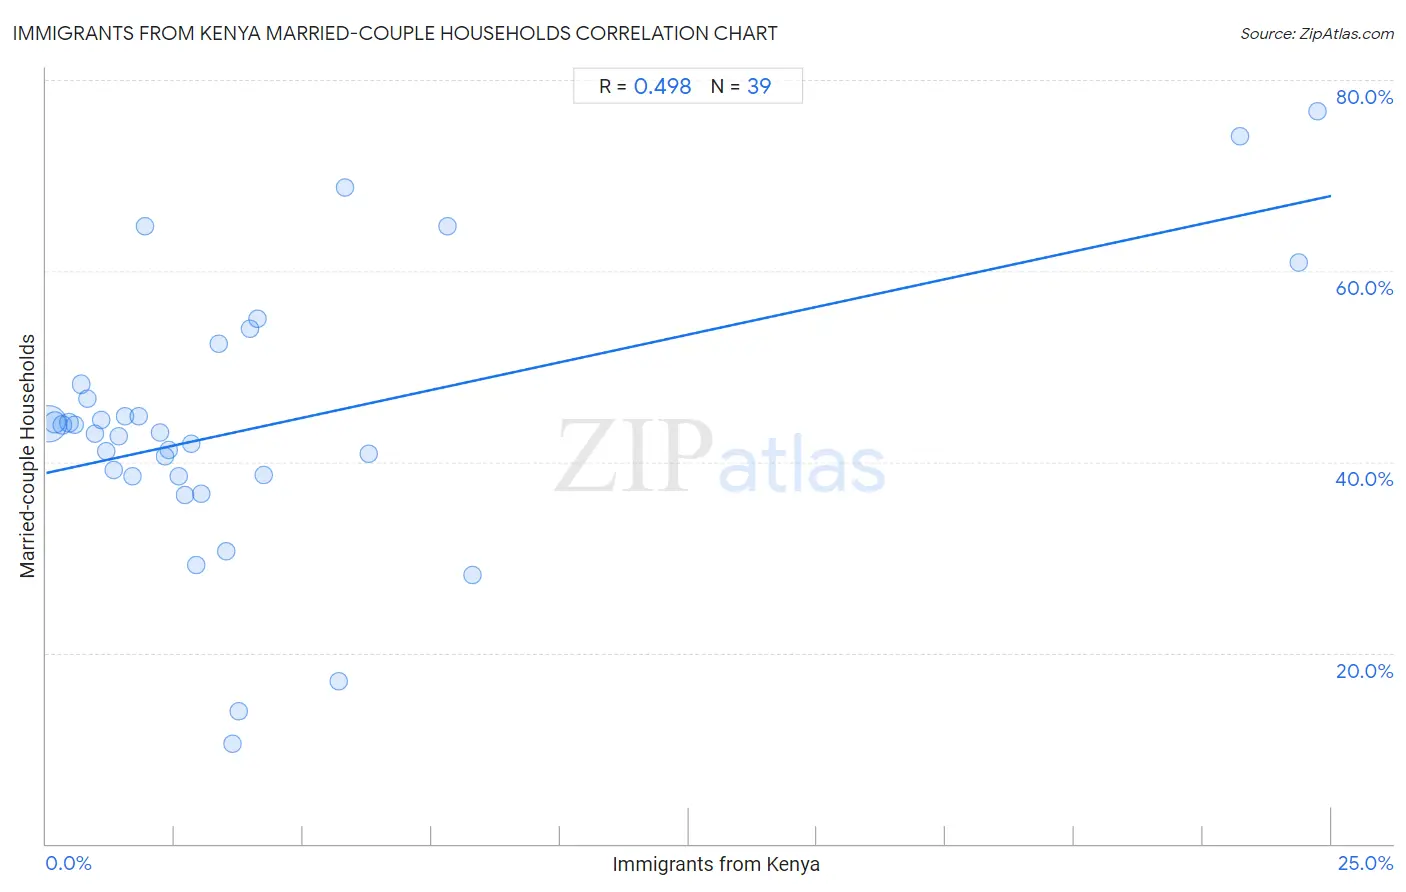
Immigrants from Kenya Married-couple Households Correlation Chart
The statistical analysis conducted on geographies consisting of 217,996,178 people shows a moderate positive correlation between the proportion of Immigrants from Kenya and percentage of married-couple family households in the United States with a correlation coefficient (R) of 0.498 and weighted average of 44.1%. On average, for every 1% (one percent) increase in Immigrants from Kenya within a typical geography, there is an increase of 1.2% in percentage of married-couple family households.
It is essential to understand that the correlation between the percentage of Immigrants from Kenya and percentage of married-couple family households does not imply a direct cause-and-effect relationship. It remains uncertain whether the presence of Immigrants from Kenya influences an upward or downward trend in the level of percentage of married-couple family households within an area, or if Immigrants from Kenya simply ended up residing in those areas with higher or lower levels of percentage of married-couple family households due to other factors.
Demographics Similar to Immigrants from Kenya by Married-couple Households
In terms of married-couple households, the demographic groups most similar to Immigrants from Kenya are French American Indian (44.1%, a difference of 0.010%), Yup'ik (44.1%, a difference of 0.050%), German Russian (44.0%, a difference of 0.090%), Seminole (44.0%, a difference of 0.16%), and Central American (43.9%, a difference of 0.28%).
| Demographics | Rating | Rank | Married-couple Households |
| Immigrants from Albania | 1.0 /100 | #242 | Tragic 44.4% |
| Immigrants from Saudi Arabia | 0.9 /100 | #243 | Tragic 44.4% |
| Immigrants from Armenia | 0.7 /100 | #244 | Tragic 44.3% |
| Immigrants from El Salvador | 0.7 /100 | #245 | Tragic 44.3% |
| Immigrants from Cuba | 0.6 /100 | #246 | Tragic 44.2% |
| Immigrants from Morocco | 0.6 /100 | #247 | Tragic 44.2% |
| Yup'ik | 0.4 /100 | #248 | Tragic 44.1% |
| Immigrants from Kenya | 0.4 /100 | #249 | Tragic 44.1% |
| French American Indians | 0.4 /100 | #250 | Tragic 44.1% |
| German Russians | 0.4 /100 | #251 | Tragic 44.0% |
| Seminole | 0.4 /100 | #252 | Tragic 44.0% |
| Central Americans | 0.3 /100 | #253 | Tragic 43.9% |
| Apache | 0.3 /100 | #254 | Tragic 43.9% |
| Shoshone | 0.3 /100 | #255 | Tragic 43.9% |
| Ugandans | 0.3 /100 | #256 | Tragic 43.8% |
Immigrants from Kenya Married-couple Households Correlation Summary
| Measurement | Immigrants from Kenya Data | Married-couple Households Data |
| Minimum | 0.045% | 10.5% |
| Maximum | 24.7% | 76.7% |
| Range | 24.7% | 66.2% |
| Mean | 4.3% | 43.9% |
| Median | 2.6% | 43.1% |
| Interquartile 25% (IQ1) | 1.2% | 38.5% |
| Interquartile 75% (IQ3) | 4.1% | 48.1% |
| Interquartile Range (IQR) | 2.9% | 9.6% |
| Standard Deviation (Sample) | 6.1% | 14.3% |
| Standard Deviation (Population) | 6.0% | 14.1% |
Correlation Details
| Immigrants from Kenya Percentile | Sample Size | Married-couple Households |
[ 0.0% - 0.5% ] 0.045% | 154,702,044 | 44.0% |
[ 0.0% - 0.5% ] 0.17% | 33,127,754 | 44.1% |
[ 0.0% - 0.5% ] 0.31% | 12,120,927 | 43.9% |
[ 0.0% - 0.5% ] 0.44% | 6,459,992 | 44.1% |
[ 0.5% - 1.0% ] 0.56% | 3,977,982 | 43.9% |
[ 0.5% - 1.0% ] 0.67% | 1,896,142 | 48.1% |
[ 0.5% - 1.0% ] 0.79% | 1,466,097 | 46.6% |
[ 0.5% - 1.0% ] 0.94% | 979,327 | 42.9% |
[ 1.0% - 1.5% ] 1.06% | 825,390 | 44.4% |
[ 1.0% - 1.5% ] 1.16% | 572,151 | 41.1% |
[ 1.0% - 1.5% ] 1.30% | 389,442 | 39.1% |
[ 1.0% - 1.5% ] 1.42% | 305,227 | 42.7% |
[ 1.5% - 2.0% ] 1.53% | 261,899 | 44.7% |
[ 1.5% - 2.0% ] 1.68% | 109,594 | 38.5% |
[ 1.5% - 2.0% ] 1.79% | 229,904 | 44.7% |
[ 1.5% - 2.0% ] 1.92% | 113,720 | 64.7% |
[ 2.0% - 2.5% ] 2.20% | 191,120 | 43.1% |
[ 2.0% - 2.5% ] 2.30% | 9,515 | 40.5% |
[ 2.0% - 2.5% ] 2.39% | 55,332 | 41.3% |
[ 2.5% - 3.0% ] 2.58% | 27,290 | 38.5% |
[ 2.5% - 3.0% ] 2.70% | 16,086 | 36.5% |
[ 2.5% - 3.0% ] 2.82% | 61,578 | 41.9% |
[ 2.5% - 3.0% ] 2.93% | 16,884 | 29.2% |
[ 3.0% - 3.5% ] 3.02% | 16,947 | 36.7% |
[ 3.0% - 3.5% ] 3.36% | 2,618 | 52.4% |
[ 3.0% - 3.5% ] 3.50% | 3,976 | 30.6% |
[ 3.5% - 4.0% ] 3.62% | 8,892 | 10.5% |
[ 3.5% - 4.0% ] 3.74% | 10,811 | 13.8% |
[ 3.5% - 4.0% ] 3.96% | 227 | 53.9% |
[ 4.0% - 4.5% ] 4.10% | 2,464 | 55.0% |
[ 4.0% - 4.5% ] 4.23% | 24,008 | 38.6% |
[ 5.5% - 6.0% ] 5.68% | 3,838 | 17.0% |
[ 5.5% - 6.0% ] 5.82% | 3,214 | 68.7% |
[ 6.0% - 6.5% ] 6.27% | 1,403 | 40.9% |
[ 7.5% - 8.0% ] 7.80% | 423 | 64.7% |
[ 8.0% - 8.5% ] 8.30% | 1,157 | 28.1% |
[ 23.0% - 23.5% ] 23.22% | 267 | 74.0% |
[ 24.0% - 24.5% ] 24.37% | 439 | 60.9% |
[ 24.5% - 25.0% ] 24.74% | 97 | 76.7% |