Immigrants from Philippines vs Crow Married-couple Households
COMPARE
Immigrants from Philippines
Crow
Married-couple Households
Married-couple Households Comparison
Immigrants from Philippines
Crow
49.3%
MARRIED-COUPLE HOUSEHOLDS
99.9/ 100
METRIC RATING
25th/ 347
METRIC RANK
41.4%
MARRIED-COUPLE HOUSEHOLDS
0.0/ 100
METRIC RATING
308th/ 347
METRIC RANK
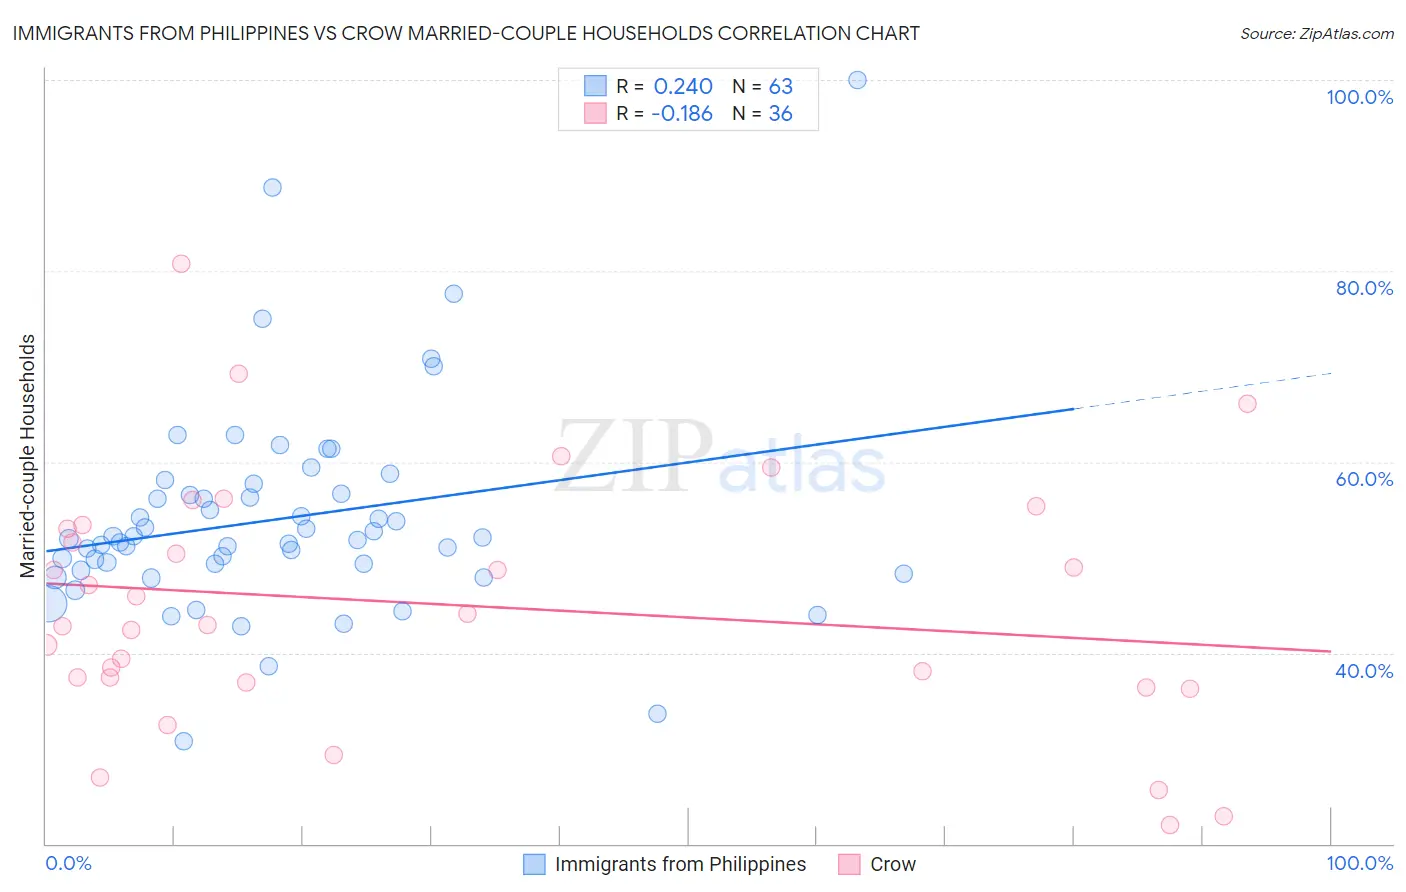
Immigrants from Philippines vs Crow Married-couple Households Correlation Chart
The statistical analysis conducted on geographies consisting of 471,010,900 people shows a weak positive correlation between the proportion of Immigrants from Philippines and percentage of married-couple family households in the United States with a correlation coefficient (R) of 0.240 and weighted average of 49.3%. Similarly, the statistical analysis conducted on geographies consisting of 59,202,817 people shows a poor negative correlation between the proportion of Crow and percentage of married-couple family households in the United States with a correlation coefficient (R) of -0.186 and weighted average of 41.4%, a difference of 19.3%.
Married-couple Households Correlation Summary
| Measurement | Immigrants from Philippines | Crow |
| Minimum | 30.7% | 21.9% |
| Maximum | 100.0% | 80.8% |
| Range | 69.3% | 58.9% |
| Mean | 54.0% | 45.1% |
| Median | 51.9% | 43.5% |
| Interquartile 25% (IQ1) | 48.6% | 37.1% |
| Interquartile 75% (IQ3) | 56.6% | 53.2% |
| Interquartile Range (IQR) | 8.0% | 16.0% |
| Standard Deviation (Sample) | 11.1% | 13.1% |
| Standard Deviation (Population) | 11.0% | 12.9% |
Similar Demographics by Married-couple Households
Demographics Similar to Immigrants from Philippines by Married-couple Households
In terms of married-couple households, the demographic groups most similar to Immigrants from Philippines are Immigrants from Scotland (49.3%, a difference of 0.13%), Bhutanese (49.3%, a difference of 0.15%), Czech (49.4%, a difference of 0.19%), Dutch (49.5%, a difference of 0.27%), and Asian (49.5%, a difference of 0.28%).
| Demographics | Rating | Rank | Married-couple Households |
| English | 99.9 /100 | #18 | Exceptional 49.6% |
| Europeans | 99.9 /100 | #19 | Exceptional 49.6% |
| Scandinavians | 99.9 /100 | #20 | Exceptional 49.6% |
| Norwegians | 99.9 /100 | #21 | Exceptional 49.5% |
| Asians | 99.9 /100 | #22 | Exceptional 49.5% |
| Dutch | 99.9 /100 | #23 | Exceptional 49.5% |
| Czechs | 99.9 /100 | #24 | Exceptional 49.4% |
| Immigrants | Philippines | 99.9 /100 | #25 | Exceptional 49.3% |
| Immigrants | Scotland | 99.8 /100 | #26 | Exceptional 49.3% |
| Bhutanese | 99.8 /100 | #27 | Exceptional 49.3% |
| Germans | 99.8 /100 | #28 | Exceptional 49.2% |
| Maltese | 99.8 /100 | #29 | Exceptional 49.2% |
| Bolivians | 99.8 /100 | #30 | Exceptional 49.2% |
| Native Hawaiians | 99.8 /100 | #31 | Exceptional 49.1% |
| Hungarians | 99.8 /100 | #32 | Exceptional 49.1% |
Demographics Similar to Crow by Married-couple Households
In terms of married-couple households, the demographic groups most similar to Crow are Guyanese (41.4%, a difference of 0.010%), Immigrants from Western Africa (41.4%, a difference of 0.010%), Immigrants from Trinidad and Tobago (41.2%, a difference of 0.35%), Sioux (41.5%, a difference of 0.38%), and Haitian (41.2%, a difference of 0.42%).
| Demographics | Rating | Rank | Married-couple Households |
| Immigrants | Bahamas | 0.0 /100 | #301 | Tragic 41.7% |
| Immigrants | Honduras | 0.0 /100 | #302 | Tragic 41.6% |
| Sub-Saharan Africans | 0.0 /100 | #303 | Tragic 41.6% |
| Immigrants | Guyana | 0.0 /100 | #304 | Tragic 41.6% |
| Sioux | 0.0 /100 | #305 | Tragic 41.5% |
| Guyanese | 0.0 /100 | #306 | Tragic 41.4% |
| Immigrants | Western Africa | 0.0 /100 | #307 | Tragic 41.4% |
| Crow | 0.0 /100 | #308 | Tragic 41.4% |
| Immigrants | Trinidad and Tobago | 0.0 /100 | #309 | Tragic 41.2% |
| Haitians | 0.0 /100 | #310 | Tragic 41.2% |
| Colville | 0.0 /100 | #311 | Tragic 41.0% |
| Africans | 0.0 /100 | #312 | Tragic 40.9% |
| Immigrants | Haiti | 0.0 /100 | #313 | Tragic 40.9% |
| Jamaicans | 0.0 /100 | #314 | Tragic 40.9% |
| Trinidadians and Tobagonians | 0.0 /100 | #315 | Tragic 40.9% |