Immigrants from Philippines vs Iranian Married-couple Households
COMPARE
Immigrants from Philippines
Iranian
Married-couple Households
Married-couple Households Comparison
Immigrants from Philippines
Iranians
49.3%
MARRIED-COUPLE HOUSEHOLDS
99.9/ 100
METRIC RATING
25th/ 347
METRIC RANK
49.0%
MARRIED-COUPLE HOUSEHOLDS
99.7/ 100
METRIC RATING
36th/ 347
METRIC RANK
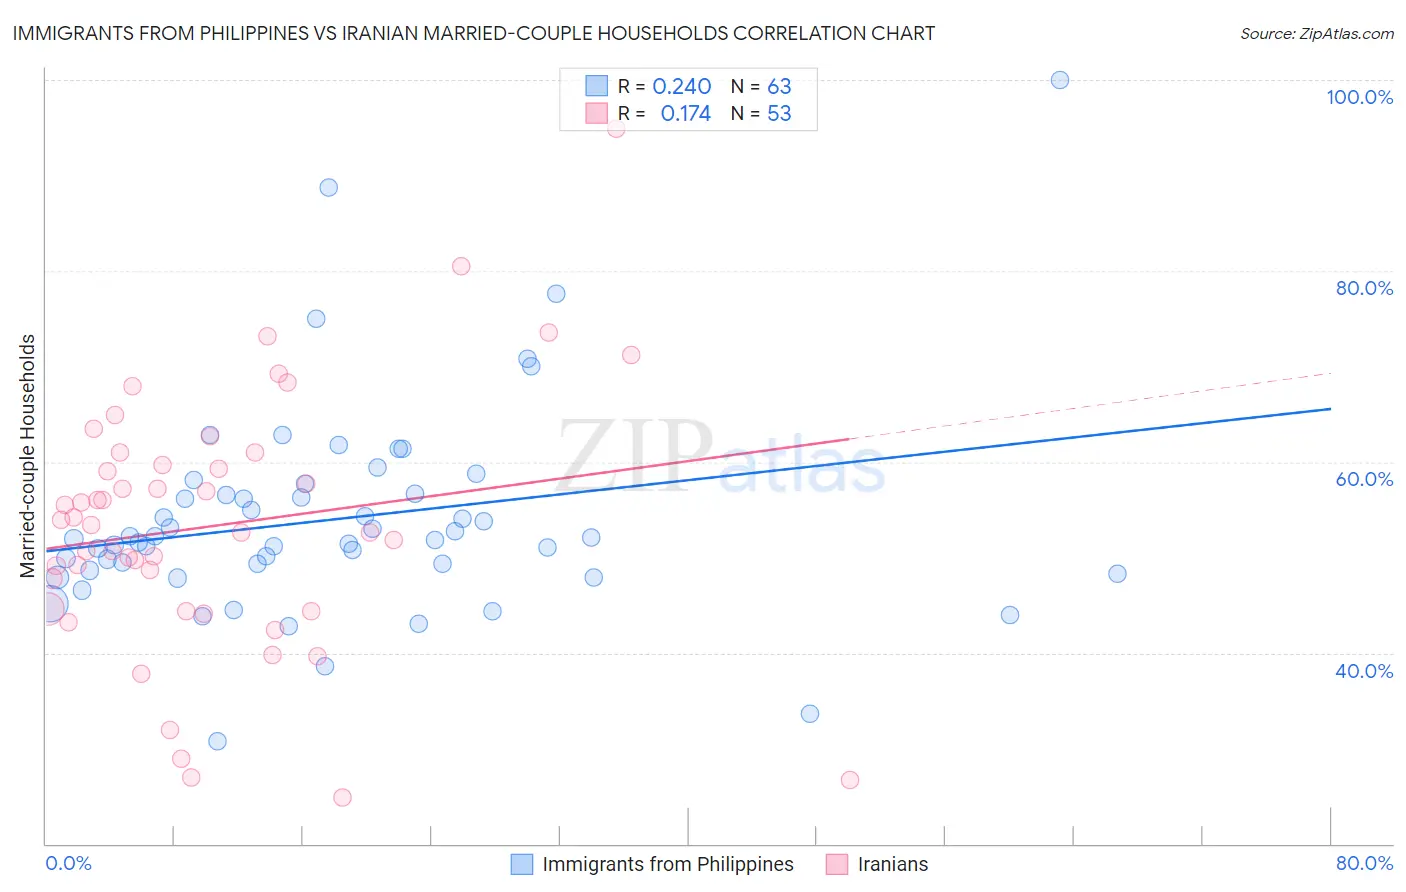
Immigrants from Philippines vs Iranian Married-couple Households Correlation Chart
The statistical analysis conducted on geographies consisting of 471,010,900 people shows a weak positive correlation between the proportion of Immigrants from Philippines and percentage of married-couple family households in the United States with a correlation coefficient (R) of 0.240 and weighted average of 49.3%. Similarly, the statistical analysis conducted on geographies consisting of 316,648,263 people shows a poor positive correlation between the proportion of Iranians and percentage of married-couple family households in the United States with a correlation coefficient (R) of 0.174 and weighted average of 49.0%, a difference of 0.75%.
Married-couple Households Correlation Summary
| Measurement | Immigrants from Philippines | Iranian |
| Minimum | 30.7% | 24.8% |
| Maximum | 100.0% | 94.9% |
| Range | 69.3% | 70.0% |
| Mean | 54.0% | 53.3% |
| Median | 51.9% | 53.4% |
| Interquartile 25% (IQ1) | 48.6% | 44.5% |
| Interquartile 75% (IQ3) | 56.6% | 60.3% |
| Interquartile Range (IQR) | 8.0% | 15.8% |
| Standard Deviation (Sample) | 11.1% | 13.5% |
| Standard Deviation (Population) | 11.0% | 13.4% |
Demographics Similar to Immigrants from Philippines and Iranians by Married-couple Households
In terms of married-couple households, the demographic groups most similar to Immigrants from Philippines are Immigrants from Scotland (49.3%, a difference of 0.13%), Bhutanese (49.3%, a difference of 0.15%), Czech (49.4%, a difference of 0.19%), Dutch (49.5%, a difference of 0.27%), and Asian (49.5%, a difference of 0.28%). Similarly, the demographic groups most similar to Iranians are Sri Lankan (49.0%, a difference of 0.0%), Scottish (49.0%, a difference of 0.090%), Greek (48.9%, a difference of 0.10%), Italian (49.0%, a difference of 0.11%), and Lithuanian (48.9%, a difference of 0.18%).
| Demographics | Rating | Rank | Married-couple Households |
| Scandinavians | 99.9 /100 | #20 | Exceptional 49.6% |
| Norwegians | 99.9 /100 | #21 | Exceptional 49.5% |
| Asians | 99.9 /100 | #22 | Exceptional 49.5% |
| Dutch | 99.9 /100 | #23 | Exceptional 49.5% |
| Czechs | 99.9 /100 | #24 | Exceptional 49.4% |
| Immigrants | Philippines | 99.9 /100 | #25 | Exceptional 49.3% |
| Immigrants | Scotland | 99.8 /100 | #26 | Exceptional 49.3% |
| Bhutanese | 99.8 /100 | #27 | Exceptional 49.3% |
| Germans | 99.8 /100 | #28 | Exceptional 49.2% |
| Maltese | 99.8 /100 | #29 | Exceptional 49.2% |
| Bolivians | 99.8 /100 | #30 | Exceptional 49.2% |
| Native Hawaiians | 99.8 /100 | #31 | Exceptional 49.1% |
| Hungarians | 99.8 /100 | #32 | Exceptional 49.1% |
| Immigrants | Asia | 99.7 /100 | #33 | Exceptional 49.1% |
| Italians | 99.7 /100 | #34 | Exceptional 49.0% |
| Scottish | 99.7 /100 | #35 | Exceptional 49.0% |
| Iranians | 99.7 /100 | #36 | Exceptional 49.0% |
| Sri Lankans | 99.7 /100 | #37 | Exceptional 49.0% |
| Greeks | 99.7 /100 | #38 | Exceptional 48.9% |
| Lithuanians | 99.6 /100 | #39 | Exceptional 48.9% |
| Immigrants | Bolivia | 99.6 /100 | #40 | Exceptional 48.9% |