Bangladeshi Married-couple Households
COMPARE
Bangladeshi
Select to Compare
Married-couple Households
Bangladeshi Married-couple Households
43.5%
MARRIED-COUPLE HOUSEHOLDS
0.1/ 100
METRIC RATING
264th/ 347
METRIC RANK
Bangladeshi Married-couple Households Correlation Chart
The statistical analysis conducted on geographies consisting of 141,328,159 people shows a weak positive correlation between the proportion of Bangladeshis and percentage of married-couple family households in the United States with a correlation coefficient (R) of 0.276 and weighted average of 43.5%. On average, for every 1% (one percent) increase in Bangladeshis within a typical geography, there is an increase of 0.25% in percentage of married-couple family households.
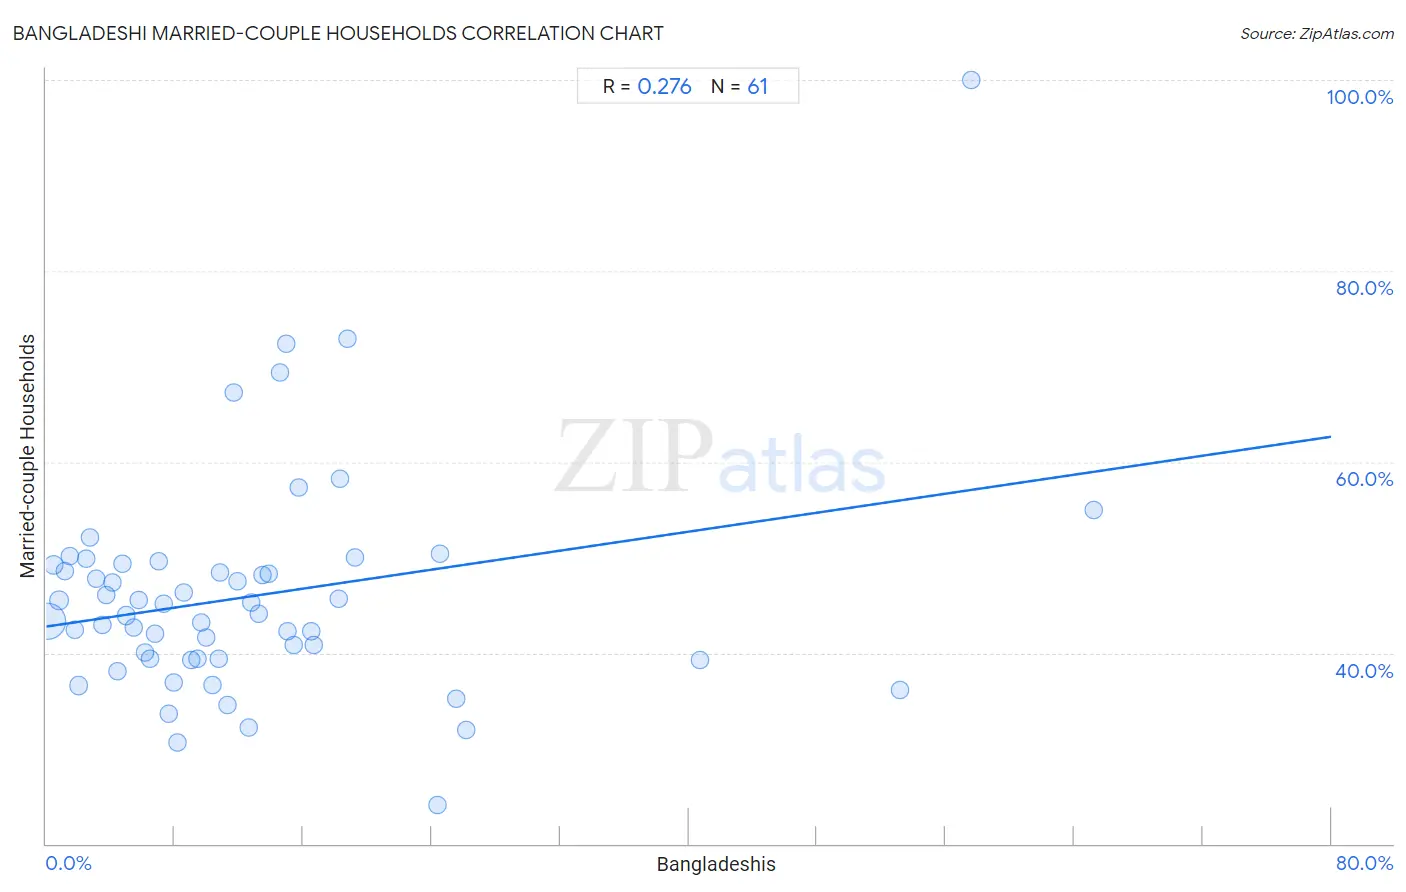
It is essential to understand that the correlation between the percentage of Bangladeshis and percentage of married-couple family households does not imply a direct cause-and-effect relationship. It remains uncertain whether the presence of Bangladeshis influences an upward or downward trend in the level of percentage of married-couple family households within an area, or if Bangladeshis simply ended up residing in those areas with higher or lower levels of percentage of married-couple family households due to other factors.
Demographics Similar to Bangladeshis by Married-couple Households
In terms of married-couple households, the demographic groups most similar to Bangladeshis are Moroccan (43.5%, a difference of 0.080%), Cree (43.6%, a difference of 0.11%), Ecuadorian (43.5%, a difference of 0.12%), Native/Alaskan (43.5%, a difference of 0.17%), and Vietnamese (43.6%, a difference of 0.22%).
| Demographics | Rating | Rank | Married-couple Households |
| Blackfeet | 0.2 /100 | #257 | Tragic 43.8% |
| Central American Indians | 0.2 /100 | #258 | Tragic 43.8% |
| Iroquois | 0.2 /100 | #259 | Tragic 43.7% |
| Immigrants from Cameroon | 0.2 /100 | #260 | Tragic 43.7% |
| Alaskan Athabascans | 0.2 /100 | #261 | Tragic 43.6% |
| Vietnamese | 0.2 /100 | #262 | Tragic 43.6% |
| Cree | 0.1 /100 | #263 | Tragic 43.6% |
| Bangladeshis | 0.1 /100 | #264 | Tragic 43.5% |
| Moroccans | 0.1 /100 | #265 | Tragic 43.5% |
| Ecuadorians | 0.1 /100 | #266 | Tragic 43.5% |
| Natives/Alaskans | 0.1 /100 | #267 | Tragic 43.5% |
| Immigrants from Burma/Myanmar | 0.1 /100 | #268 | Tragic 43.4% |
| Immigrants from Sierra Leone | 0.1 /100 | #269 | Tragic 43.3% |
| Yuman | 0.1 /100 | #270 | Tragic 43.3% |
| Guatemalans | 0.1 /100 | #271 | Tragic 43.3% |
Bangladeshi Married-couple Households Correlation Summary
| Measurement | Bangladeshi Data | Married-couple Households Data |
| Minimum | 0.061% | 24.1% |
| Maximum | 65.2% | 100.0% |
| Range | 65.2% | 75.9% |
| Mean | 13.0% | 46.0% |
| Median | 10.0% | 44.1% |
| Interquartile 25% (IQ1) | 4.9% | 39.3% |
| Interquartile 75% (IQ3) | 15.6% | 49.3% |
| Interquartile Range (IQR) | 10.7% | 9.9% |
| Standard Deviation (Sample) | 13.0% | 11.7% |
| Standard Deviation (Population) | 12.9% | 11.6% |
Correlation Details
| Bangladeshi Percentile | Sample Size | Married-couple Households |
[ 0.0% - 0.5% ] 0.061% | 114,841,342 | 43.3% |
[ 0.0% - 0.5% ] 0.45% | 8,735,461 | 49.2% |
[ 0.5% - 1.0% ] 0.80% | 3,552,896 | 45.5% |
[ 1.0% - 1.5% ] 1.16% | 1,841,504 | 48.5% |
[ 1.0% - 1.5% ] 1.45% | 1,963,286 | 50.1% |
[ 1.5% - 2.0% ] 1.75% | 2,129,322 | 42.4% |
[ 2.0% - 2.5% ] 2.04% | 1,196,311 | 36.6% |
[ 2.0% - 2.5% ] 2.47% | 721,978 | 49.9% |
[ 2.5% - 3.0% ] 2.73% | 624,931 | 52.0% |
[ 3.0% - 3.5% ] 3.13% | 471,590 | 47.7% |
[ 3.0% - 3.5% ] 3.47% | 936,270 | 42.9% |
[ 3.5% - 4.0% ] 3.73% | 328,537 | 46.0% |
[ 4.0% - 4.5% ] 4.10% | 538,756 | 47.4% |
[ 4.0% - 4.5% ] 4.42% | 290,997 | 38.1% |
[ 4.5% - 5.0% ] 4.76% | 30,701 | 49.4% |
[ 4.5% - 5.0% ] 4.98% | 761,348 | 43.9% |
[ 5.0% - 5.5% ] 5.48% | 167,360 | 42.7% |
[ 5.5% - 6.0% ] 5.77% | 107,730 | 45.5% |
[ 6.0% - 6.5% ] 6.12% | 174,810 | 40.1% |
[ 6.0% - 6.5% ] 6.44% | 63,612 | 39.4% |
[ 6.5% - 7.0% ] 6.76% | 170,696 | 42.0% |
[ 6.5% - 7.0% ] 6.99% | 50,484 | 49.6% |
[ 7.0% - 7.5% ] 7.32% | 10,557 | 45.2% |
[ 7.5% - 8.0% ] 7.66% | 37,988 | 33.6% |
[ 7.5% - 8.0% ] 7.92% | 42,735 | 36.9% |
[ 8.0% - 8.5% ] 8.18% | 52,886 | 30.6% |
[ 8.5% - 9.0% ] 8.55% | 12,684 | 46.3% |
[ 9.0% - 9.5% ] 9.03% | 148,369 | 39.3% |
[ 9.0% - 9.5% ] 9.40% | 51,109 | 39.3% |
[ 9.5% - 10.0% ] 9.63% | 136,085 | 43.2% |
[ 9.5% - 10.0% ] 9.96% | 134,205 | 41.6% |
[ 10.0% - 10.5% ] 10.33% | 64,531 | 36.6% |
[ 10.5% - 11.0% ] 10.72% | 70,827 | 39.4% |
[ 10.5% - 11.0% ] 10.85% | 31,292 | 48.4% |
[ 11.0% - 11.5% ] 11.27% | 308,806 | 34.5% |
[ 11.5% - 12.0% ] 11.69% | 1,215 | 67.3% |
[ 11.5% - 12.0% ] 11.89% | 32,912 | 47.5% |
[ 12.5% - 13.0% ] 12.59% | 2,208 | 32.1% |
[ 12.5% - 13.0% ] 12.76% | 84,951 | 45.3% |
[ 13.0% - 13.5% ] 13.26% | 2,316 | 44.1% |
[ 13.0% - 13.5% ] 13.48% | 13,459 | 48.2% |
[ 13.5% - 14.0% ] 13.86% | 95,310 | 48.3% |
[ 14.5% - 15.0% ] 14.53% | 296 | 69.4% |
[ 14.5% - 15.0% ] 14.91% | 932 | 72.4% |
[ 15.0% - 15.5% ] 15.04% | 13,116 | 42.3% |
[ 15.0% - 15.5% ] 15.39% | 132,060 | 40.9% |
[ 15.5% - 16.0% ] 15.74% | 216 | 57.3% |
[ 16.0% - 16.5% ] 16.48% | 6,790 | 42.3% |
[ 16.5% - 17.0% ] 16.66% | 34,220 | 40.8% |
[ 18.0% - 18.5% ] 18.23% | 7,581 | 45.6% |
[ 18.0% - 18.5% ] 18.31% | 17,716 | 58.2% |
[ 18.5% - 19.0% ] 18.74% | 619 | 72.9% |
[ 19.0% - 19.5% ] 19.23% | 26 | 50.0% |
[ 24.0% - 24.5% ] 24.36% | 390 | 24.1% |
[ 24.5% - 25.0% ] 24.55% | 1,218 | 50.4% |
[ 25.5% - 26.0% ] 25.55% | 57,662 | 35.1% |
[ 26.0% - 26.5% ] 26.16% | 19,613 | 31.9% |
[ 40.5% - 41.0% ] 40.74% | 734 | 39.2% |
[ 53.0% - 53.5% ] 53.15% | 111 | 36.2% |
[ 57.5% - 58.0% ] 57.62% | 210 | 100.0% |
[ 65.0% - 65.5% ] 65.25% | 282 | 54.9% |