Subsaharan African Married-couple Households
COMPARE
Subsaharan African
Select to Compare
Married-couple Households
Subsaharan African Married-couple Households
41.6%
MARRIED-COUPLE HOUSEHOLDS
0.0/ 100
METRIC RATING
303rd/ 347
METRIC RANK
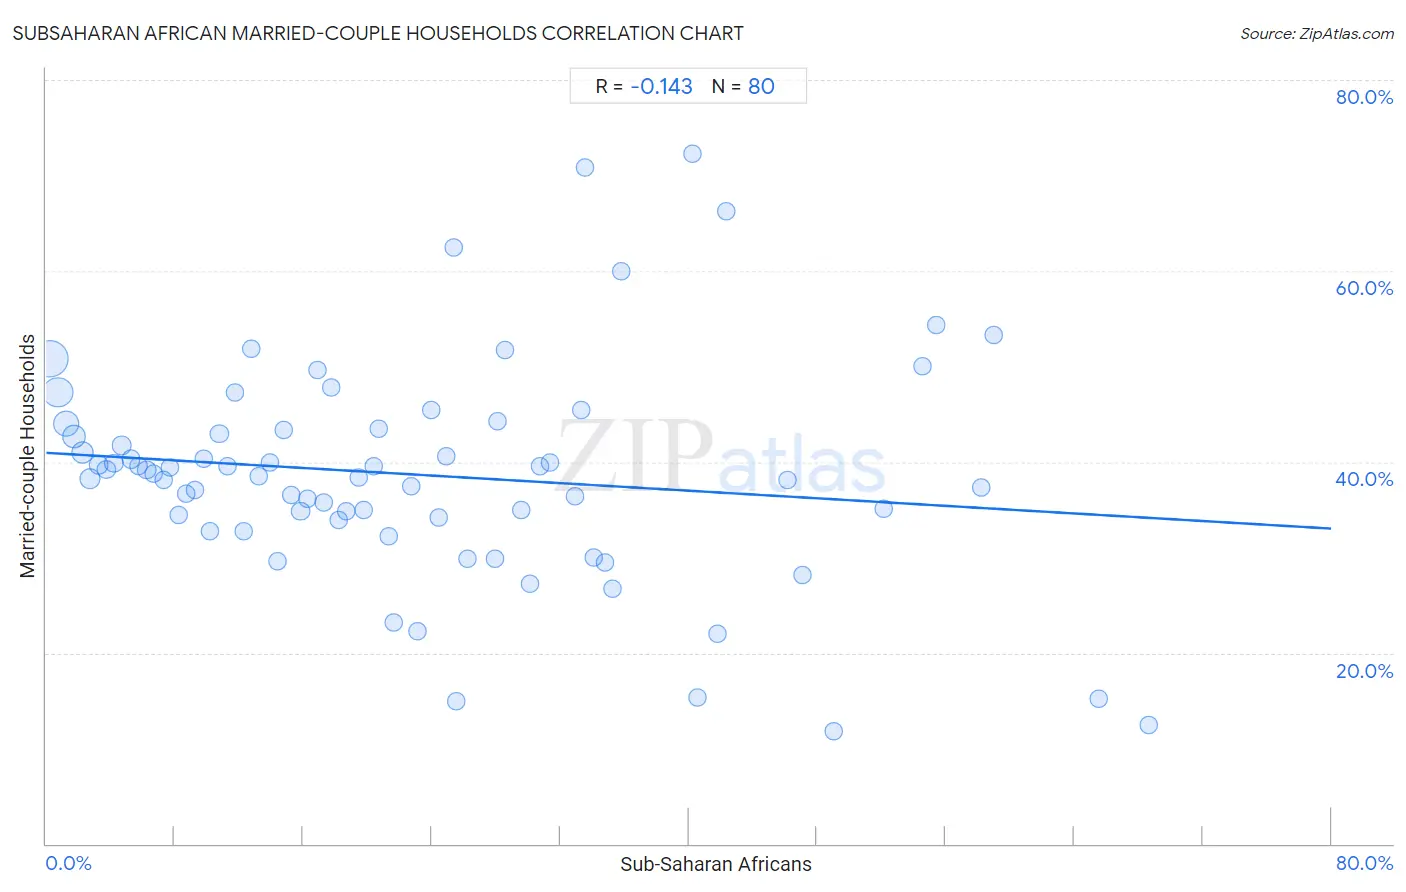
Subsaharan African Married-couple Households Correlation Chart
The statistical analysis conducted on geographies consisting of 507,572,233 people shows a poor negative correlation between the proportion of Sub-Saharan Africans and percentage of married-couple family households in the United States with a correlation coefficient (R) of -0.143 and weighted average of 41.6%. On average, for every 1% (one percent) increase in Sub-Saharan Africans within a typical geography, there is a decrease of 0.099% in percentage of married-couple family households.
It is essential to understand that the correlation between the percentage of Sub-Saharan Africans and percentage of married-couple family households does not imply a direct cause-and-effect relationship. It remains uncertain whether the presence of Sub-Saharan Africans influences an upward or downward trend in the level of percentage of married-couple family households within an area, or if Sub-Saharan Africans simply ended up residing in those areas with higher or lower levels of percentage of married-couple family households due to other factors.
Demographics Similar to Sub-Saharan Africans by Married-couple Households
In terms of married-couple households, the demographic groups most similar to Sub-Saharan Africans are Immigrants from Honduras (41.6%, a difference of 0.0%), Immigrants from Guyana (41.6%, a difference of 0.11%), Immigrants from Bahamas (41.7%, a difference of 0.18%), Sioux (41.5%, a difference of 0.22%), and Immigrants from Belize (41.8%, a difference of 0.39%).
| Demographics | Rating | Rank | Married-couple Households |
| Immigrants from Sudan | 0.0 /100 | #296 | Tragic 41.9% |
| Arapaho | 0.0 /100 | #297 | Tragic 41.8% |
| Immigrants from Middle Africa | 0.0 /100 | #298 | Tragic 41.8% |
| Immigrants from Ghana | 0.0 /100 | #299 | Tragic 41.8% |
| Immigrants from Belize | 0.0 /100 | #300 | Tragic 41.8% |
| Immigrants from Bahamas | 0.0 /100 | #301 | Tragic 41.7% |
| Immigrants from Honduras | 0.0 /100 | #302 | Tragic 41.6% |
| Sub-Saharan Africans | 0.0 /100 | #303 | Tragic 41.6% |
| Immigrants from Guyana | 0.0 /100 | #304 | Tragic 41.6% |
| Sioux | 0.0 /100 | #305 | Tragic 41.5% |
| Guyanese | 0.0 /100 | #306 | Tragic 41.4% |
| Immigrants from Western Africa | 0.0 /100 | #307 | Tragic 41.4% |
| Crow | 0.0 /100 | #308 | Tragic 41.4% |
| Immigrants from Trinidad and Tobago | 0.0 /100 | #309 | Tragic 41.2% |
| Haitians | 0.0 /100 | #310 | Tragic 41.2% |
Subsaharan African Married-couple Households Correlation Summary
| Measurement | Subsaharan African Data | Married-couple Households Data |
| Minimum | 0.24% | 11.8% |
| Maximum | 68.6% | 72.3% |
| Range | 68.4% | 60.5% |
| Mean | 23.1% | 38.7% |
| Median | 20.1% | 38.6% |
| Interquartile 25% (IQ1) | 10.0% | 34.1% |
| Interquartile 75% (IQ3) | 33.1% | 43.4% |
| Interquartile Range (IQR) | 23.1% | 9.3% |
| Standard Deviation (Sample) | 16.6% | 11.6% |
| Standard Deviation (Population) | 16.5% | 11.5% |
Correlation Details
| Subsaharan African Percentile | Sample Size | Married-couple Households |
[ 0.0% - 0.5% ] 0.24% | 172,320,937 | 50.8% |
[ 0.5% - 1.0% ] 0.72% | 106,912,677 | 47.3% |
[ 1.0% - 1.5% ] 1.24% | 70,630,524 | 44.0% |
[ 1.5% - 2.0% ] 1.73% | 41,219,975 | 42.7% |
[ 2.0% - 2.5% ] 2.25% | 34,276,023 | 41.0% |
[ 2.5% - 3.0% ] 2.73% | 23,392,216 | 38.2% |
[ 3.0% - 3.5% ] 3.23% | 13,225,577 | 39.6% |
[ 3.5% - 4.0% ] 3.75% | 9,293,662 | 39.2% |
[ 4.0% - 4.5% ] 4.22% | 8,854,185 | 39.9% |
[ 4.5% - 5.0% ] 4.71% | 4,058,537 | 41.7% |
[ 5.0% - 5.5% ] 5.29% | 3,773,227 | 40.3% |
[ 5.5% - 6.0% ] 5.77% | 3,289,506 | 39.6% |
[ 6.0% - 6.5% ] 6.26% | 2,200,977 | 39.2% |
[ 6.5% - 7.0% ] 6.66% | 2,516,365 | 38.7% |
[ 7.0% - 7.5% ] 7.34% | 1,485,697 | 38.1% |
[ 7.5% - 8.0% ] 7.73% | 1,548,007 | 39.4% |
[ 8.0% - 8.5% ] 8.23% | 990,311 | 34.5% |
[ 8.5% - 9.0% ] 8.72% | 992,684 | 36.6% |
[ 9.0% - 9.5% ] 9.27% | 866,189 | 37.0% |
[ 9.5% - 10.0% ] 9.78% | 413,452 | 40.4% |
[ 10.0% - 10.5% ] 10.22% | 753,829 | 32.7% |
[ 10.5% - 11.0% ] 10.78% | 529,116 | 43.0% |
[ 11.0% - 11.5% ] 11.27% | 653,154 | 39.6% |
[ 11.5% - 12.0% ] 11.75% | 279,205 | 47.3% |
[ 12.0% - 12.5% ] 12.27% | 101,251 | 32.7% |
[ 12.5% - 13.0% ] 12.77% | 185,037 | 51.9% |
[ 13.0% - 13.5% ] 13.23% | 438,997 | 38.5% |
[ 13.5% - 14.0% ] 13.91% | 341,518 | 40.0% |
[ 14.0% - 14.5% ] 14.38% | 83,868 | 29.6% |
[ 14.5% - 15.0% ] 14.81% | 134,736 | 43.3% |
[ 15.0% - 15.5% ] 15.22% | 236,677 | 36.5% |
[ 15.5% - 16.0% ] 15.84% | 217,889 | 34.9% |
[ 16.0% - 16.5% ] 16.25% | 194,496 | 36.1% |
[ 16.5% - 17.0% ] 16.91% | 30,595 | 49.6% |
[ 17.0% - 17.5% ] 17.26% | 146,055 | 35.8% |
[ 17.5% - 18.0% ] 17.73% | 65,973 | 47.8% |
[ 18.0% - 18.5% ] 18.20% | 221,308 | 33.9% |
[ 18.5% - 19.0% ] 18.66% | 97,301 | 34.8% |
[ 19.0% - 19.5% ] 19.43% | 243,526 | 38.4% |
[ 19.5% - 20.0% ] 19.74% | 20,175 | 35.0% |
[ 20.0% - 20.5% ] 20.40% | 38,846 | 39.5% |
[ 20.5% - 21.0% ] 20.73% | 34,831 | 43.5% |
[ 21.0% - 21.5% ] 21.30% | 28,219 | 32.2% |
[ 21.5% - 22.0% ] 21.65% | 54,524 | 23.2% |
[ 22.5% - 23.0% ] 22.71% | 52,239 | 37.4% |
[ 23.0% - 23.5% ] 23.08% | 208 | 22.3% |
[ 23.5% - 24.0% ] 23.99% | 14,553 | 45.5% |
[ 24.0% - 24.5% ] 24.43% | 25,523 | 34.2% |
[ 24.5% - 25.0% ] 24.86% | 370 | 40.6% |
[ 25.0% - 25.5% ] 25.38% | 658 | 62.5% |
[ 25.5% - 26.0% ] 25.54% | 881 | 15.0% |
[ 26.0% - 26.5% ] 26.24% | 2,138 | 29.9% |
[ 27.5% - 28.0% ] 27.93% | 512 | 29.8% |
[ 28.0% - 28.5% ] 28.06% | 29,898 | 44.2% |
[ 28.5% - 29.0% ] 28.57% | 154 | 51.7% |
[ 29.5% - 30.0% ] 29.55% | 44 | 35.0% |
[ 30.0% - 30.5% ] 30.14% | 2,037 | 27.3% |
[ 30.5% - 31.0% ] 30.74% | 15,489 | 39.6% |
[ 31.0% - 31.5% ] 31.35% | 2,485 | 39.9% |
[ 32.5% - 33.0% ] 32.93% | 334 | 36.4% |
[ 33.0% - 33.5% ] 33.33% | 39 | 45.5% |
[ 33.5% - 34.0% ] 33.53% | 173 | 70.8% |
[ 34.0% - 34.5% ] 34.07% | 3,824 | 29.9% |
[ 34.5% - 35.0% ] 34.78% | 46 | 29.4% |
[ 35.0% - 35.5% ] 35.23% | 1,286 | 26.7% |
[ 35.5% - 36.0% ] 35.82% | 67 | 60.0% |
[ 40.0% - 40.5% ] 40.22% | 4,572 | 72.3% |
[ 40.5% - 41.0% ] 40.56% | 9,613 | 15.3% |
[ 41.5% - 42.0% ] 41.76% | 613 | 22.0% |
[ 42.0% - 42.5% ] 42.31% | 338 | 66.3% |
[ 46.0% - 46.5% ] 46.15% | 78 | 38.1% |
[ 47.0% - 47.5% ] 47.10% | 1,157 | 28.1% |
[ 49.0% - 49.5% ] 49.02% | 9,074 | 11.8% |
[ 52.0% - 52.5% ] 52.17% | 46 | 35.1% |
[ 54.5% - 55.0% ] 54.55% | 11 | 50.0% |
[ 55.0% - 55.5% ] 55.41% | 231 | 54.3% |
[ 58.0% - 58.5% ] 58.19% | 574 | 37.3% |
[ 59.0% - 59.5% ] 59.02% | 549 | 53.2% |
[ 65.5% - 66.0% ] 65.55% | 479 | 15.2% |
[ 68.5% - 69.0% ] 68.60% | 86 | 12.5% |