Zip Codes with the Highest Percentage of Population Employed in Health Diagnosing & Treating in Benton, AR
RELATED REPORTS & OPTIONS
Health Diagnosing & Treating
Benton
Compare Zip Codes
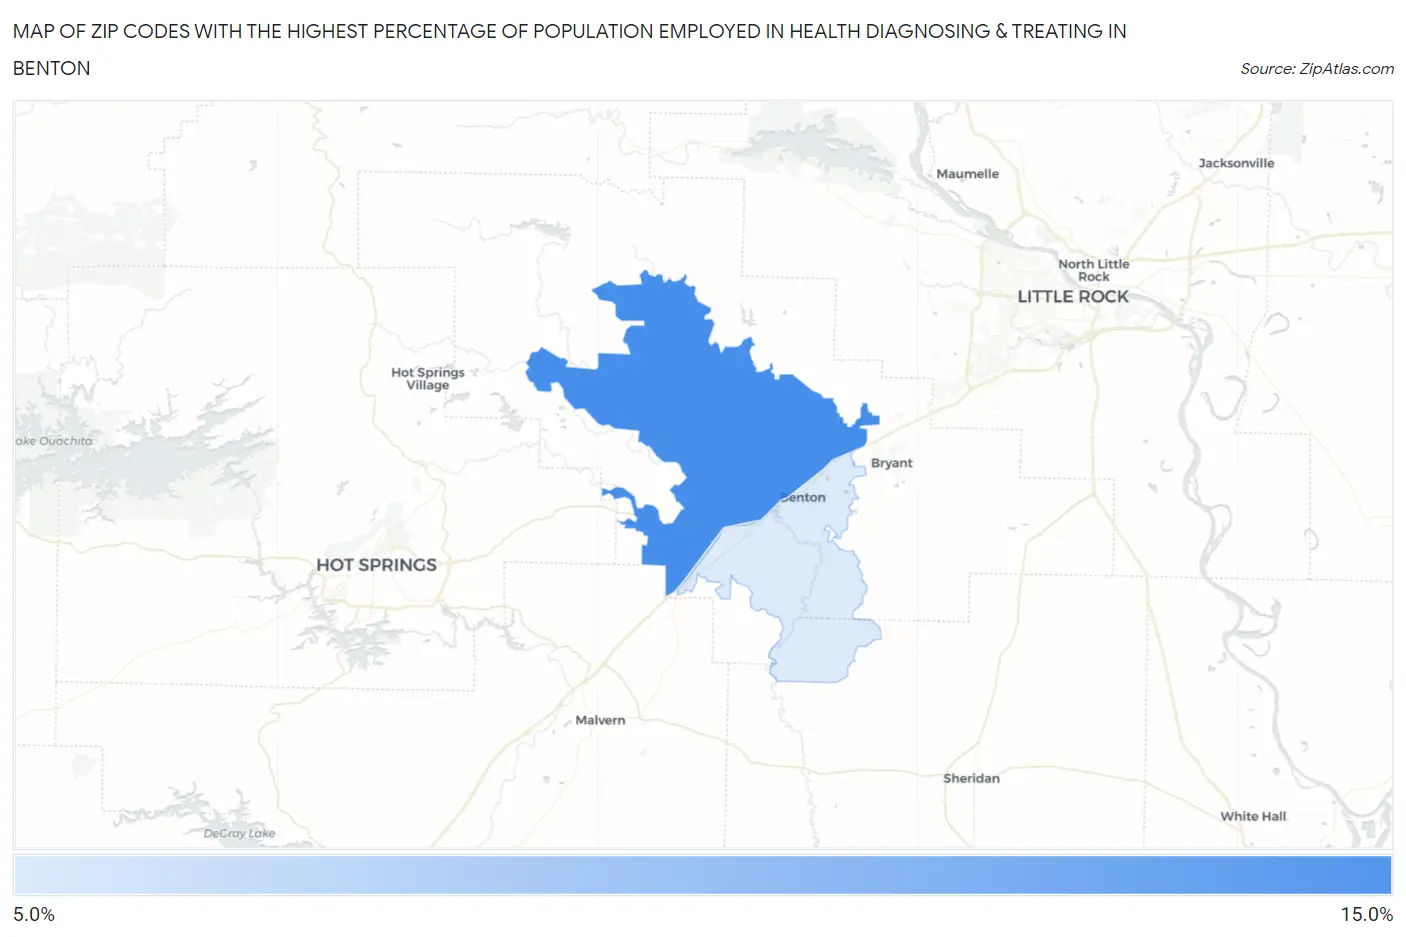
Map of Zip Codes with the Highest Percentage of Population Employed in Health Diagnosing & Treating in Benton
10.0%
11.6%
Zip Codes with the Highest Percentage of Population Employed in Health Diagnosing & Treating in Benton, AR
| Zip Code | % Employed | vs State | vs National | |
| 1. | 72019 | 11.6% | 7.2%(+4.46)#71 | 6.2%(+5.39)#2,421 |
| 2. | 72015 | 10.0% | 7.2%(+2.82)#97 | 6.2%(+3.76)#3,886 |
1
Common Questions
What are the Top Zip Codes with the Highest Percentage of Population Employed in Health Diagnosing & Treating in Benton, AR?
Top Zip Codes with the Highest Percentage of Population Employed in Health Diagnosing & Treating in Benton, AR are:
What zip code has the Highest Percentage of Population Employed in Health Diagnosing & Treating in Benton, AR?
72019 has the Highest Percentage of Population Employed in Health Diagnosing & Treating in Benton, AR with 11.6%.
What is the Percentage of Population Employed in Health Diagnosing & Treating in Benton, AR?
Percentage of Population Employed in Health Diagnosing & Treating in Benton is 9.3%.
What is the Percentage of Population Employed in Health Diagnosing & Treating in Arkansas?
Percentage of Population Employed in Health Diagnosing & Treating in Arkansas is 7.2%.
What is the Percentage of Population Employed in Health Diagnosing & Treating in the United States?
Percentage of Population Employed in Health Diagnosing & Treating in the United States is 6.2%.