Lexa, AR Map & Demographics
Lexa Map
Lexa Overview
$32,864
PER CAPITA INCOME
$67,083
AVG FAMILY INCOME
$43,750
AVG HOUSEHOLD INCOME
0.7%
WAGE / INCOME GAP [ % ]
99.3¢/ $1
WAGE / INCOME GAP [ $ ]
0.30
INEQUALITY / GINI INDEX
92
TOTAL POPULATION
42
MALE POPULATION
50
FEMALE POPULATION
84.00
MALES / 100 FEMALES
119.05
FEMALES / 100 MALES
56.5
MEDIAN AGE
4.7
AVG FAMILY SIZE
1.8
AVG HOUSEHOLD SIZE
51
LABOR FORCE [ PEOPLE ]
66.2%
PERCENT IN LABOR FORCE
Lexa Zip Codes
Income in Lexa
Income Overview in Lexa
Per Capita Income in Lexa is $32,864, while median incomes of families and households are $67,083 and $43,750 respectively.
| Characteristic | Number | Measure |
| Per Capita Income | 92 | $32,864 |
| Median Family Income | 11 | $67,083 |
| Mean Family Income | 11 | $75,818 |
| Median Household Income | 51 | $43,750 |
| Mean Household Income | 51 | $48,984 |
| Income Deficit | 11 | $0 |
| Wage / Income Gap (%) | 92 | 0.74% |
| Wage / Income Gap ($) | 92 | 99.26¢ per $1 |
| Gini / Inequality Index | 92 | 0.30 |
Earnings by Sex in Lexa
Average Earnings in Lexa are $34,526, $34,375 for men and $34,632 for women, a difference of 0.7%.
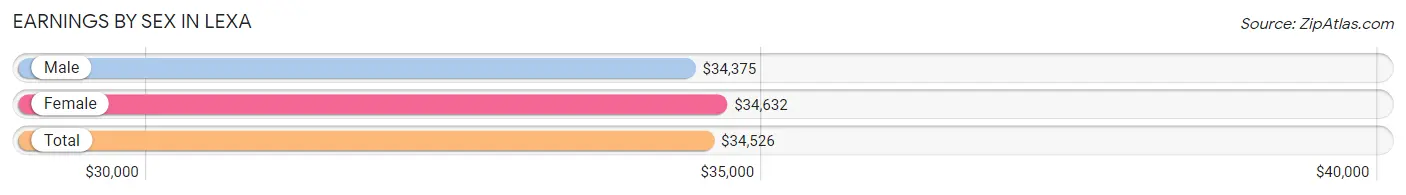
| Sex | Number | Average Earnings |
| Male | 20 (35.1%) | $34,375 |
| Female | 37 (64.9%) | $34,632 |
| Total | 57 (100.0%) | $34,526 |
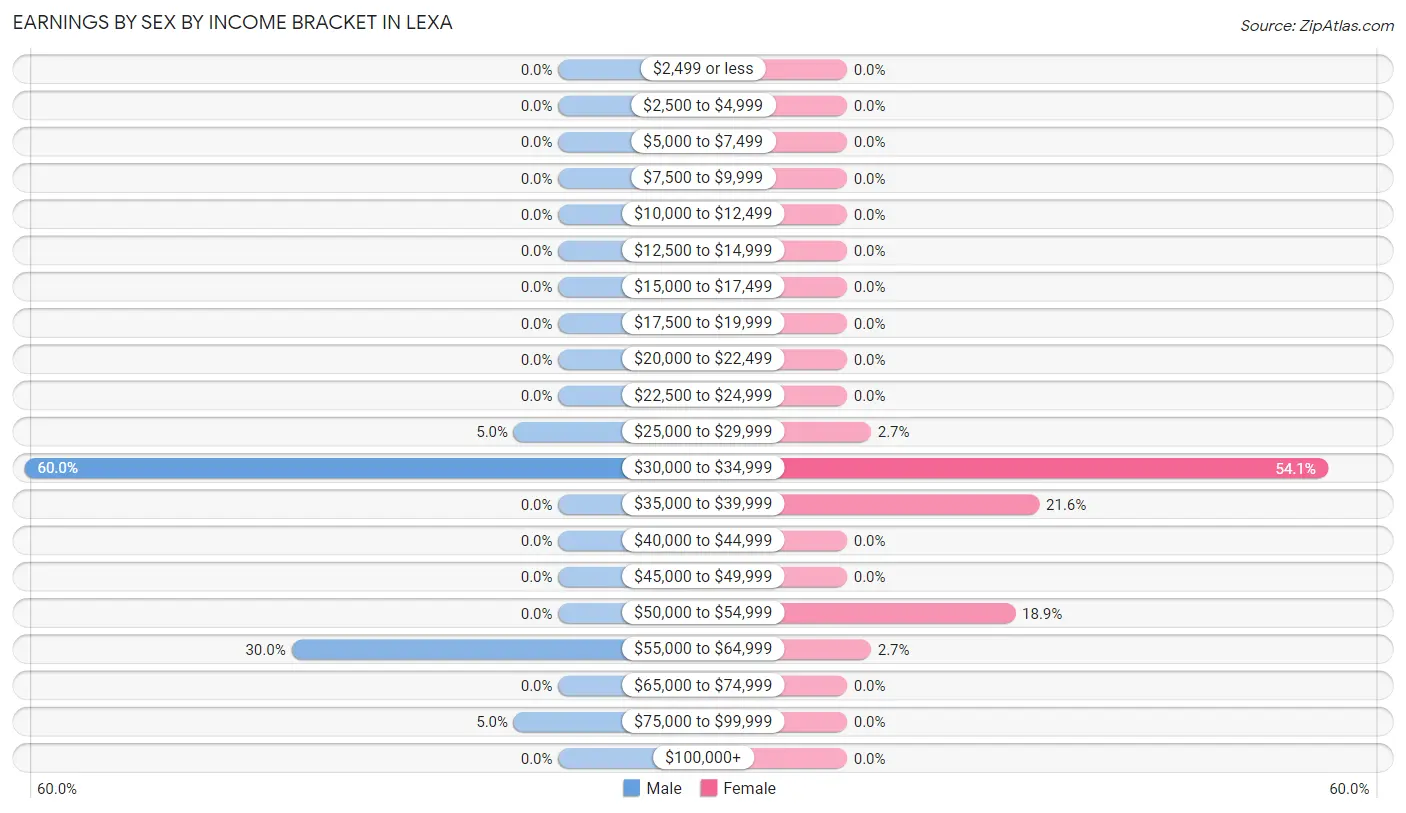
Earnings by Sex by Income Bracket in Lexa
The most common earnings brackets in Lexa are $30,000 to $34,999 for men (12 | 60.0%) and $30,000 to $34,999 for women (20 | 54.0%).
| Income | Male | Female |
| $2,499 or less | 0 (0.0%) | 0 (0.0%) |
| $2,500 to $4,999 | 0 (0.0%) | 0 (0.0%) |
| $5,000 to $7,499 | 0 (0.0%) | 0 (0.0%) |
| $7,500 to $9,999 | 0 (0.0%) | 0 (0.0%) |
| $10,000 to $12,499 | 0 (0.0%) | 0 (0.0%) |
| $12,500 to $14,999 | 0 (0.0%) | 0 (0.0%) |
| $15,000 to $17,499 | 0 (0.0%) | 0 (0.0%) |
| $17,500 to $19,999 | 0 (0.0%) | 0 (0.0%) |
| $20,000 to $22,499 | 0 (0.0%) | 0 (0.0%) |
| $22,500 to $24,999 | 0 (0.0%) | 0 (0.0%) |
| $25,000 to $29,999 | 1 (5.0%) | 1 (2.7%) |
| $30,000 to $34,999 | 12 (60.0%) | 20 (54.0%) |
| $35,000 to $39,999 | 0 (0.0%) | 8 (21.6%) |
| $40,000 to $44,999 | 0 (0.0%) | 0 (0.0%) |
| $45,000 to $49,999 | 0 (0.0%) | 0 (0.0%) |
| $50,000 to $54,999 | 0 (0.0%) | 7 (18.9%) |
| $55,000 to $64,999 | 6 (30.0%) | 1 (2.7%) |
| $65,000 to $74,999 | 0 (0.0%) | 0 (0.0%) |
| $75,000 to $99,999 | 1 (5.0%) | 0 (0.0%) |
| $100,000+ | 0 (0.0%) | 0 (0.0%) |
| Total | 20 (100.0%) | 37 (100.0%) |
Earnings by Sex by Educational Attainment in Lexa
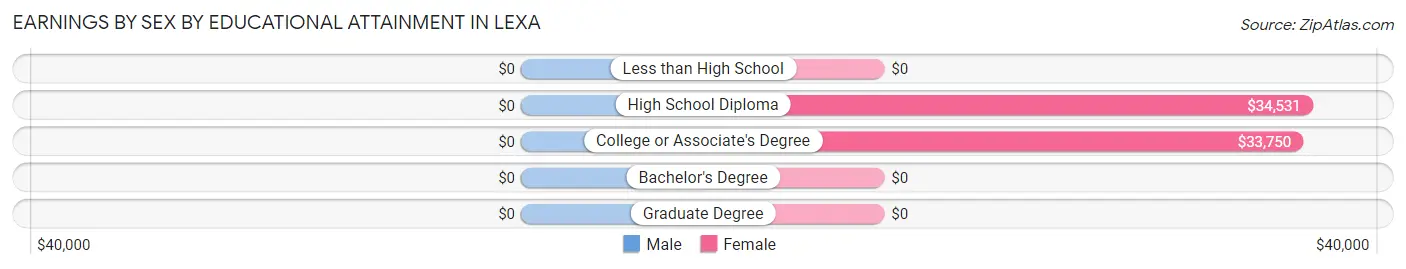
| Educational Attainment | Male Income | Female Income |
| Less than High School | - | - |
| High School Diploma | - | - |
| College or Associate's Degree | - | - |
| Bachelor's Degree | - | - |
| Graduate Degree | - | - |
| Total | - | - |
Family Income in Lexa
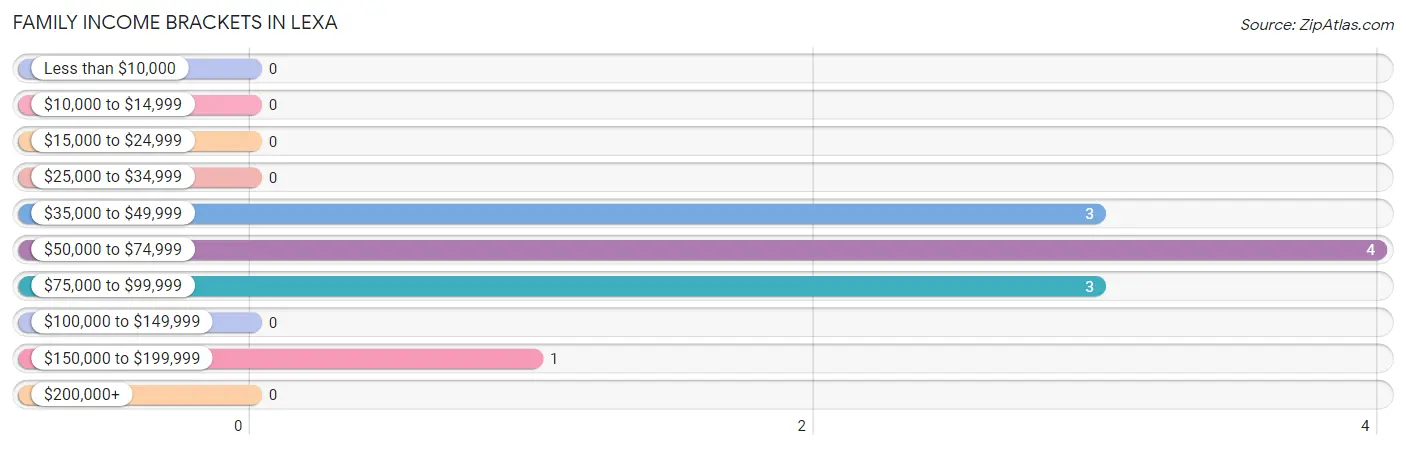
Family Income Brackets in Lexa
According to the Lexa family income data, there are 4 families falling into the $50,000 to $74,999 income range, which is the most common income bracket and makes up 36.4% of all families.
| Income Bracket | # Families | % Families |
| Less than $10,000 | 0 | 0.0% |
| $10,000 to $14,999 | 0 | 0.0% |
| $15,000 to $24,999 | 0 | 0.0% |
| $25,000 to $34,999 | 0 | 0.0% |
| $35,000 to $49,999 | 3 | 27.3% |
| $50,000 to $74,999 | 4 | 36.4% |
| $75,000 to $99,999 | 3 | 27.3% |
| $100,000 to $149,999 | 0 | 0.0% |
| $150,000 to $199,999 | 1 | 9.1% |
| $200,000+ | 0 | 0.0% |
Family Income by Famaliy Size in Lexa
| Income Bracket | # Families | Median Income |
| 2-Person Families | 2 (18.2%) | $0 |
| 3-Person Families | 6 (54.5%) | $0 |
| 4-Person Families | 3 (27.3%) | $0 |
| 5-Person Families | 0 (0.0%) | $0 |
| 6-Person Families | 0 (0.0%) | $0 |
| 7+ Person Families | 0 (0.0%) | $0 |
| Total | 11 (100.0%) | $67,083 |
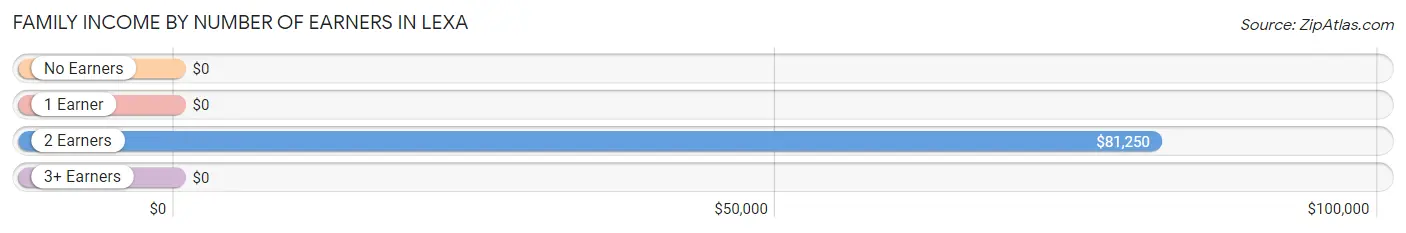
Family Income by Number of Earners in Lexa
| Number of Earners | # Families | Median Income |
| No Earners | 0 (0.0%) | $0 |
| 1 Earner | 3 (27.3%) | $0 |
| 2 Earners | 8 (72.7%) | $81,250 |
| 3+ Earners | 0 (0.0%) | $0 |
| Total | 11 (100.0%) | $67,083 |
Household Income in Lexa
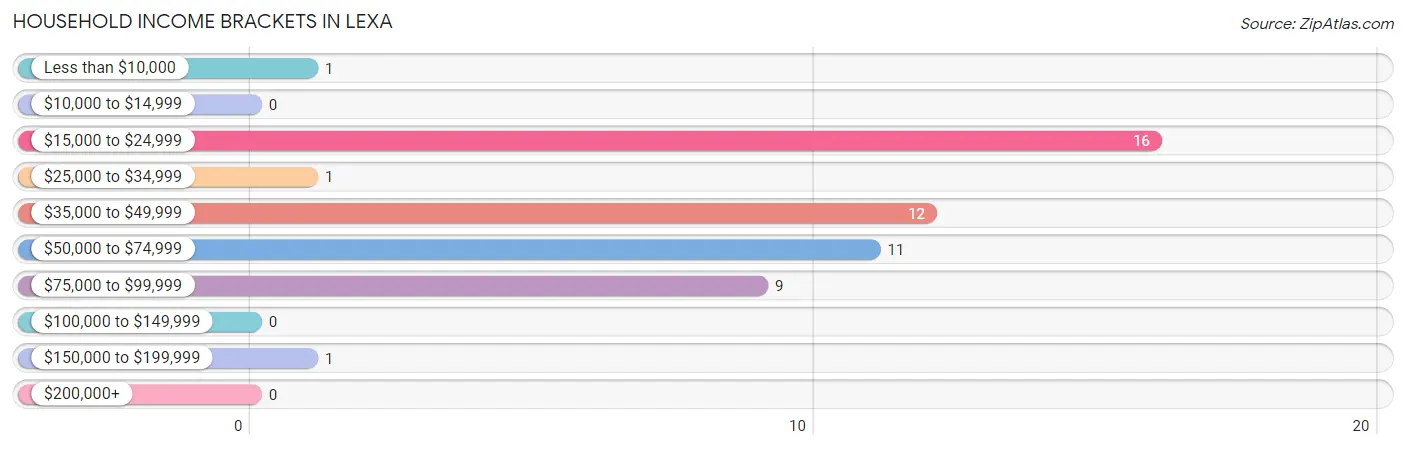
Household Income Brackets in Lexa
With 16 households falling in the category, the $15,000 to $24,999 income range is the most frequent in Lexa, accounting for 31.4% of all households.
| Income Bracket | # Households | % Households |
| Less than $10,000 | 1 | 2.0% |
| $10,000 to $14,999 | 0 | 0.0% |
| $15,000 to $24,999 | 16 | 31.4% |
| $25,000 to $34,999 | 1 | 2.0% |
| $35,000 to $49,999 | 12 | 23.5% |
| $50,000 to $74,999 | 11 | 21.6% |
| $75,000 to $99,999 | 9 | 17.6% |
| $100,000 to $149,999 | 0 | 0.0% |
| $150,000 to $199,999 | 1 | 2.0% |
| $200,000+ | 0 | 0.0% |
Household Income by Householder Age in Lexa
The median household income in Lexa is $43,750, with the highest median household income of $44,583 found in the 45 to 64 years age bracket for the primary householder. A total of 19 households (37.2%) fall into this category. Meanwhile, the 15 to 24 years age bracket for the primary householder has the lowest median household income of $0, with 1 households (2.0%) in this group.
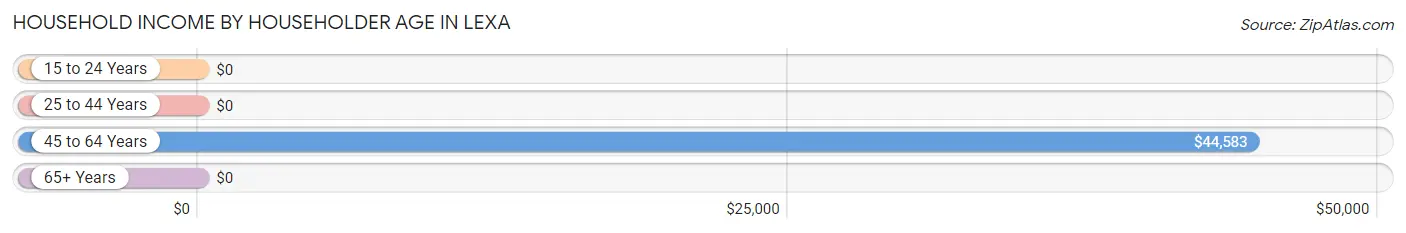
| Income Bracket | # Households | Median Income |
| 15 to 24 Years | 1 (2.0%) | $0 |
| 25 to 44 Years | 6 (11.8%) | $0 |
| 45 to 64 Years | 19 (37.2%) | $44,583 |
| 65+ Years | 25 (49.0%) | $0 |
| Total | 51 (100.0%) | $43,750 |
Poverty in Lexa
Income Below Poverty by Sex and Age in Lexa
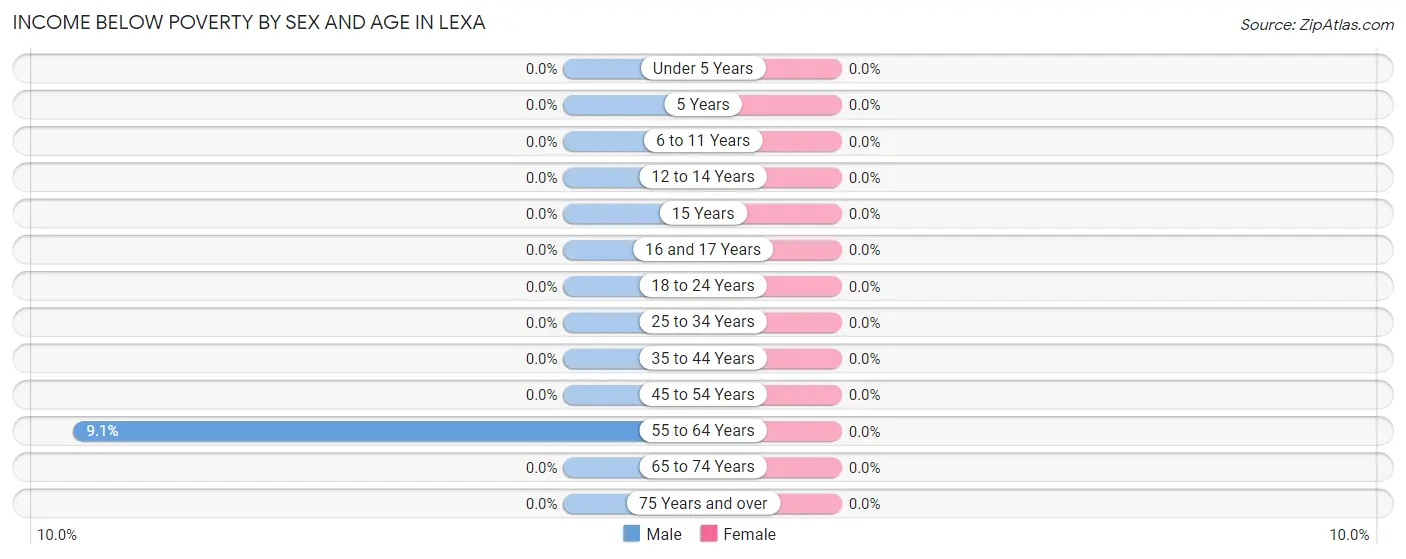
| Age Bracket | Male | Female |
| Under 5 Years | 0 (0.0%) | 0 (0.0%) |
| 5 Years | 0 (0.0%) | 0 (0.0%) |
| 6 to 11 Years | 0 (0.0%) | 0 (0.0%) |
| 12 to 14 Years | 0 (0.0%) | 0 (0.0%) |
| 15 Years | 0 (0.0%) | 0 (0.0%) |
| 16 and 17 Years | 0 (0.0%) | 0 (0.0%) |
| 18 to 24 Years | 0 (0.0%) | 0 (0.0%) |
| 25 to 34 Years | 0 (0.0%) | 0 (0.0%) |
| 35 to 44 Years | 0 (0.0%) | 0 (0.0%) |
| 45 to 54 Years | 0 (0.0%) | 0 (0.0%) |
| 55 to 64 Years | 1 (9.1%) | 0 (0.0%) |
| 65 to 74 Years | 0 (0.0%) | 0 (0.0%) |
| 75 Years and over | 0 (0.0%) | 0 (0.0%) |
| Total | 1 (2.4%) | 0 (0.0%) |
Income Above Poverty by Sex and Age in Lexa
According to the poverty statistics in Lexa, males aged 12 to 14 years and females aged 6 to 11 years are the age groups that are most secure financially, with 100.0% of males and 100.0% of females in these age groups living above the poverty line.
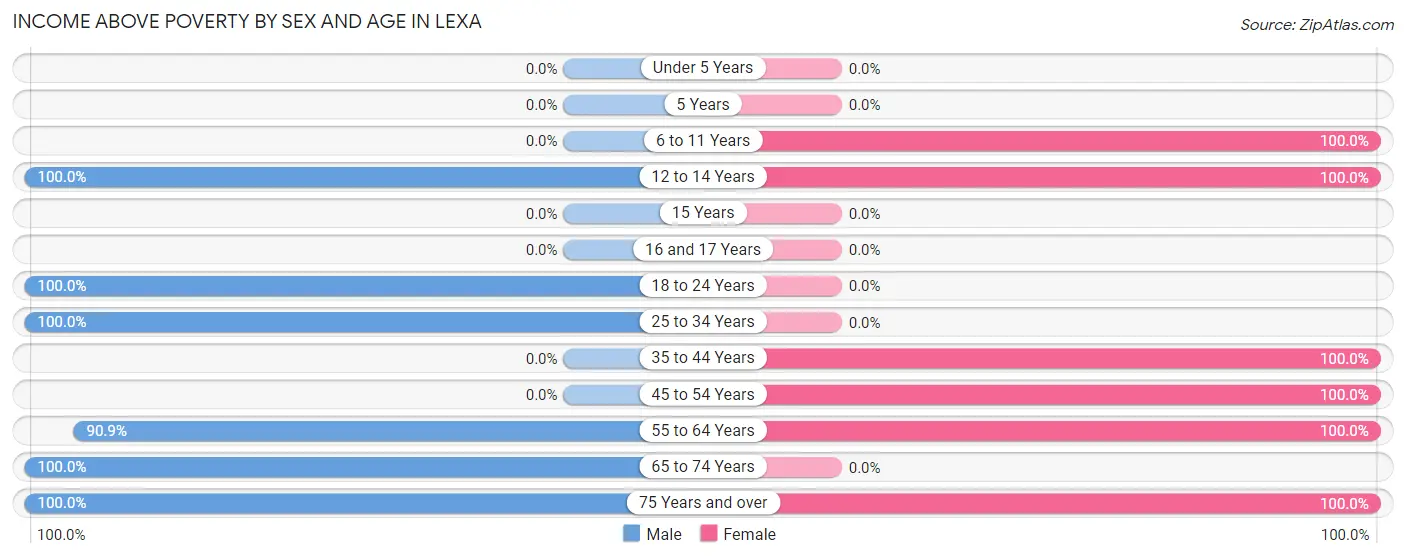
| Age Bracket | Male | Female |
| Under 5 Years | 0 (0.0%) | 0 (0.0%) |
| 5 Years | 0 (0.0%) | 0 (0.0%) |
| 6 to 11 Years | 0 (0.0%) | 7 (100.0%) |
| 12 to 14 Years | 5 (100.0%) | 3 (100.0%) |
| 15 Years | 0 (0.0%) | 0 (0.0%) |
| 16 and 17 Years | 0 (0.0%) | 0 (0.0%) |
| 18 to 24 Years | 1 (100.0%) | 0 (0.0%) |
| 25 to 34 Years | 3 (100.0%) | 0 (0.0%) |
| 35 to 44 Years | 0 (0.0%) | 6 (100.0%) |
| 45 to 54 Years | 0 (0.0%) | 16 (100.0%) |
| 55 to 64 Years | 10 (90.9%) | 15 (100.0%) |
| 65 to 74 Years | 6 (100.0%) | 0 (0.0%) |
| 75 Years and over | 16 (100.0%) | 3 (100.0%) |
| Total | 41 (97.6%) | 50 (100.0%) |
Income Below Poverty Among Married-Couple Families in Lexa
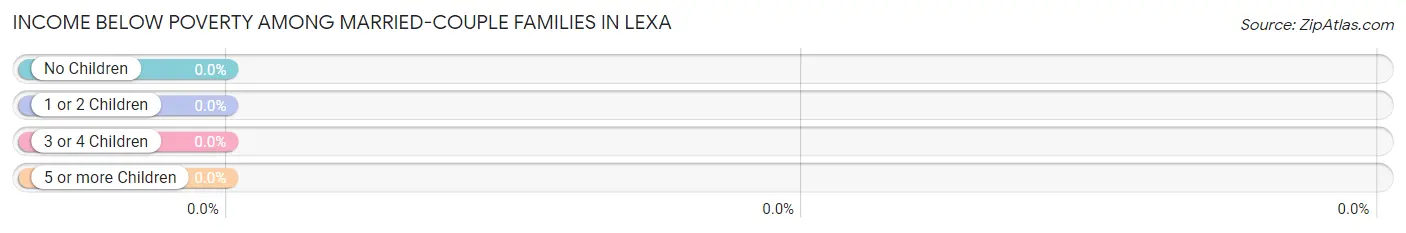
| Children | Above Poverty | Below Poverty |
| No Children | 2 (100.0%) | 0 (0.0%) |
| 1 or 2 Children | 3 (100.0%) | 0 (0.0%) |
| 3 or 4 Children | 0 (0.0%) | 0 (0.0%) |
| 5 or more Children | 0 (0.0%) | 0 (0.0%) |
| Total | 5 (100.0%) | 0 (0.0%) |
Income Below Poverty Among Single-Parent Households in Lexa
| Children | Single Father | Single Mother |
| No Children | 0 (0.0%) | 0 (0.0%) |
| 1 or 2 Children | 0 (0.0%) | 0 (0.0%) |
| 3 or 4 Children | 0 (0.0%) | 0 (0.0%) |
| 5 or more Children | 0 (0.0%) | 0 (0.0%) |
| Total | 0 (0.0%) | 0 (0.0%) |
Income Below Poverty Among Married-Couple vs Single-Parent Households in Lexa
| Children | Married-Couple Families | Single-Parent Households |
| No Children | 0 (0.0%) | 0 (0.0%) |
| 1 or 2 Children | 0 (0.0%) | 0 (0.0%) |
| 3 or 4 Children | 0 (0.0%) | 0 (0.0%) |
| 5 or more Children | 0 (0.0%) | 0 (0.0%) |
| Total | 0 (0.0%) | 0 (0.0%) |
Race in Lexa
The most populous races in Lexa are White / Caucasian (82 | 89.1%), Black / African American (9 | 9.8%), and Hispanic or Latino (6 | 6.5%).
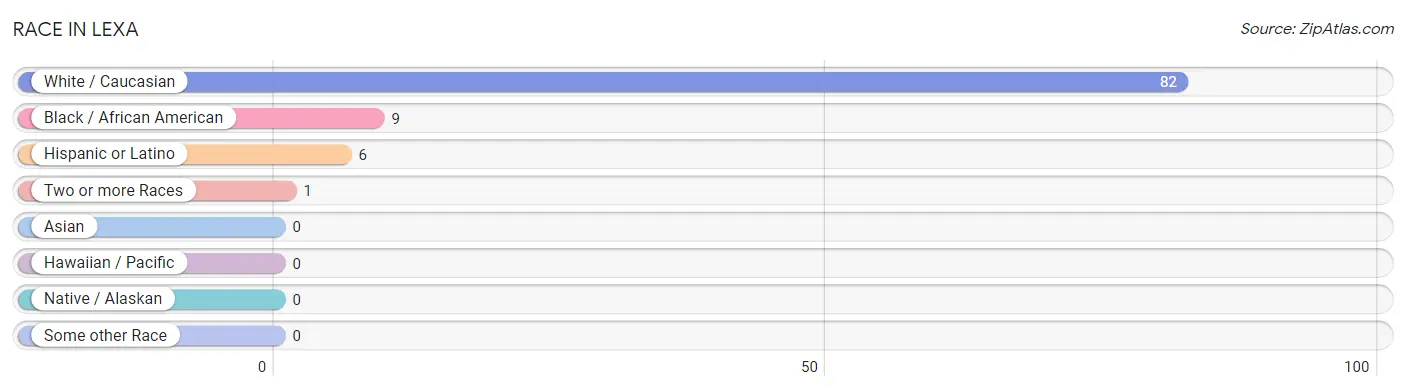
| Race | # Population | % Population |
| Asian | 0 | 0.0% |
| Black / African American | 9 | 9.8% |
| Hawaiian / Pacific | 0 | 0.0% |
| Hispanic or Latino | 6 | 6.5% |
| Native / Alaskan | 0 | 0.0% |
| White / Caucasian | 82 | 89.1% |
| Two or more Races | 1 | 1.1% |
| Some other Race | 0 | 0.0% |
| Total | 92 | 100.0% |
Ancestry in Lexa
The most populous ancestries reported in Lexa are Irish (25 | 27.2%), German (8 | 8.7%), American (1 | 1.1%), Dutch (1 | 1.1%), and English (1 | 1.1%), together accounting for 39.1% of all Lexa residents.
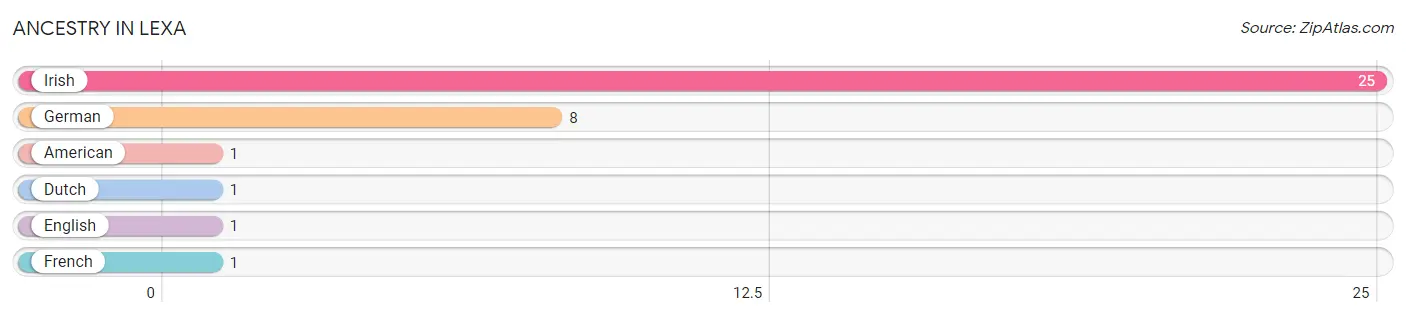
| Ancestry | # Population | % Population |
| American | 1 | 1.1% |
| Dutch | 1 | 1.1% |
| English | 1 | 1.1% |
| French | 1 | 1.1% |
| German | 8 | 8.7% |
| Irish | 25 | 27.2% | View All 6 Rows |
Immigrants in Lexa
The most numerous immigrant groups reported in Lexa came from Central America (1 | 1.1%), El Salvador (1 | 1.1%), and Latin America (1 | 1.1%), together accounting for 3.3% of all Lexa residents.
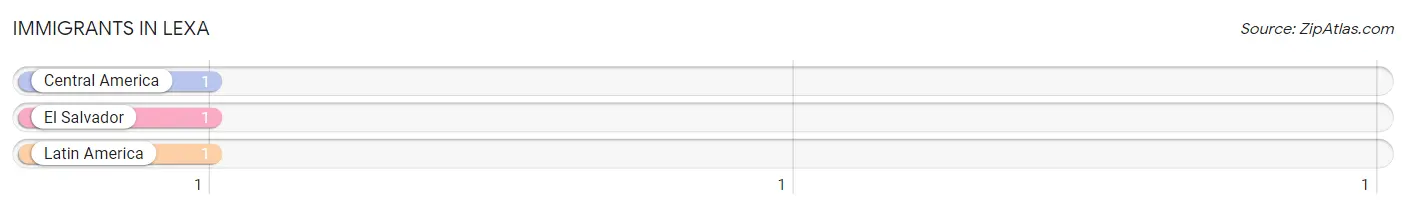
| Immigration Origin | # Population | % Population |
| Central America | 1 | 1.1% |
| El Salvador | 1 | 1.1% |
| Latin America | 1 | 1.1% | View All 3 Rows |
Sex and Age in Lexa
Sex and Age in Lexa
The most populous age groups in Lexa are 85 Years and over (16 | 38.1%) for men and 10 to 14 Years (10 | 20.0%) for women.
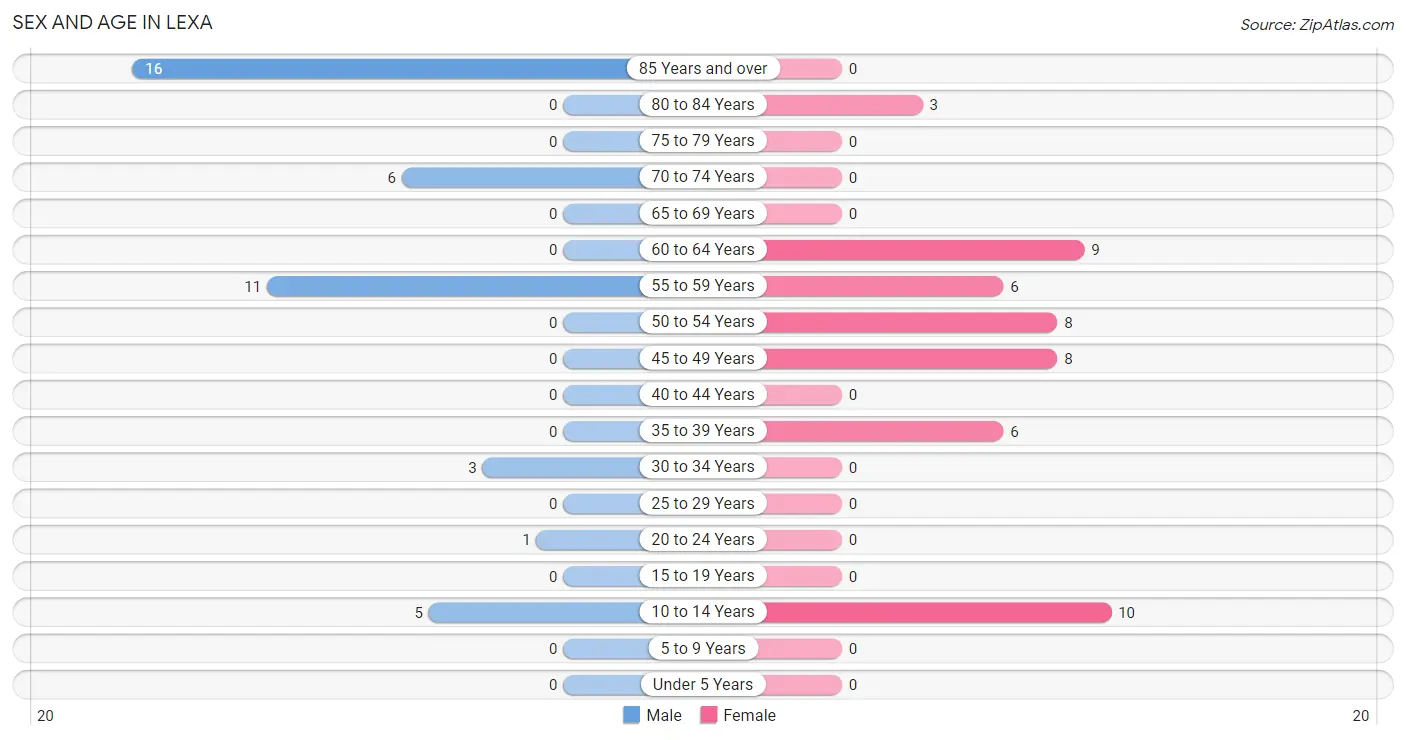
| Age Bracket | Male | Female |
| Under 5 Years | 0 (0.0%) | 0 (0.0%) |
| 5 to 9 Years | 0 (0.0%) | 0 (0.0%) |
| 10 to 14 Years | 5 (11.9%) | 10 (20.0%) |
| 15 to 19 Years | 0 (0.0%) | 0 (0.0%) |
| 20 to 24 Years | 1 (2.4%) | 0 (0.0%) |
| 25 to 29 Years | 0 (0.0%) | 0 (0.0%) |
| 30 to 34 Years | 3 (7.1%) | 0 (0.0%) |
| 35 to 39 Years | 0 (0.0%) | 6 (12.0%) |
| 40 to 44 Years | 0 (0.0%) | 0 (0.0%) |
| 45 to 49 Years | 0 (0.0%) | 8 (16.0%) |
| 50 to 54 Years | 0 (0.0%) | 8 (16.0%) |
| 55 to 59 Years | 11 (26.2%) | 6 (12.0%) |
| 60 to 64 Years | 0 (0.0%) | 9 (18.0%) |
| 65 to 69 Years | 0 (0.0%) | 0 (0.0%) |
| 70 to 74 Years | 6 (14.3%) | 0 (0.0%) |
| 75 to 79 Years | 0 (0.0%) | 0 (0.0%) |
| 80 to 84 Years | 0 (0.0%) | 3 (6.0%) |
| 85 Years and over | 16 (38.1%) | 0 (0.0%) |
| Total | 42 (100.0%) | 50 (100.0%) |
Families and Households in Lexa
Median Family Size in Lexa
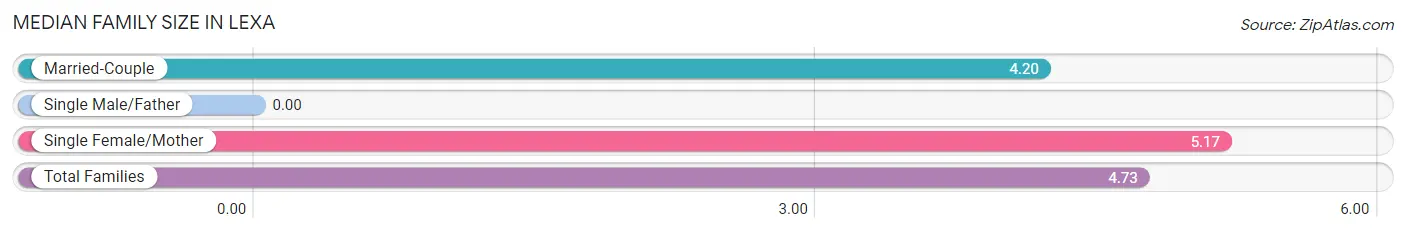
| Family Type | # Families | Family Size |
| Married-Couple | 5 (45.5%) | 4.20 |
| Single Male/Father | 0 (0.0%) | - |
| Single Female/Mother | 6 (54.5%) | 5.17 |
| Total Families | 11 (100.0%) | 4.73 |
Median Household Size in Lexa
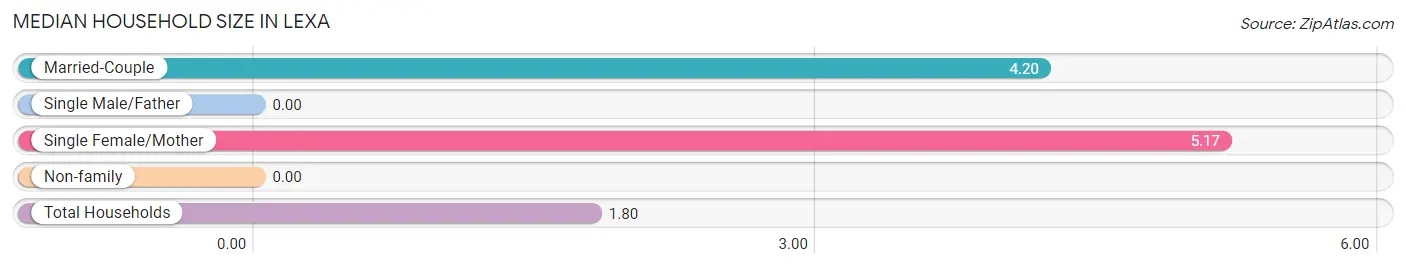
| Household Type | # Households | Household Size |
| Married-Couple | 5 (9.8%) | 4.20 |
| Single Male/Father | 0 (0.0%) | - |
| Single Female/Mother | 6 (11.8%) | 5.17 |
| Non-family | 40 (78.4%) | - |
| Total Households | 51 (100.0%) | 1.80 |
Household Size by Marriage Status in Lexa
Out of a total of 51 households in Lexa, 11 (21.6%) are family households, while 40 (78.4%) are nonfamily households. The most numerous type of family households are 3-person households, comprising 6, and the most common type of nonfamily households are 1-person households, comprising 40.
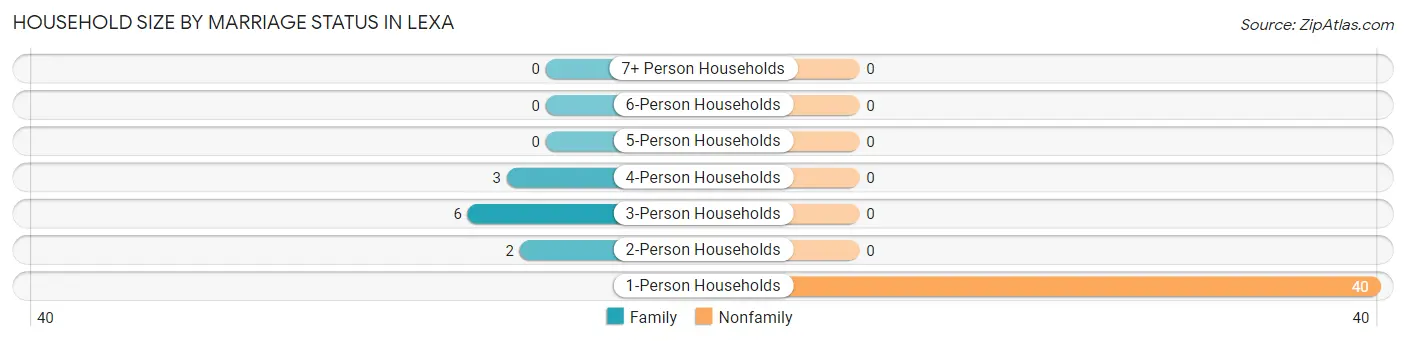
| Household Size | Family Households | Nonfamily Households |
| 1-Person Households | - | 40 (78.4%) |
| 2-Person Households | 2 (3.9%) | 0 (0.0%) |
| 3-Person Households | 6 (11.8%) | 0 (0.0%) |
| 4-Person Households | 3 (5.9%) | 0 (0.0%) |
| 5-Person Households | 0 (0.0%) | 0 (0.0%) |
| 6-Person Households | 0 (0.0%) | 0 (0.0%) |
| 7+ Person Households | 0 (0.0%) | 0 (0.0%) |
| Total | 11 (21.6%) | 40 (78.4%) |
Female Fertility in Lexa
Fertility by Age in Lexa
| Age Bracket | Women with Births | Births / 1,000 Women |
| 15 to 19 years | 0 (0.0%) | 0.0 |
| 20 to 34 years | 0 (0.0%) | 0.0 |
| 35 to 50 years | 0 (0.0%) | 0.0 |
| Total | 0 (0.0%) | 0.0 |
Fertility by Age by Marriage Status in Lexa
| Age Bracket | Married | Unmarried |
| 15 to 19 years | 0 (0.0%) | 0 (0.0%) |
| 20 to 34 years | 0 (0.0%) | 0 (0.0%) |
| 35 to 50 years | 0 (0.0%) | 0 (0.0%) |
| Total | 0 (0.0%) | 0 (0.0%) |
Fertility by Education in Lexa
| Educational Attainment | Women with Births | Births / 1,000 Women |
| Less than High School | 0 (0.0%) | 0.0 |
| High School Diploma | 0 (0.0%) | 0.0 |
| College or Associate's Degree | 0 (0.0%) | 0.0 |
| Bachelor's Degree | 0 (0.0%) | 0.0 |
| Graduate Degree | 0 (0.0%) | 0.0 |
| Total | 0 (0.0%) | 0.0 |
Fertility by Education by Marriage Status in Lexa
| Educational Attainment | Married | Unmarried |
| Less than High School | 0 (0.0%) | 0 (0.0%) |
| High School Diploma | 0 (0.0%) | 0 (0.0%) |
| College or Associate's Degree | 0 (0.0%) | 0 (0.0%) |
| Bachelor's Degree | 0 (0.0%) | 0 (0.0%) |
| Graduate Degree | 0 (0.0%) | 0 (0.0%) |
| Total | 0 (0.0%) | 0 (0.0%) |
Employment Characteristics in Lexa
Employment by Class of Employer in Lexa
Among the 51 employed individuals in Lexa, private company employees (47 | 92.2%), and state government employees (4 | 7.8%) make up the most common classes of employment.
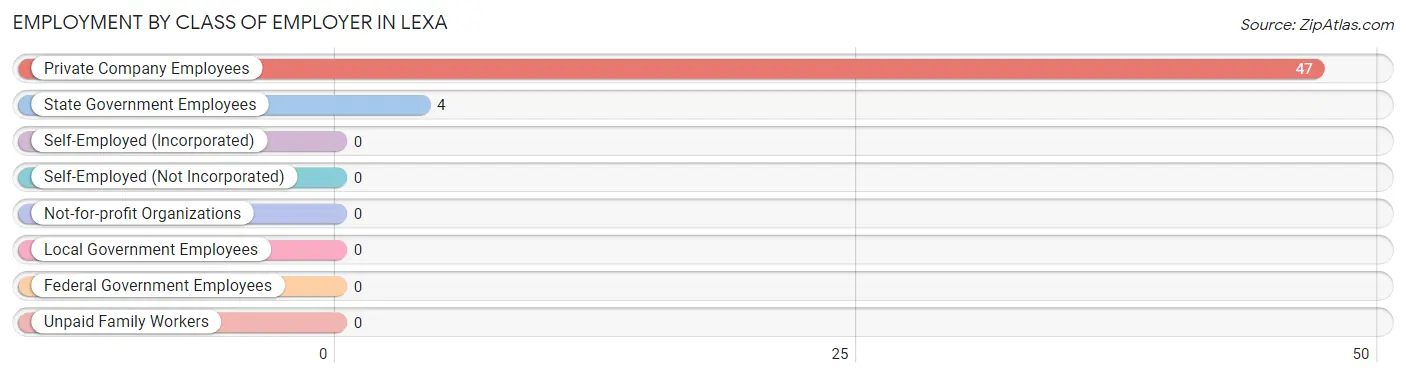
| Employer Class | # Employees | % Employees |
| Private Company Employees | 47 | 92.2% |
| Self-Employed (Incorporated) | 0 | 0.0% |
| Self-Employed (Not Incorporated) | 0 | 0.0% |
| Not-for-profit Organizations | 0 | 0.0% |
| Local Government Employees | 0 | 0.0% |
| State Government Employees | 4 | 7.8% |
| Federal Government Employees | 0 | 0.0% |
| Unpaid Family Workers | 0 | 0.0% |
| Total | 51 | 100.0% |
Employment Status by Age in Lexa
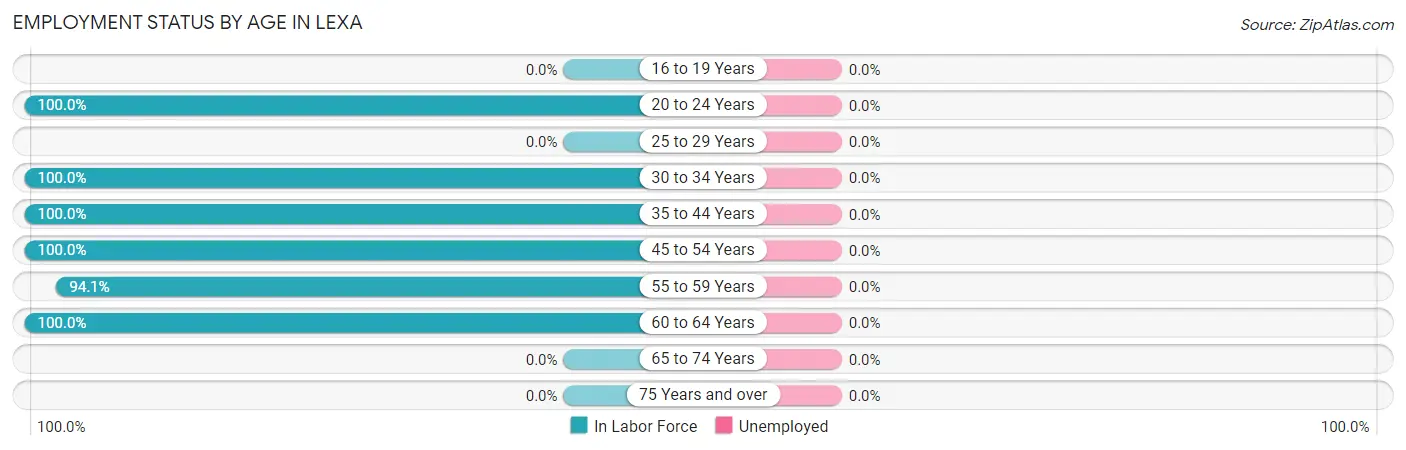
| Age Bracket | In Labor Force | Unemployed |
| 16 to 19 Years | 0 (0.0%) | 0 (0.0%) |
| 20 to 24 Years | 1 (100.0%) | 0 (0.0%) |
| 25 to 29 Years | 0 (0.0%) | 0 (0.0%) |
| 30 to 34 Years | 3 (100.0%) | 0 (0.0%) |
| 35 to 44 Years | 6 (100.0%) | 0 (0.0%) |
| 45 to 54 Years | 16 (100.0%) | 0 (0.0%) |
| 55 to 59 Years | 16 (94.1%) | 0 (0.0%) |
| 60 to 64 Years | 9 (100.0%) | 0 (0.0%) |
| 65 to 74 Years | 0 (0.0%) | 0 (0.0%) |
| 75 Years and over | 0 (0.0%) | 0 (0.0%) |
| Total | 51 (66.2%) | 0 (0.0%) |
Employment Status by Educational Attainment in Lexa
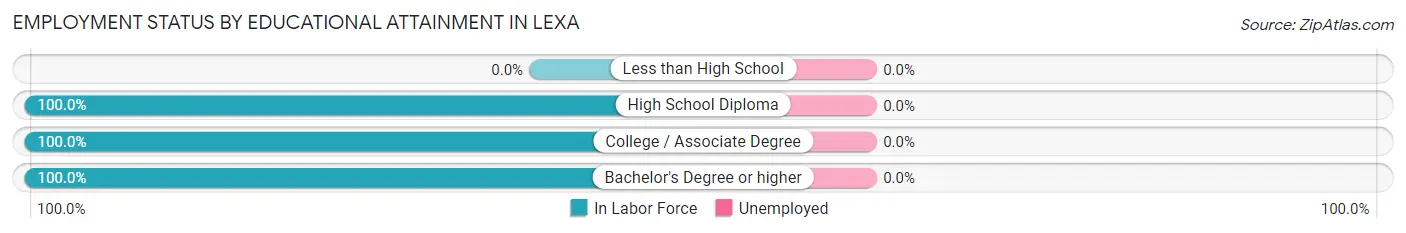
| Educational Attainment | In Labor Force | Unemployed |
| Less than High School | 0 (0.0%) | 0 (0.0%) |
| High School Diploma | 23 (100.0%) | 0 (0.0%) |
| College / Associate Degree | 20 (100.0%) | 0 (0.0%) |
| Bachelor's Degree or higher | 7 (100.0%) | 0 (0.0%) |
| Total | 50 (98.0%) | 0 (0.0%) |
Employment Occupations by Sex in Lexa
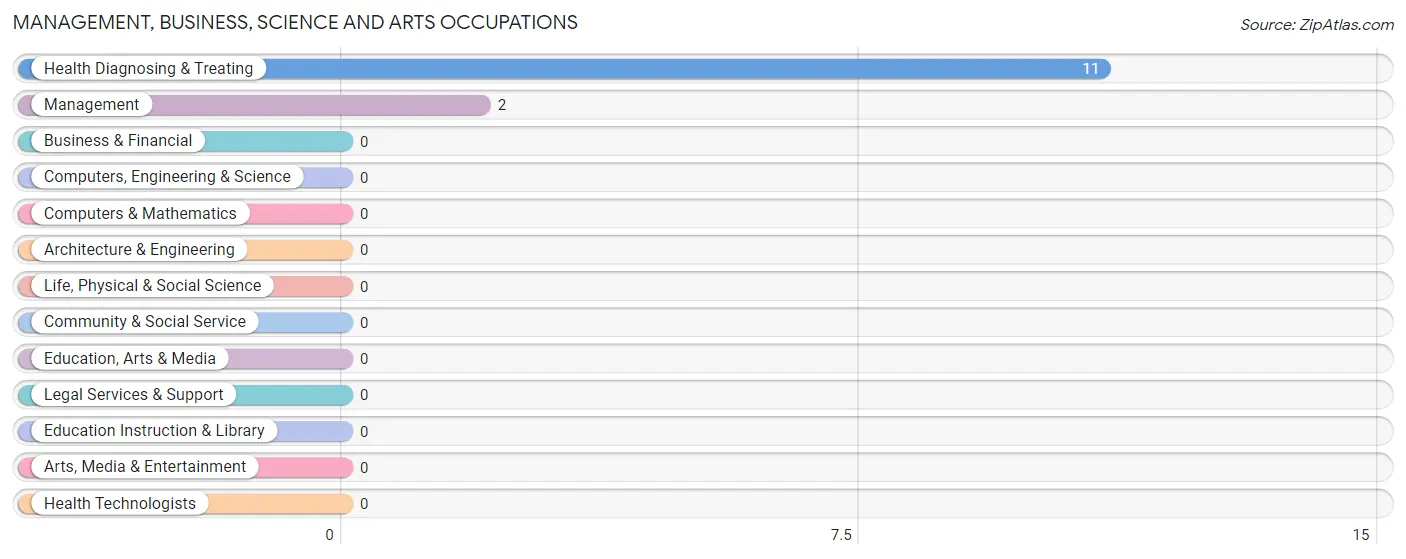
Management, Business, Science and Arts Occupations
The most common Management, Business, Science and Arts occupations in Lexa are Health Diagnosing & Treating (11 | 21.6%), and Management (2 | 3.9%).
Management, Business, Science and Arts Occupations by Sex
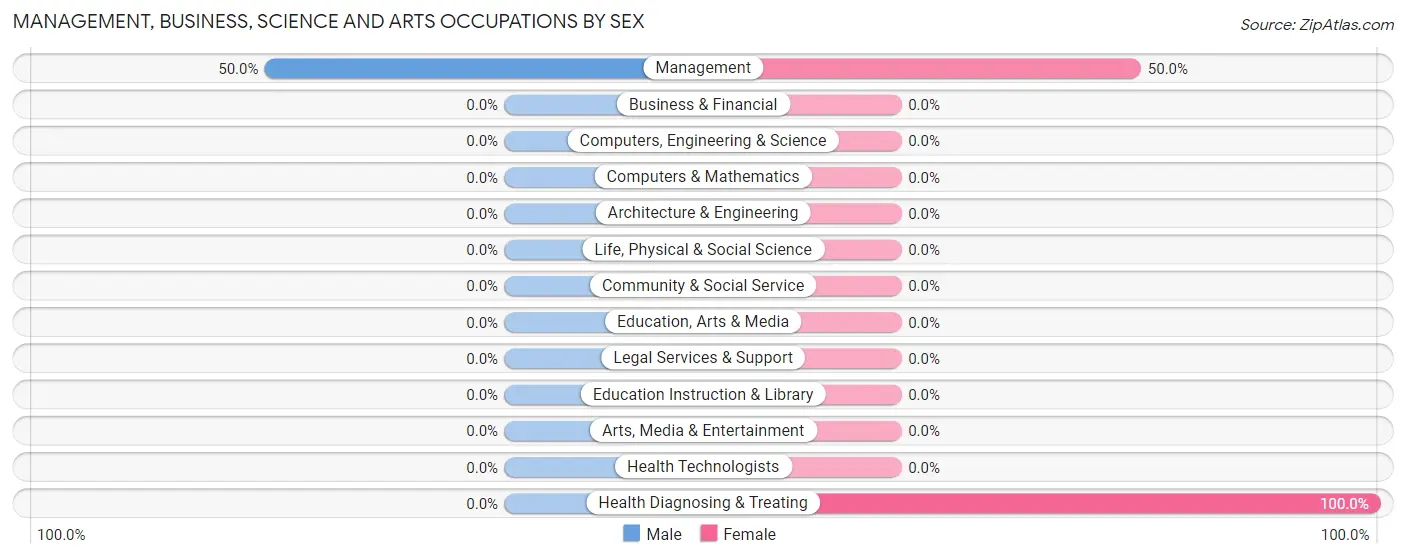
| Occupation | Male | Female |
| Management | 1 (50.0%) | 1 (50.0%) |
| Business & Financial | 0 (0.0%) | 0 (0.0%) |
| Computers, Engineering & Science | 0 (0.0%) | 0 (0.0%) |
| Computers & Mathematics | 0 (0.0%) | 0 (0.0%) |
| Architecture & Engineering | 0 (0.0%) | 0 (0.0%) |
| Life, Physical & Social Science | 0 (0.0%) | 0 (0.0%) |
| Community & Social Service | 0 (0.0%) | 0 (0.0%) |
| Education, Arts & Media | 0 (0.0%) | 0 (0.0%) |
| Legal Services & Support | 0 (0.0%) | 0 (0.0%) |
| Education Instruction & Library | 0 (0.0%) | 0 (0.0%) |
| Arts, Media & Entertainment | 0 (0.0%) | 0 (0.0%) |
| Health Diagnosing & Treating | 0 (0.0%) | 11 (100.0%) |
| Health Technologists | 0 (0.0%) | 0 (0.0%) |
| Total (Category) | 1 (7.7%) | 12 (92.3%) |
| Total (Overall) | 14 (27.5%) | 37 (72.6%) |
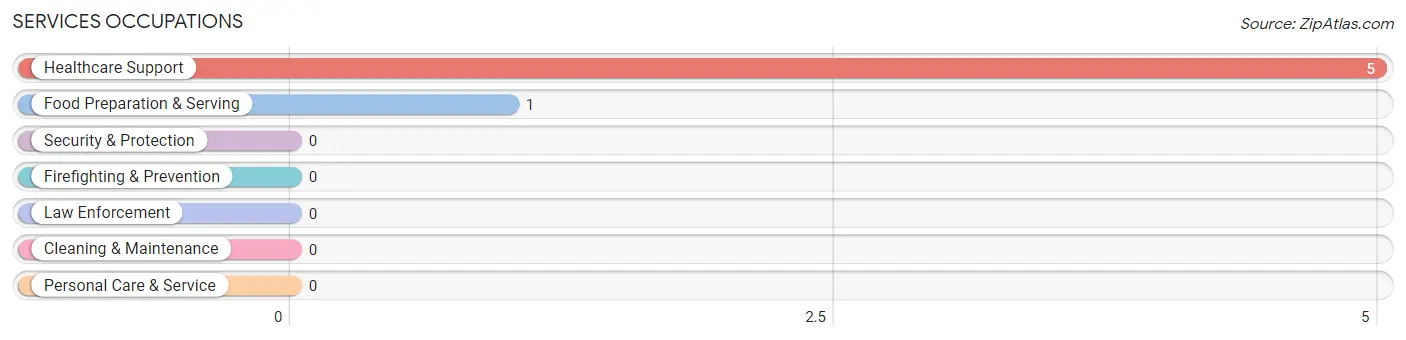
Services Occupations
The most common Services occupations in Lexa are Healthcare Support (5 | 9.8%), and Food Preparation & Serving (1 | 2.0%).
Services Occupations by Sex
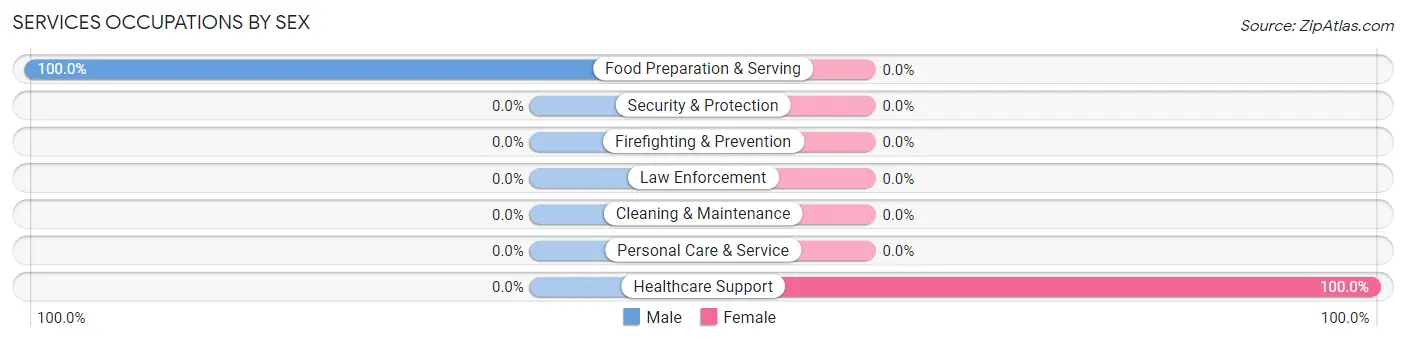
| Occupation | Male | Female |
| Healthcare Support | 0 (0.0%) | 5 (100.0%) |
| Security & Protection | 0 (0.0%) | 0 (0.0%) |
| Firefighting & Prevention | 0 (0.0%) | 0 (0.0%) |
| Law Enforcement | 0 (0.0%) | 0 (0.0%) |
| Food Preparation & Serving | 1 (100.0%) | 0 (0.0%) |
| Cleaning & Maintenance | 0 (0.0%) | 0 (0.0%) |
| Personal Care & Service | 0 (0.0%) | 0 (0.0%) |
| Total (Category) | 1 (16.7%) | 5 (83.3%) |
| Total (Overall) | 14 (27.5%) | 37 (72.6%) |
Sales and Office Occupations
The most common Sales and Office occupations in Lexa are Sales & Related (8 | 15.7%), and Office & Administration (3 | 5.9%).
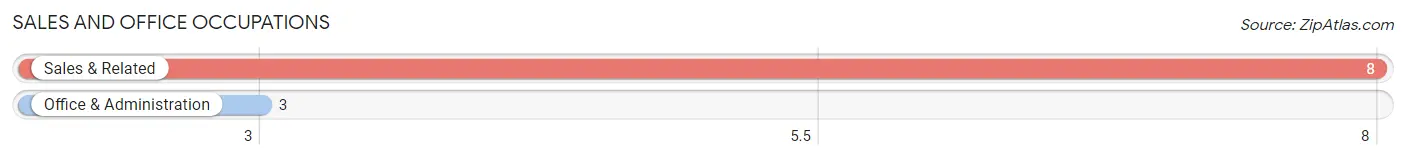
Sales and Office Occupations by Sex
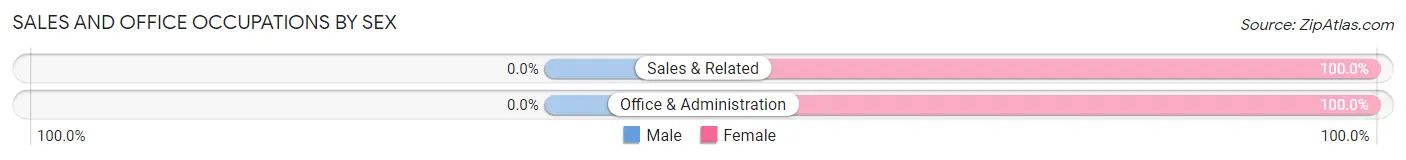
| Occupation | Male | Female |
| Sales & Related | 0 (0.0%) | 8 (100.0%) |
| Office & Administration | 0 (0.0%) | 3 (100.0%) |
| Total (Category) | 0 (0.0%) | 11 (100.0%) |
| Total (Overall) | 14 (27.5%) | 37 (72.6%) |
Natural Resources, Construction and Maintenance Occupations
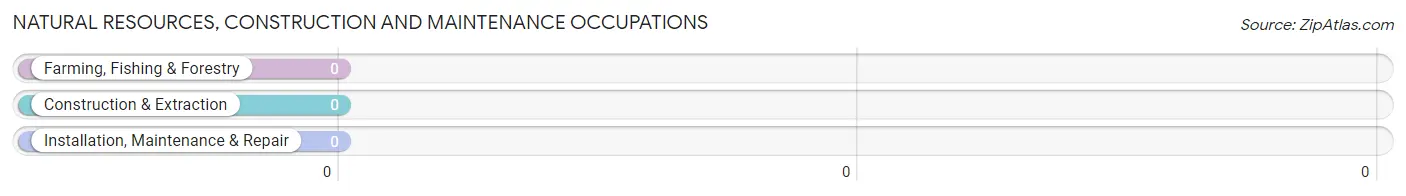
Natural Resources, Construction and Maintenance Occupations by Sex
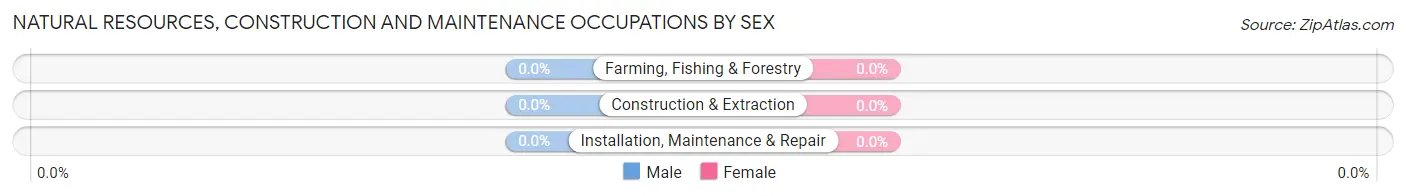
| Occupation | Male | Female |
| Farming, Fishing & Forestry | 0 (0.0%) | 0 (0.0%) |
| Construction & Extraction | 0 (0.0%) | 0 (0.0%) |
| Installation, Maintenance & Repair | 0 (0.0%) | 0 (0.0%) |
| Total (Category) | 0 (0.0%) | 0 (0.0%) |
| Total (Overall) | 14 (27.5%) | 37 (72.6%) |
Production, Transportation and Moving Occupations
The most common Production, Transportation and Moving occupations in Lexa are Production (12 | 23.5%), and Material Moving (9 | 17.6%).
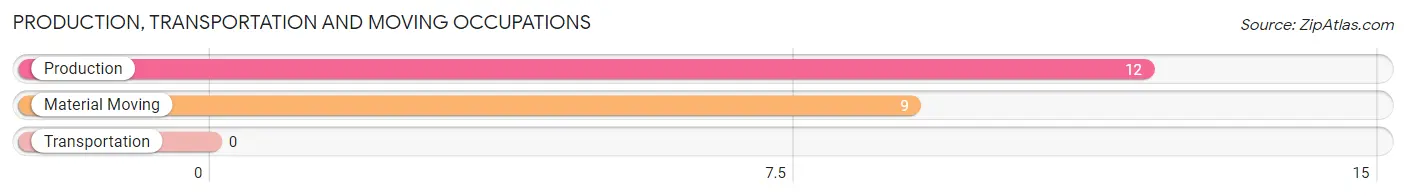
Production, Transportation and Moving Occupations by Sex
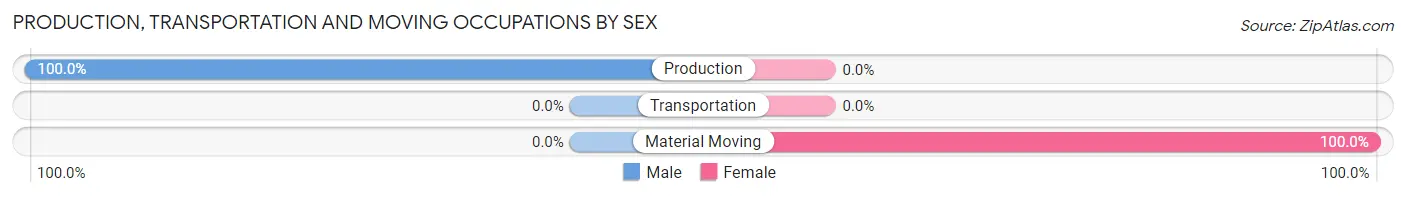
| Occupation | Male | Female |
| Production | 12 (100.0%) | 0 (0.0%) |
| Transportation | 0 (0.0%) | 0 (0.0%) |
| Material Moving | 0 (0.0%) | 9 (100.0%) |
| Total (Category) | 12 (57.1%) | 9 (42.9%) |
| Total (Overall) | 14 (27.5%) | 37 (72.6%) |
Employment Industries by Sex in Lexa
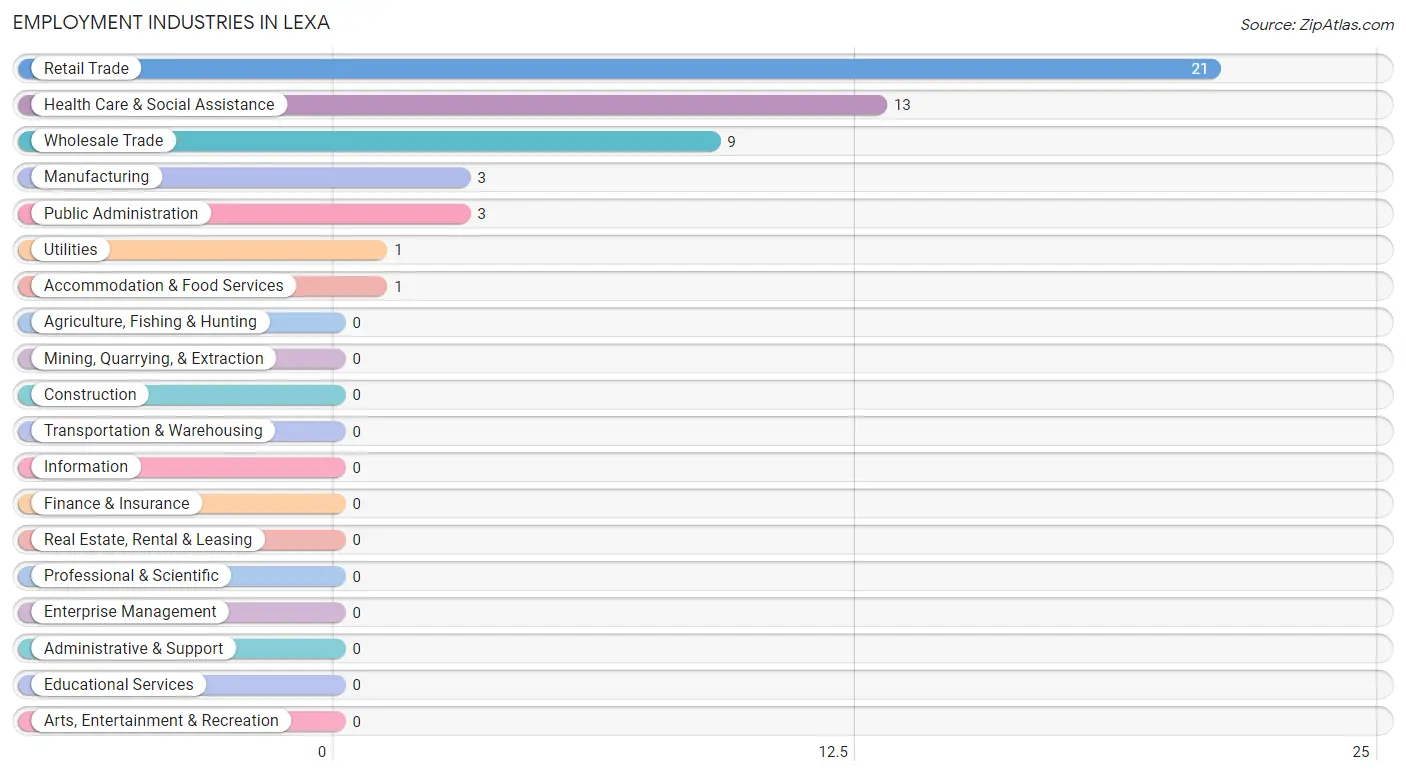
Employment Industries in Lexa
The major employment industries in Lexa include Retail Trade (21 | 41.2%), Health Care & Social Assistance (13 | 25.5%), Wholesale Trade (9 | 17.6%), Manufacturing (3 | 5.9%), and Public Administration (3 | 5.9%).
Employment Industries by Sex in Lexa
The Lexa industries that see more men than women are Manufacturing (100.0%), Wholesale Trade (100.0%), and Accommodation & Food Services (100.0%), whereas the industries that tend to have a higher number of women are Utilities (100.0%), Health Care & Social Assistance (100.0%), and Public Administration (100.0%).
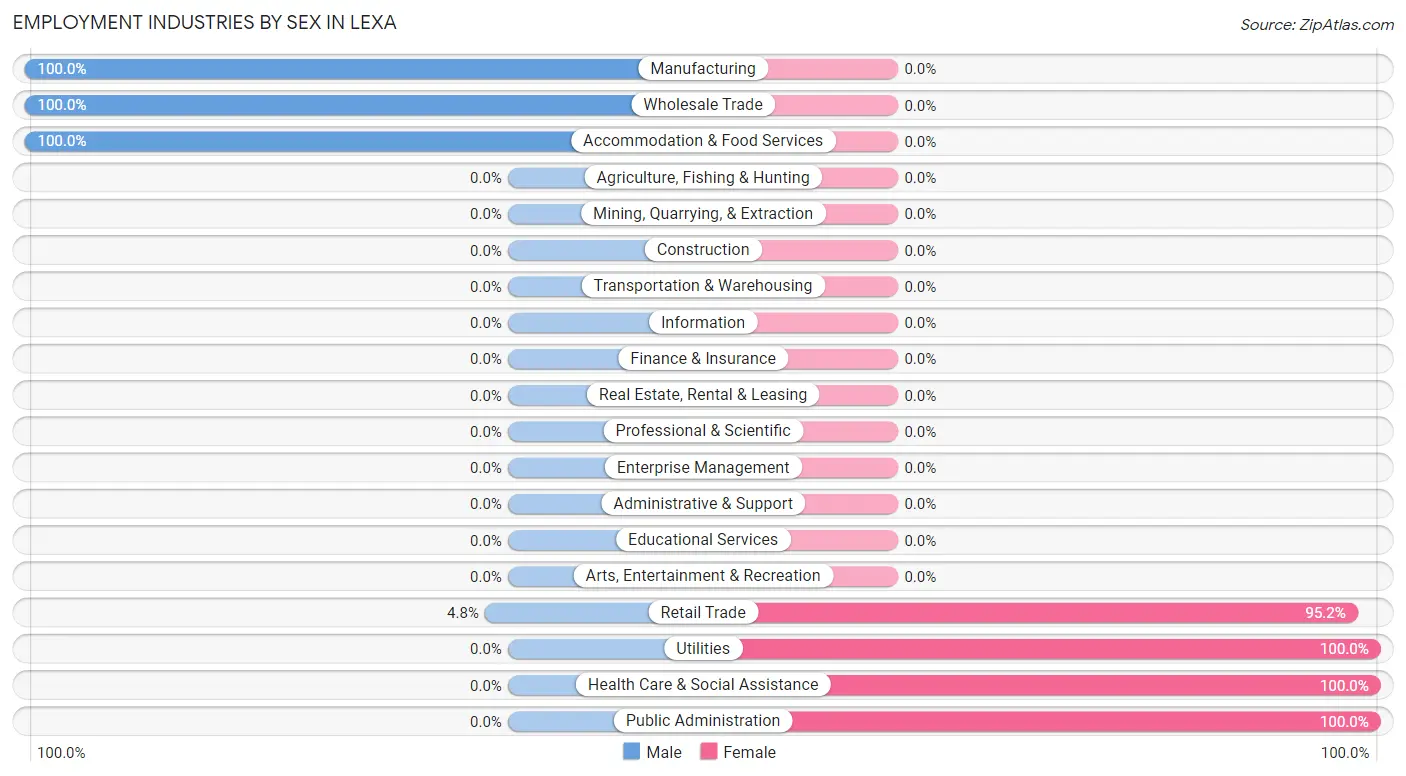
| Industry | Male | Female |
| Agriculture, Fishing & Hunting | 0 (0.0%) | 0 (0.0%) |
| Mining, Quarrying, & Extraction | 0 (0.0%) | 0 (0.0%) |
| Construction | 0 (0.0%) | 0 (0.0%) |
| Manufacturing | 3 (100.0%) | 0 (0.0%) |
| Wholesale Trade | 9 (100.0%) | 0 (0.0%) |
| Retail Trade | 1 (4.8%) | 20 (95.2%) |
| Transportation & Warehousing | 0 (0.0%) | 0 (0.0%) |
| Utilities | 0 (0.0%) | 1 (100.0%) |
| Information | 0 (0.0%) | 0 (0.0%) |
| Finance & Insurance | 0 (0.0%) | 0 (0.0%) |
| Real Estate, Rental & Leasing | 0 (0.0%) | 0 (0.0%) |
| Professional & Scientific | 0 (0.0%) | 0 (0.0%) |
| Enterprise Management | 0 (0.0%) | 0 (0.0%) |
| Administrative & Support | 0 (0.0%) | 0 (0.0%) |
| Educational Services | 0 (0.0%) | 0 (0.0%) |
| Health Care & Social Assistance | 0 (0.0%) | 13 (100.0%) |
| Arts, Entertainment & Recreation | 0 (0.0%) | 0 (0.0%) |
| Accommodation & Food Services | 1 (100.0%) | 0 (0.0%) |
| Public Administration | 0 (0.0%) | 3 (100.0%) |
| Total | 14 (27.5%) | 37 (72.6%) |
Education in Lexa
School Enrollment in Lexa
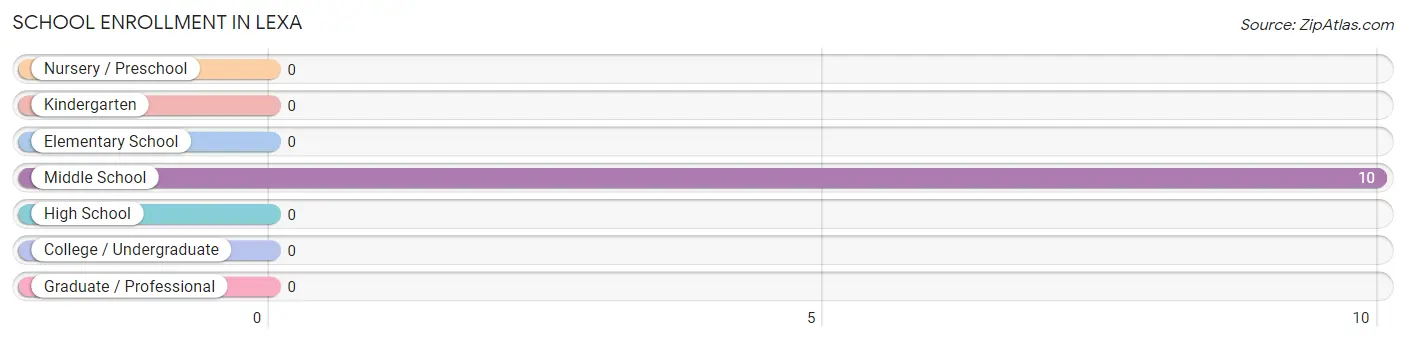
| School Level | # Students | % Students |
| Nursery / Preschool | 0 | 0.0% |
| Kindergarten | 0 | 0.0% |
| Elementary School | 0 | 0.0% |
| Middle School | 10 | 100.0% |
| High School | 0 | 0.0% |
| College / Undergraduate | 0 | 0.0% |
| Graduate / Professional | 0 | 0.0% |
| Total | 10 | 100.0% |
School Enrollment by Age by Funding Source in Lexa
Out of a total of 10 students who are enrolled in schools in Lexa, 3 (30.0%) attend a private institution, while the remaining 7 (70.0%) are enrolled in public schools. The age group of 10 to 14 year olds has the highest likelihood of being enrolled in private schools, with 3 (30.0% in the age bracket) enrolled. Conversely, the age group of 10 to 14 year olds has the lowest likelihood of being enrolled in a private school, with 7 (70.0% in the age bracket) attending a public institution.
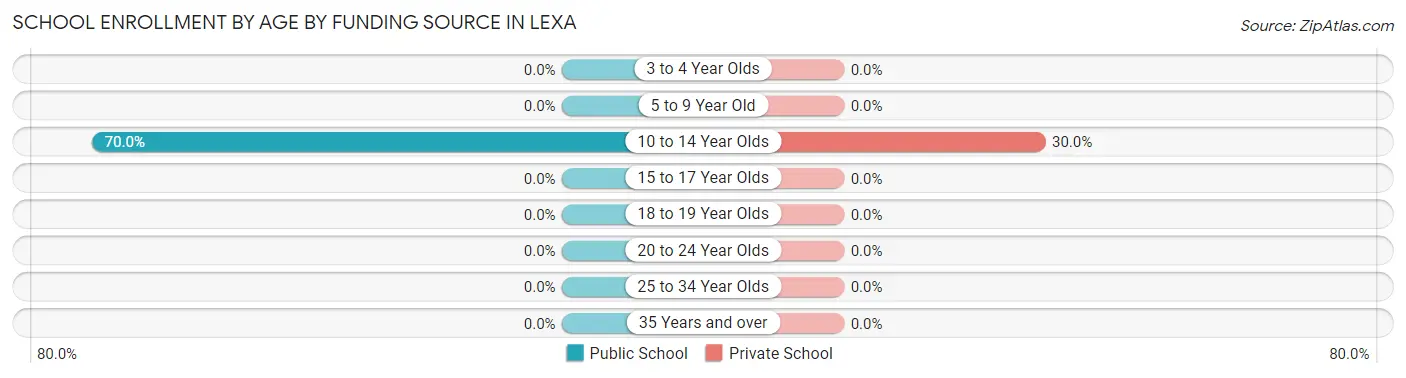
| Age Bracket | Public School | Private School |
| 3 to 4 Year Olds | 0 (0.0%) | 0 (0.0%) |
| 5 to 9 Year Old | 0 (0.0%) | 0 (0.0%) |
| 10 to 14 Year Olds | 7 (70.0%) | 3 (30.0%) |
| 15 to 17 Year Olds | 0 (0.0%) | 0 (0.0%) |
| 18 to 19 Year Olds | 0 (0.0%) | 0 (0.0%) |
| 20 to 24 Year Olds | 0 (0.0%) | 0 (0.0%) |
| 25 to 34 Year Olds | 0 (0.0%) | 0 (0.0%) |
| 35 Years and over | 0 (0.0%) | 0 (0.0%) |
| Total | 7 (70.0%) | 3 (30.0%) |
Educational Attainment by Field of Study in Lexa
, and science & technology (7 | 100.0%) are the most common fields of study among 7 individuals in Lexa who have obtained a bachelor's degree or higher.
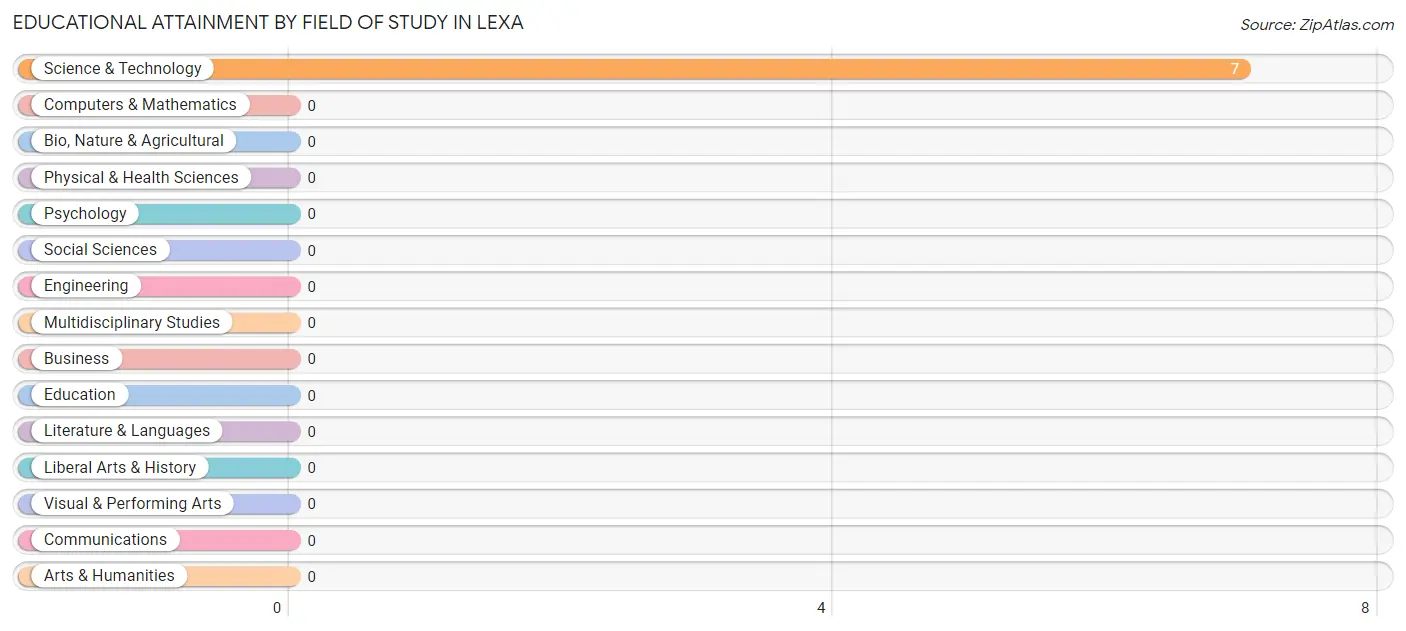
| Field of Study | # Graduates | % Graduates |
| Computers & Mathematics | 0 | 0.0% |
| Bio, Nature & Agricultural | 0 | 0.0% |
| Physical & Health Sciences | 0 | 0.0% |
| Psychology | 0 | 0.0% |
| Social Sciences | 0 | 0.0% |
| Engineering | 0 | 0.0% |
| Multidisciplinary Studies | 0 | 0.0% |
| Science & Technology | 7 | 100.0% |
| Business | 0 | 0.0% |
| Education | 0 | 0.0% |
| Literature & Languages | 0 | 0.0% |
| Liberal Arts & History | 0 | 0.0% |
| Visual & Performing Arts | 0 | 0.0% |
| Communications | 0 | 0.0% |
| Arts & Humanities | 0 | 0.0% |
| Total | 7 | 100.0% |
Transportation & Commute in Lexa
Vehicle Availability by Sex in Lexa
The most prevalent vehicle ownership categories in Lexa are males with 3 vehicles (9, accounting for 64.3%) and females with 3 vehicles (18, making up 24.3%).
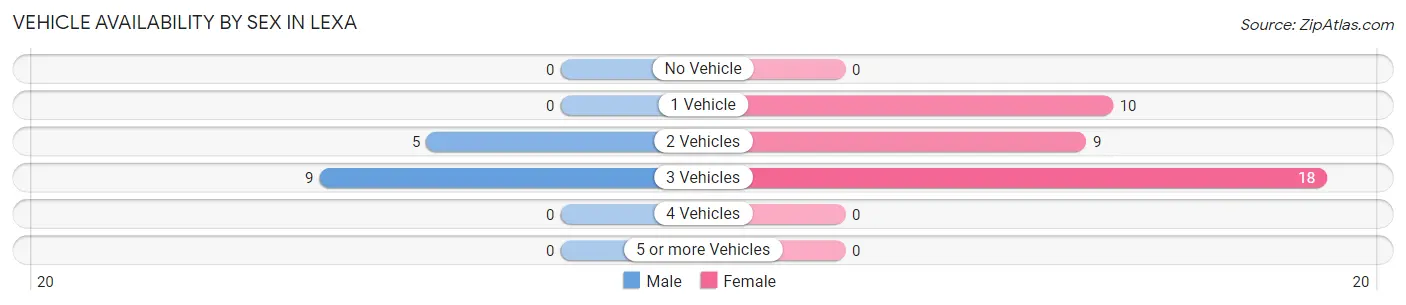
| Vehicles Available | Male | Female |
| No Vehicle | 0 (0.0%) | 0 (0.0%) |
| 1 Vehicle | 0 (0.0%) | 10 (27.0%) |
| 2 Vehicles | 5 (35.7%) | 9 (24.3%) |
| 3 Vehicles | 9 (64.3%) | 18 (48.6%) |
| 4 Vehicles | 0 (0.0%) | 0 (0.0%) |
| 5 or more Vehicles | 0 (0.0%) | 0 (0.0%) |
| Total | 14 (100.0%) | 37 (100.0%) |
Commute Time in Lexa
The most frequently occuring commute durations in Lexa are 10 to 14 minutes (14 commuters, 27.5%), 15 to 19 minutes (13 commuters, 25.5%), and 45 to 59 minutes (9 commuters, 17.6%).
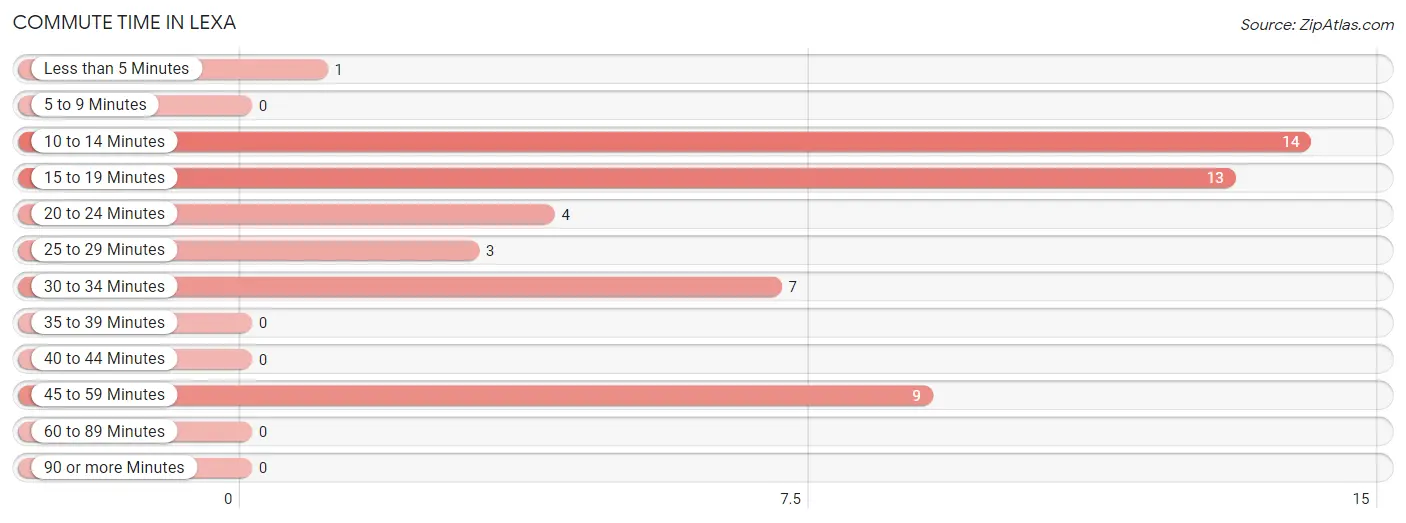
| Commute Time | # Commuters | % Commuters |
| Less than 5 Minutes | 1 | 2.0% |
| 5 to 9 Minutes | 0 | 0.0% |
| 10 to 14 Minutes | 14 | 27.5% |
| 15 to 19 Minutes | 13 | 25.5% |
| 20 to 24 Minutes | 4 | 7.8% |
| 25 to 29 Minutes | 3 | 5.9% |
| 30 to 34 Minutes | 7 | 13.7% |
| 35 to 39 Minutes | 0 | 0.0% |
| 40 to 44 Minutes | 0 | 0.0% |
| 45 to 59 Minutes | 9 | 17.6% |
| 60 to 89 Minutes | 0 | 0.0% |
| 90 or more Minutes | 0 | 0.0% |
Commute Time by Sex in Lexa
The most common commute times in Lexa are 45 to 59 minutes (9 commuters, 64.3%) for males and 10 to 14 minutes (13 commuters, 35.1%) for females.
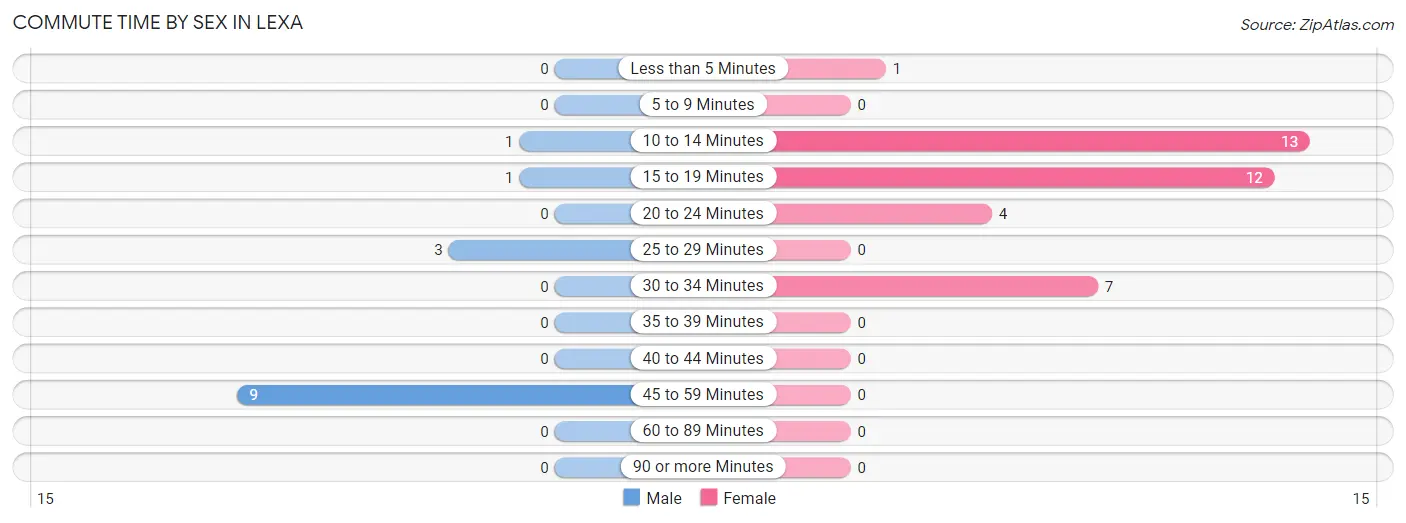
| Commute Time | Male | Female |
| Less than 5 Minutes | 0 (0.0%) | 1 (2.7%) |
| 5 to 9 Minutes | 0 (0.0%) | 0 (0.0%) |
| 10 to 14 Minutes | 1 (7.1%) | 13 (35.1%) |
| 15 to 19 Minutes | 1 (7.1%) | 12 (32.4%) |
| 20 to 24 Minutes | 0 (0.0%) | 4 (10.8%) |
| 25 to 29 Minutes | 3 (21.4%) | 0 (0.0%) |
| 30 to 34 Minutes | 0 (0.0%) | 7 (18.9%) |
| 35 to 39 Minutes | 0 (0.0%) | 0 (0.0%) |
| 40 to 44 Minutes | 0 (0.0%) | 0 (0.0%) |
| 45 to 59 Minutes | 9 (64.3%) | 0 (0.0%) |
| 60 to 89 Minutes | 0 (0.0%) | 0 (0.0%) |
| 90 or more Minutes | 0 (0.0%) | 0 (0.0%) |
Time of Departure to Work by Sex in Lexa
The most frequent times of departure to work in Lexa are 4:00 PM to 11:59 PM (12, 85.7%) for males and 12:00 AM to 4:59 AM (9, 24.3%) for females.
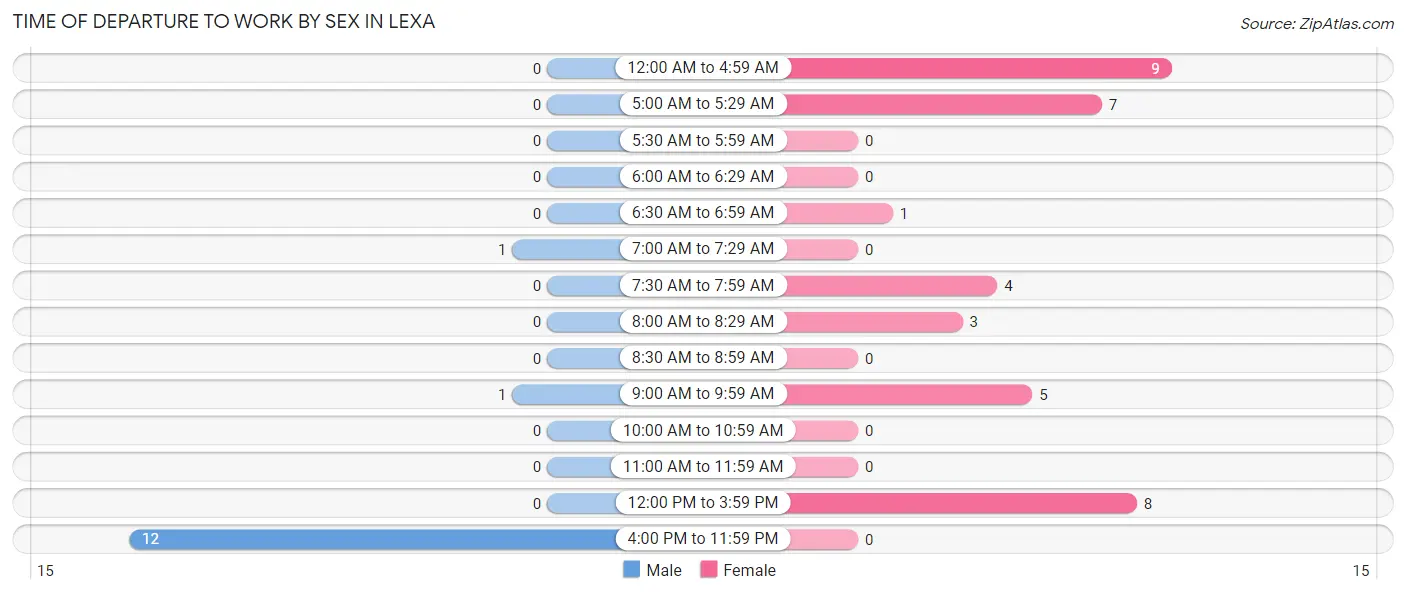
| Time of Departure | Male | Female |
| 12:00 AM to 4:59 AM | 0 (0.0%) | 9 (24.3%) |
| 5:00 AM to 5:29 AM | 0 (0.0%) | 7 (18.9%) |
| 5:30 AM to 5:59 AM | 0 (0.0%) | 0 (0.0%) |
| 6:00 AM to 6:29 AM | 0 (0.0%) | 0 (0.0%) |
| 6:30 AM to 6:59 AM | 0 (0.0%) | 1 (2.7%) |
| 7:00 AM to 7:29 AM | 1 (7.1%) | 0 (0.0%) |
| 7:30 AM to 7:59 AM | 0 (0.0%) | 4 (10.8%) |
| 8:00 AM to 8:29 AM | 0 (0.0%) | 3 (8.1%) |
| 8:30 AM to 8:59 AM | 0 (0.0%) | 0 (0.0%) |
| 9:00 AM to 9:59 AM | 1 (7.1%) | 5 (13.5%) |
| 10:00 AM to 10:59 AM | 0 (0.0%) | 0 (0.0%) |
| 11:00 AM to 11:59 AM | 0 (0.0%) | 0 (0.0%) |
| 12:00 PM to 3:59 PM | 0 (0.0%) | 8 (21.6%) |
| 4:00 PM to 11:59 PM | 12 (85.7%) | 0 (0.0%) |
| Total | 14 (100.0%) | 37 (100.0%) |
Housing Occupancy in Lexa
Occupancy by Ownership in Lexa
Of the total 51 dwellings in Lexa, owner-occupied units account for 27 (52.9%), while renter-occupied units make up 24 (47.1%).
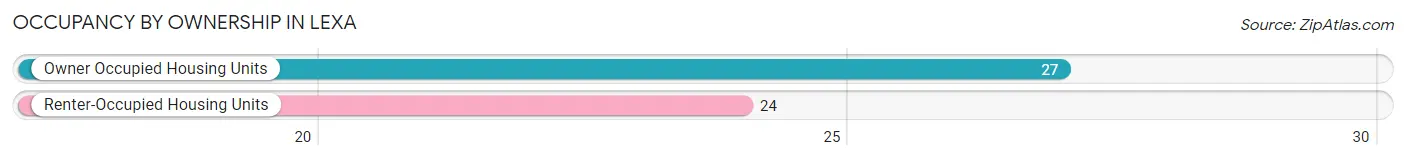
| Occupancy | # Housing Units | % Housing Units |
| Owner Occupied Housing Units | 27 | 52.9% |
| Renter-Occupied Housing Units | 24 | 47.1% |
| Total Occupied Housing Units | 51 | 100.0% |
Occupancy by Household Size in Lexa
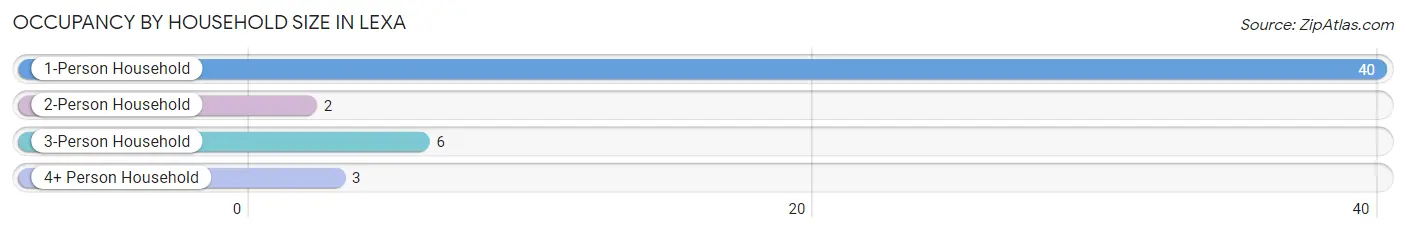
| Household Size | # Housing Units | % Housing Units |
| 1-Person Household | 40 | 78.4% |
| 2-Person Household | 2 | 3.9% |
| 3-Person Household | 6 | 11.8% |
| 4+ Person Household | 3 | 5.9% |
| Total Housing Units | 51 | 100.0% |
Occupancy by Ownership by Household Size in Lexa
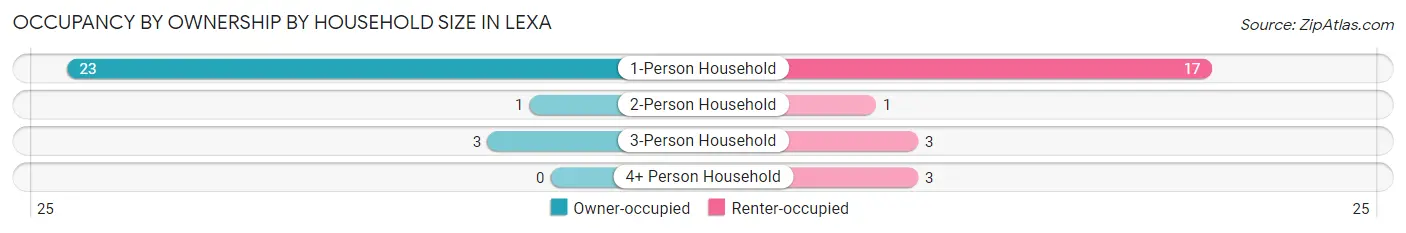
| Household Size | Owner-occupied | Renter-occupied |
| 1-Person Household | 23 (57.5%) | 17 (42.5%) |
| 2-Person Household | 1 (50.0%) | 1 (50.0%) |
| 3-Person Household | 3 (50.0%) | 3 (50.0%) |
| 4+ Person Household | 0 (0.0%) | 3 (100.0%) |
| Total Housing Units | 27 (52.9%) | 24 (47.1%) |
Occupancy by Educational Attainment in Lexa
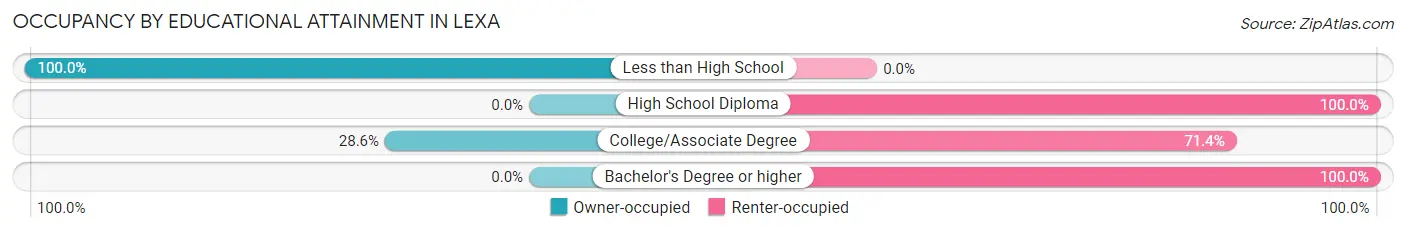
| Household Size | Owner-occupied | Renter-occupied |
| Less than High School | 23 (100.0%) | 0 (0.0%) |
| High School Diploma | 0 (0.0%) | 7 (100.0%) |
| College/Associate Degree | 4 (28.6%) | 10 (71.4%) |
| Bachelor's Degree or higher | 0 (0.0%) | 7 (100.0%) |
Occupancy by Age of Householder in Lexa
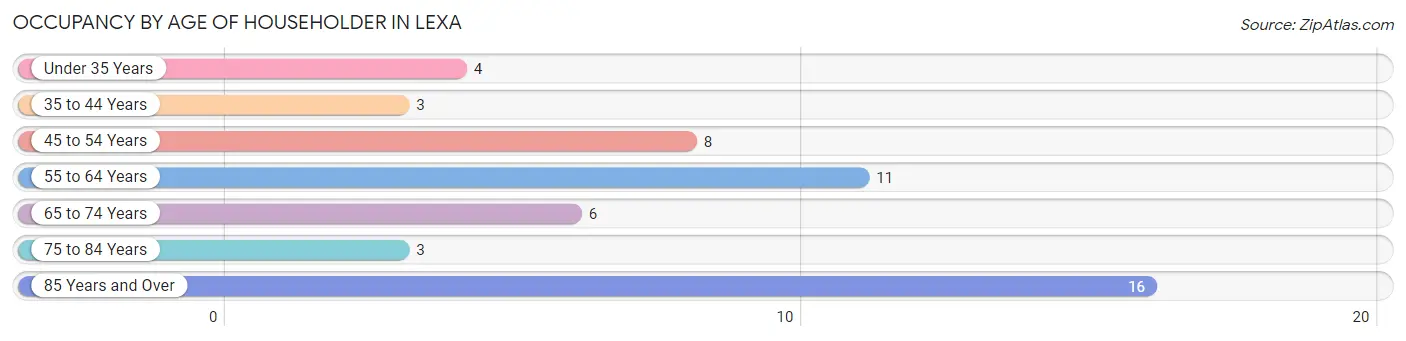
| Age Bracket | # Households | % Households |
| Under 35 Years | 4 | 7.8% |
| 35 to 44 Years | 3 | 5.9% |
| 45 to 54 Years | 8 | 15.7% |
| 55 to 64 Years | 11 | 21.6% |
| 65 to 74 Years | 6 | 11.8% |
| 75 to 84 Years | 3 | 5.9% |
| 85 Years and Over | 16 | 31.4% |
| Total | 51 | 100.0% |
Housing Finances in Lexa
Median Income by Occupancy in Lexa
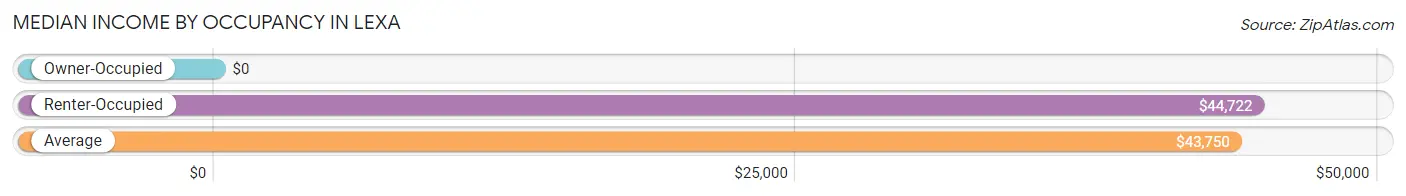
| Occupancy Type | # Households | Median Income |
| Owner-Occupied | 27 (52.9%) | $0 |
| Renter-Occupied | 24 (47.1%) | $44,722 |
| Average | 51 (100.0%) | $43,750 |
Occupancy by Householder Income Bracket in Lexa
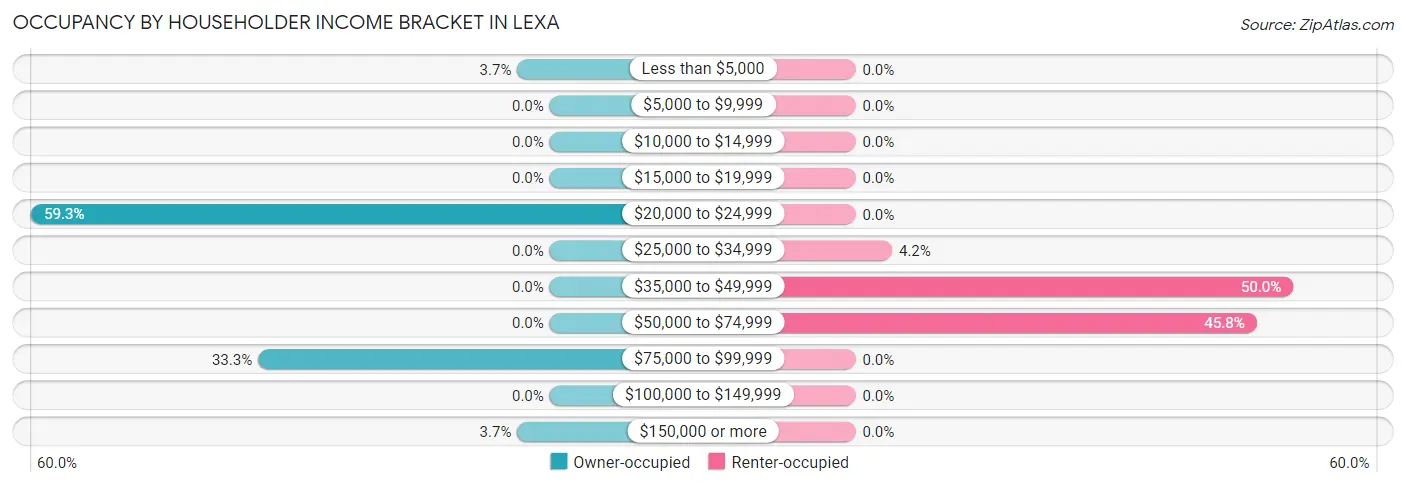
| Income Bracket | Owner-occupied | Renter-occupied |
| Less than $5,000 | 1 (3.7%) | 0 (0.0%) |
| $5,000 to $9,999 | 0 (0.0%) | 0 (0.0%) |
| $10,000 to $14,999 | 0 (0.0%) | 0 (0.0%) |
| $15,000 to $19,999 | 0 (0.0%) | 0 (0.0%) |
| $20,000 to $24,999 | 16 (59.3%) | 0 (0.0%) |
| $25,000 to $34,999 | 0 (0.0%) | 1 (4.2%) |
| $35,000 to $49,999 | 0 (0.0%) | 12 (50.0%) |
| $50,000 to $74,999 | 0 (0.0%) | 11 (45.8%) |
| $75,000 to $99,999 | 9 (33.3%) | 0 (0.0%) |
| $100,000 to $149,999 | 0 (0.0%) | 0 (0.0%) |
| $150,000 or more | 1 (3.7%) | 0 (0.0%) |
| Total | 27 (100.0%) | 24 (100.0%) |
Monthly Housing Cost Tiers in Lexa
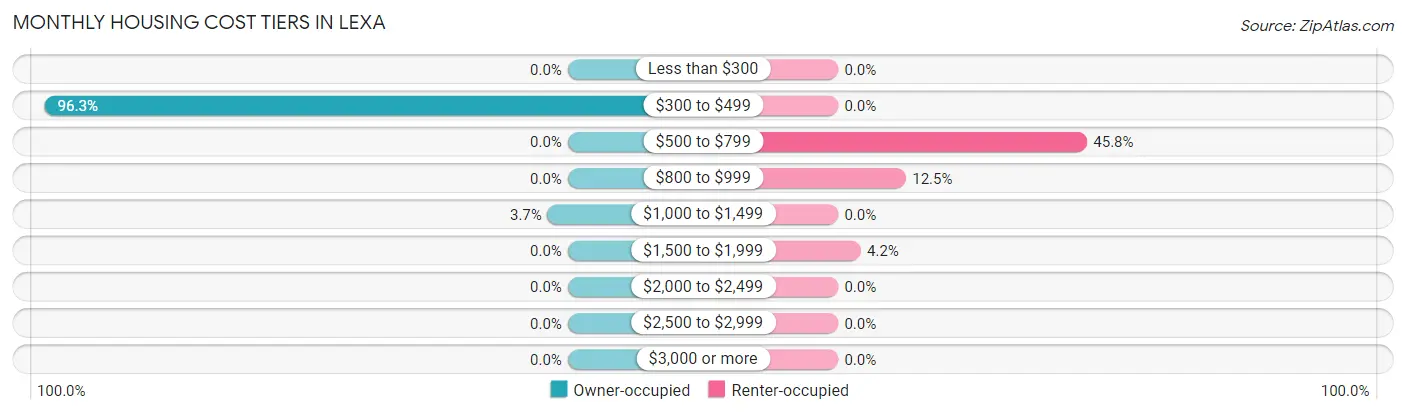
| Monthly Cost | Owner-occupied | Renter-occupied |
| Less than $300 | 0 (0.0%) | 0 (0.0%) |
| $300 to $499 | 26 (96.3%) | 0 (0.0%) |
| $500 to $799 | 0 (0.0%) | 11 (45.8%) |
| $800 to $999 | 0 (0.0%) | 3 (12.5%) |
| $1,000 to $1,499 | 1 (3.7%) | 0 (0.0%) |
| $1,500 to $1,999 | 0 (0.0%) | 1 (4.2%) |
| $2,000 to $2,499 | 0 (0.0%) | 0 (0.0%) |
| $2,500 to $2,999 | 0 (0.0%) | 0 (0.0%) |
| $3,000 or more | 0 (0.0%) | 0 (0.0%) |
| Total | 27 (100.0%) | 24 (100.0%) |
Physical Housing Characteristics in Lexa
Housing Structures in Lexa
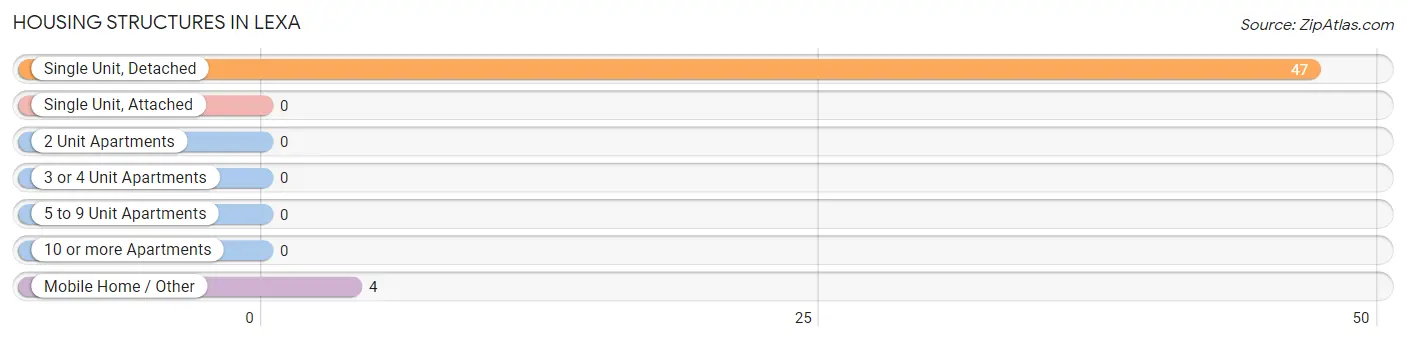
| Structure Type | # Housing Units | % Housing Units |
| Single Unit, Detached | 47 | 92.2% |
| Single Unit, Attached | 0 | 0.0% |
| 2 Unit Apartments | 0 | 0.0% |
| 3 or 4 Unit Apartments | 0 | 0.0% |
| 5 to 9 Unit Apartments | 0 | 0.0% |
| 10 or more Apartments | 0 | 0.0% |
| Mobile Home / Other | 4 | 7.8% |
| Total | 51 | 100.0% |
Housing Structures by Occupancy in Lexa
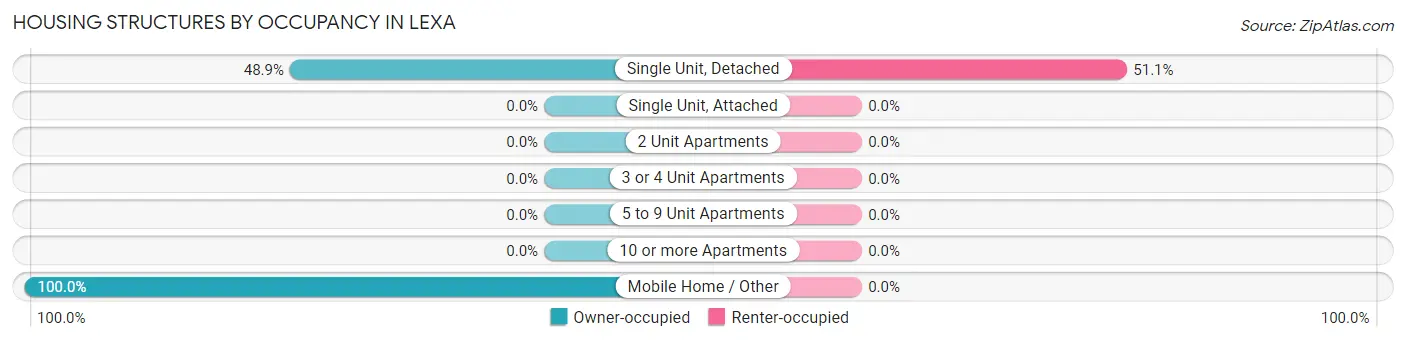
| Structure Type | Owner-occupied | Renter-occupied |
| Single Unit, Detached | 23 (48.9%) | 24 (51.1%) |
| Single Unit, Attached | 0 (0.0%) | 0 (0.0%) |
| 2 Unit Apartments | 0 (0.0%) | 0 (0.0%) |
| 3 or 4 Unit Apartments | 0 (0.0%) | 0 (0.0%) |
| 5 to 9 Unit Apartments | 0 (0.0%) | 0 (0.0%) |
| 10 or more Apartments | 0 (0.0%) | 0 (0.0%) |
| Mobile Home / Other | 4 (100.0%) | 0 (0.0%) |
| Total | 27 (52.9%) | 24 (47.1%) |
Housing Structures by Number of Rooms in Lexa
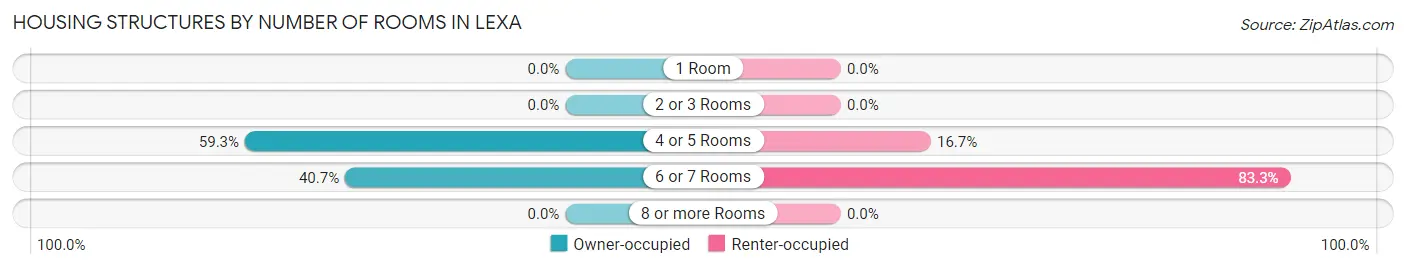
| Number of Rooms | Owner-occupied | Renter-occupied |
| 1 Room | 0 (0.0%) | 0 (0.0%) |
| 2 or 3 Rooms | 0 (0.0%) | 0 (0.0%) |
| 4 or 5 Rooms | 16 (59.3%) | 4 (16.7%) |
| 6 or 7 Rooms | 11 (40.7%) | 20 (83.3%) |
| 8 or more Rooms | 0 (0.0%) | 0 (0.0%) |
| Total | 27 (100.0%) | 24 (100.0%) |
Housing Structure by Heating Type in Lexa
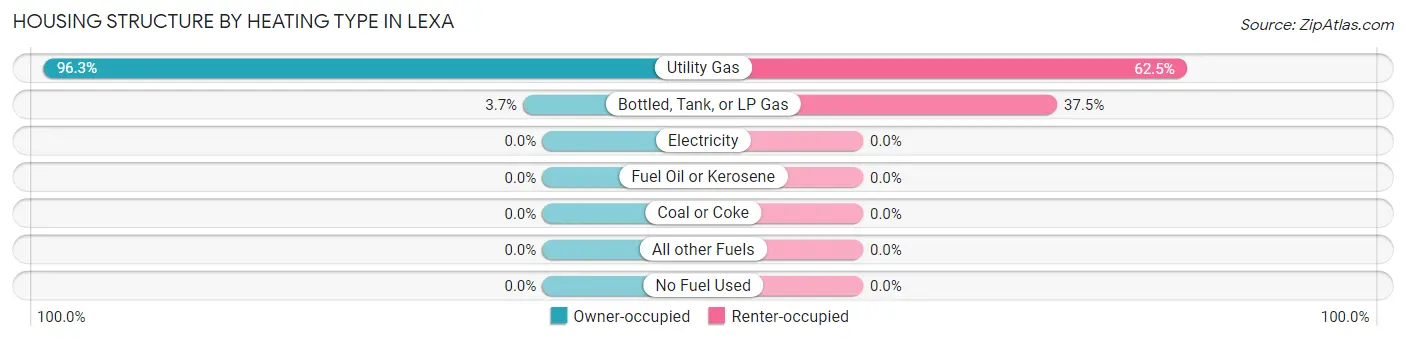
| Heating Type | Owner-occupied | Renter-occupied |
| Utility Gas | 26 (96.3%) | 15 (62.5%) |
| Bottled, Tank, or LP Gas | 1 (3.7%) | 9 (37.5%) |
| Electricity | 0 (0.0%) | 0 (0.0%) |
| Fuel Oil or Kerosene | 0 (0.0%) | 0 (0.0%) |
| Coal or Coke | 0 (0.0%) | 0 (0.0%) |
| All other Fuels | 0 (0.0%) | 0 (0.0%) |
| No Fuel Used | 0 (0.0%) | 0 (0.0%) |
| Total | 27 (100.0%) | 24 (100.0%) |
Household Vehicle Usage in Lexa
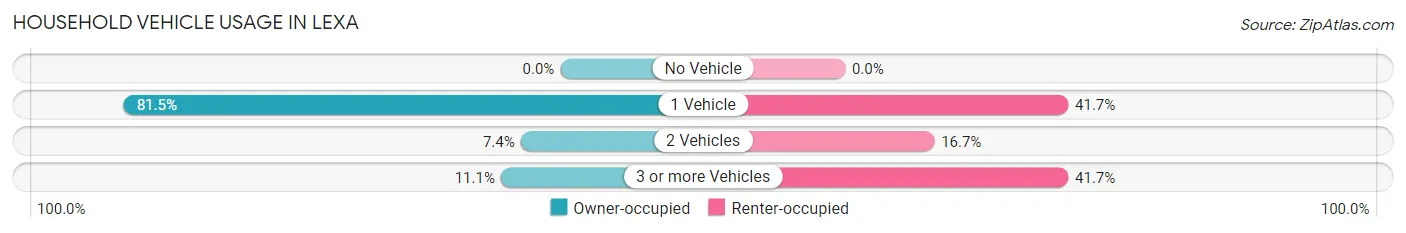
| Vehicles per Household | Owner-occupied | Renter-occupied |
| No Vehicle | 0 (0.0%) | 0 (0.0%) |
| 1 Vehicle | 22 (81.5%) | 10 (41.7%) |
| 2 Vehicles | 2 (7.4%) | 4 (16.7%) |
| 3 or more Vehicles | 3 (11.1%) | 10 (41.7%) |
| Total | 27 (100.0%) | 24 (100.0%) |
Real Estate & Mortgages in Lexa
Real Estate and Mortgage Overview in Lexa
| Characteristic | Without Mortgage | With Mortgage |
| Housing Units | 26 | 1 |
| Median Property Value | $81,900 | $0 |
| Median Household Income | - | - |
| Monthly Housing Costs | $372 | $0 |
| Real Estate Taxes | $266 | $0 |
Property Value by Mortgage Status in Lexa
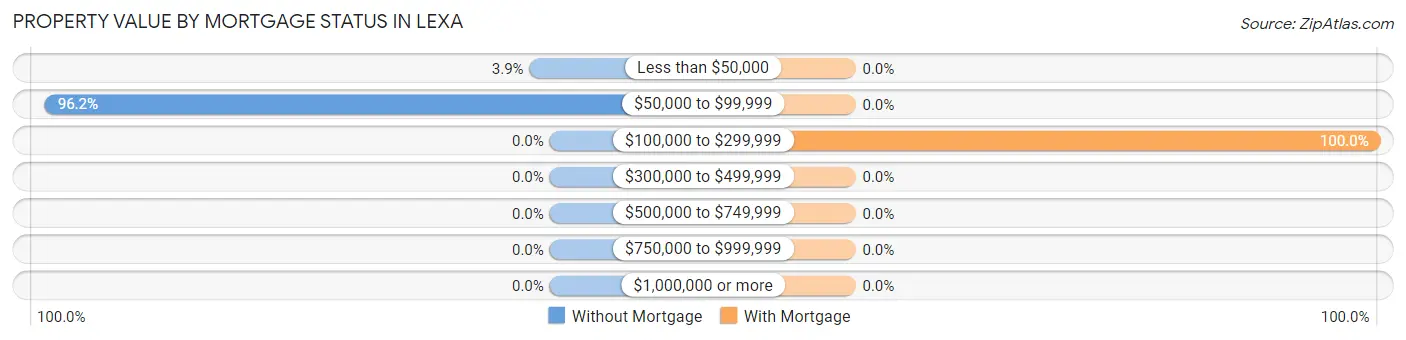
| Property Value | Without Mortgage | With Mortgage |
| Less than $50,000 | 1 (3.8%) | 0 (0.0%) |
| $50,000 to $99,999 | 25 (96.2%) | 0 (0.0%) |
| $100,000 to $299,999 | 0 (0.0%) | 1 (100.0%) |
| $300,000 to $499,999 | 0 (0.0%) | 0 (0.0%) |
| $500,000 to $749,999 | 0 (0.0%) | 0 (0.0%) |
| $750,000 to $999,999 | 0 (0.0%) | 0 (0.0%) |
| $1,000,000 or more | 0 (0.0%) | 0 (0.0%) |
| Total | 26 (100.0%) | 1 (100.0%) |
Household Income by Mortgage Status in Lexa
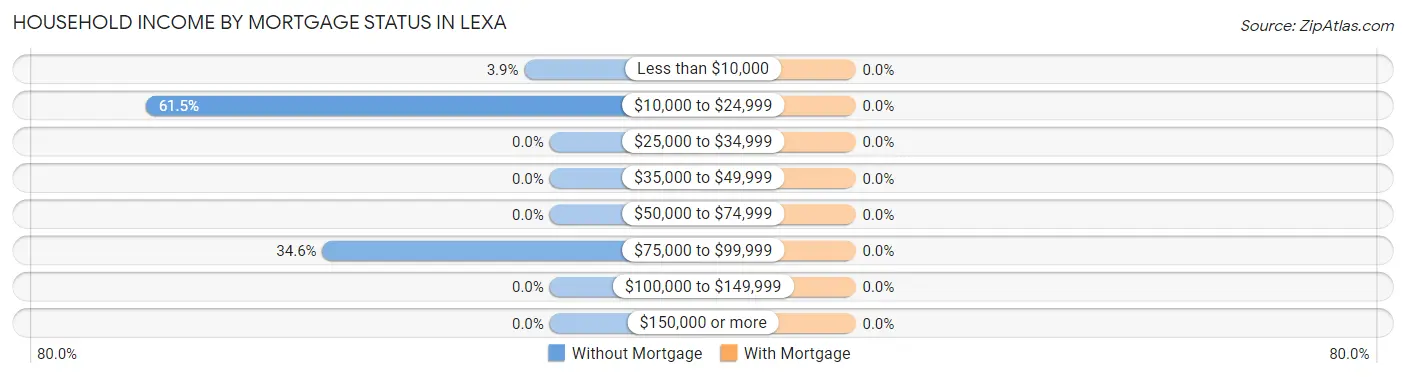
| Household Income | Without Mortgage | With Mortgage |
| Less than $10,000 | 1 (3.8%) | 0 (0.0%) |
| $10,000 to $24,999 | 16 (61.5%) | 0 (0.0%) |
| $25,000 to $34,999 | 0 (0.0%) | 0 (0.0%) |
| $35,000 to $49,999 | 0 (0.0%) | 0 (0.0%) |
| $50,000 to $74,999 | 0 (0.0%) | 0 (0.0%) |
| $75,000 to $99,999 | 9 (34.6%) | 0 (0.0%) |
| $100,000 to $149,999 | 0 (0.0%) | 0 (0.0%) |
| $150,000 or more | 0 (0.0%) | 0 (0.0%) |
| Total | 26 (100.0%) | 1 (100.0%) |
Property Value to Household Income Ratio in Lexa
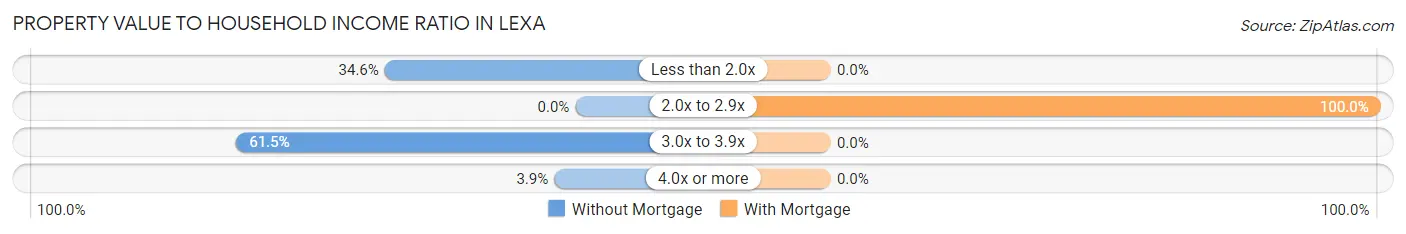
| Value-to-Income Ratio | Without Mortgage | With Mortgage |
| Less than 2.0x | 9 (34.6%) | 0 (0.0%) |
| 2.0x to 2.9x | 0 (0.0%) | 1 (100.0%) |
| 3.0x to 3.9x | 16 (61.5%) | 0 (0.0%) |
| 4.0x or more | 1 (3.8%) | 0 (0.0%) |
| Total | 26 (100.0%) | 1 (100.0%) |
Real Estate Taxes by Mortgage Status in Lexa
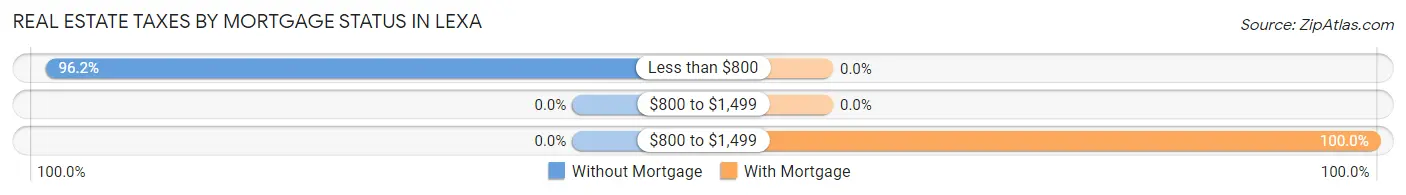
| Property Taxes | Without Mortgage | With Mortgage |
| Less than $800 | 25 (96.2%) | 0 (0.0%) |
| $800 to $1,499 | 0 (0.0%) | 0 (0.0%) |
| $800 to $1,499 | 0 (0.0%) | 1 (100.0%) |
| Total | 26 (100.0%) | 1 (100.0%) |
Health & Disability in Lexa
Health Insurance Coverage by Age in Lexa
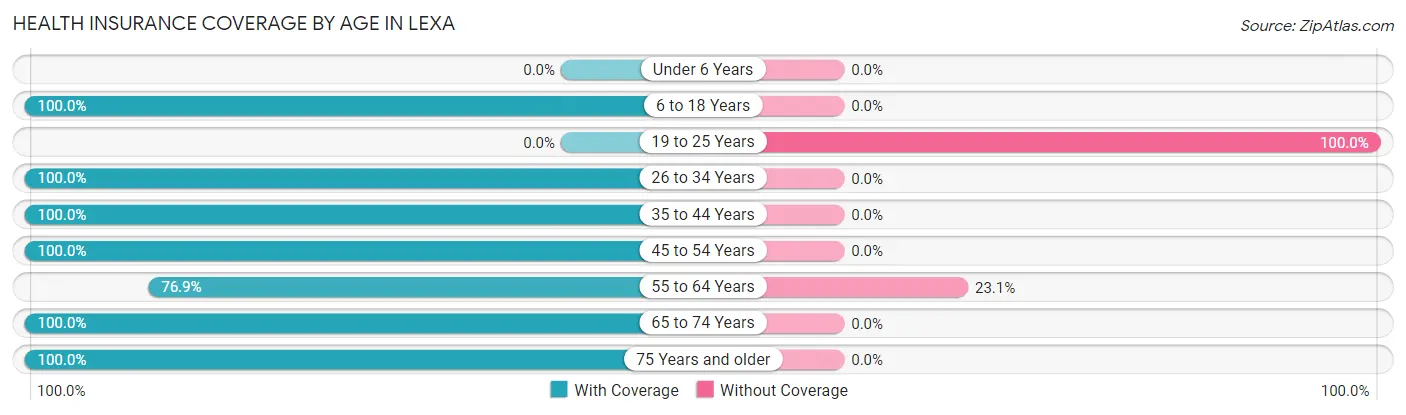
| Age Bracket | With Coverage | Without Coverage |
| Under 6 Years | 0 (0.0%) | 0 (0.0%) |
| 6 to 18 Years | 15 (100.0%) | 0 (0.0%) |
| 19 to 25 Years | 0 (0.0%) | 1 (100.0%) |
| 26 to 34 Years | 3 (100.0%) | 0 (0.0%) |
| 35 to 44 Years | 6 (100.0%) | 0 (0.0%) |
| 45 to 54 Years | 16 (100.0%) | 0 (0.0%) |
| 55 to 64 Years | 20 (76.9%) | 6 (23.1%) |
| 65 to 74 Years | 6 (100.0%) | 0 (0.0%) |
| 75 Years and older | 19 (100.0%) | 0 (0.0%) |
| Total | 85 (92.4%) | 7 (7.6%) |
Health Insurance Coverage by Citizenship Status in Lexa
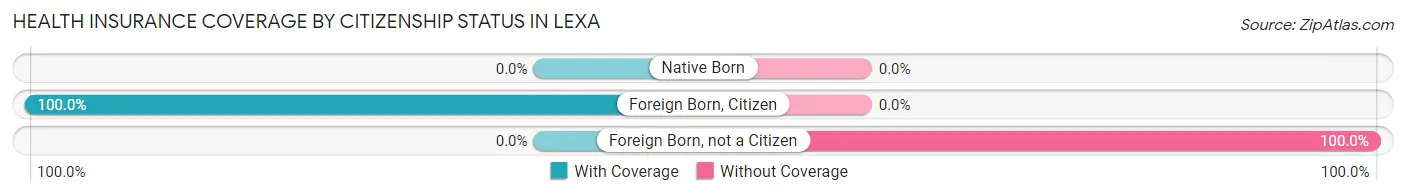
| Citizenship Status | With Coverage | Without Coverage |
| Native Born | 0 (0.0%) | 0 (0.0%) |
| Foreign Born, Citizen | 15 (100.0%) | 0 (0.0%) |
| Foreign Born, not a Citizen | 0 (0.0%) | 1 (100.0%) |
Health Insurance Coverage by Household Income in Lexa
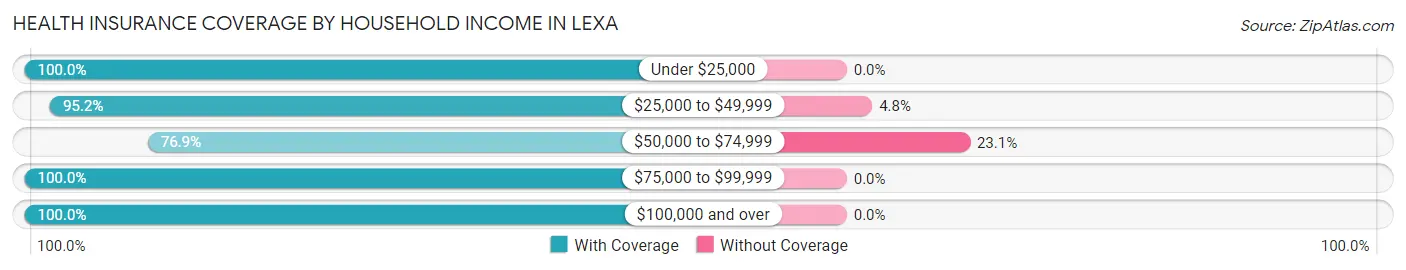
| Household Income | With Coverage | Without Coverage |
| Under $25,000 | 17 (100.0%) | 0 (0.0%) |
| $25,000 to $49,999 | 20 (95.2%) | 1 (4.8%) |
| $50,000 to $74,999 | 20 (76.9%) | 6 (23.1%) |
| $75,000 to $99,999 | 26 (100.0%) | 0 (0.0%) |
| $100,000 and over | 2 (100.0%) | 0 (0.0%) |
Public vs Private Health Insurance Coverage by Age in Lexa
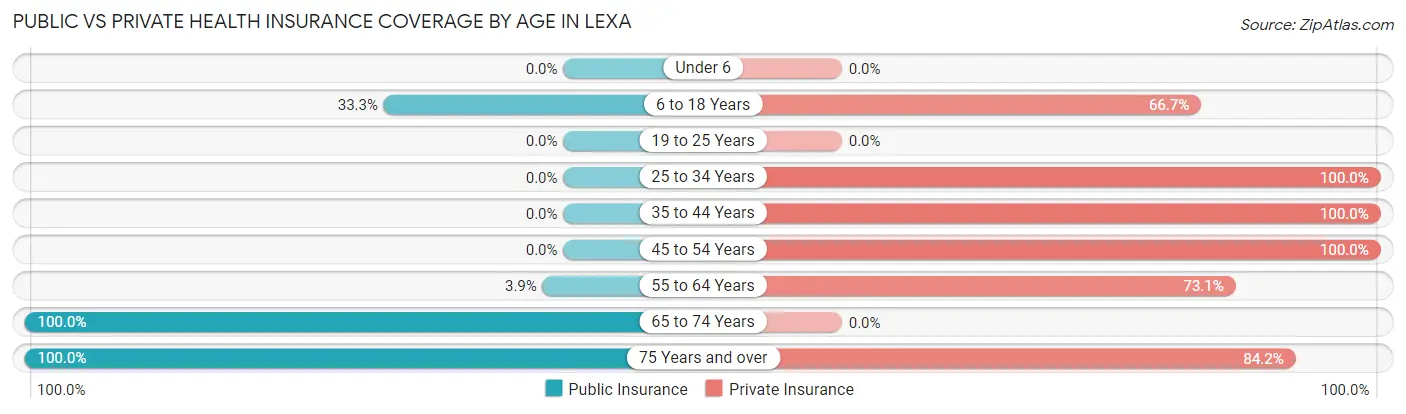
| Age Bracket | Public Insurance | Private Insurance |
| Under 6 | 0 (0.0%) | 0 (0.0%) |
| 6 to 18 Years | 5 (33.3%) | 10 (66.7%) |
| 19 to 25 Years | 0 (0.0%) | 0 (0.0%) |
| 25 to 34 Years | 0 (0.0%) | 3 (100.0%) |
| 35 to 44 Years | 0 (0.0%) | 6 (100.0%) |
| 45 to 54 Years | 0 (0.0%) | 16 (100.0%) |
| 55 to 64 Years | 1 (3.8%) | 19 (73.1%) |
| 65 to 74 Years | 6 (100.0%) | 0 (0.0%) |
| 75 Years and over | 19 (100.0%) | 16 (84.2%) |
| Total | 31 (33.7%) | 70 (76.1%) |
Disability Status by Sex by Age in Lexa
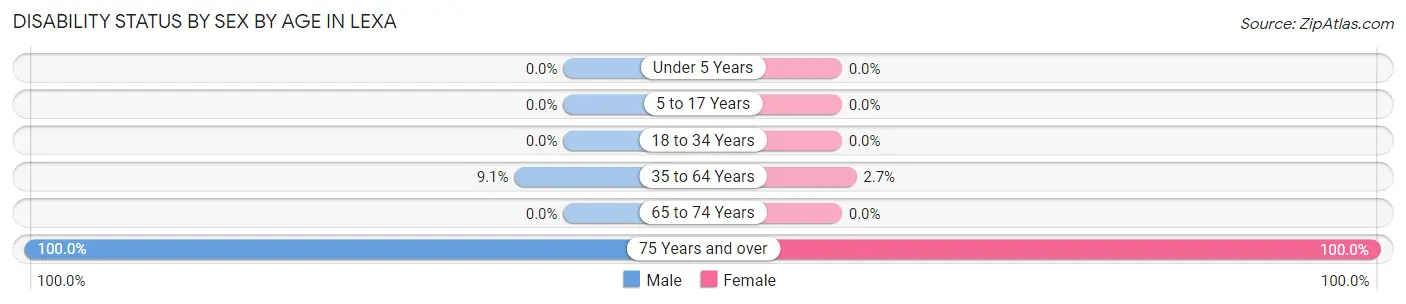
| Age Bracket | Male | Female |
| Under 5 Years | 0 (0.0%) | 0 (0.0%) |
| 5 to 17 Years | 0 (0.0%) | 0 (0.0%) |
| 18 to 34 Years | 0 (0.0%) | 0 (0.0%) |
| 35 to 64 Years | 1 (9.1%) | 1 (2.7%) |
| 65 to 74 Years | 0 (0.0%) | 0 (0.0%) |
| 75 Years and over | 16 (100.0%) | 3 (100.0%) |
Disability Class by Sex by Age in Lexa
Disability Class: Hearing Difficulty
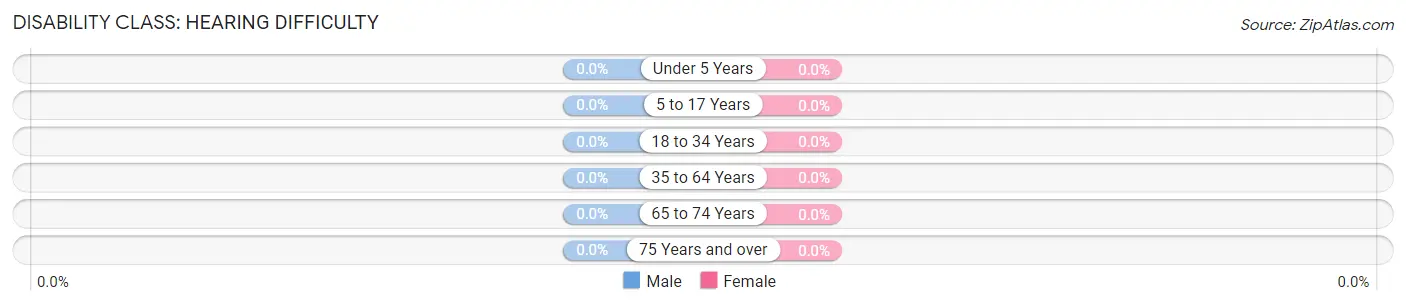
| Age Bracket | Male | Female |
| Under 5 Years | 0 (0.0%) | 0 (0.0%) |
| 5 to 17 Years | 0 (0.0%) | 0 (0.0%) |
| 18 to 34 Years | 0 (0.0%) | 0 (0.0%) |
| 35 to 64 Years | 0 (0.0%) | 0 (0.0%) |
| 65 to 74 Years | 0 (0.0%) | 0 (0.0%) |
| 75 Years and over | 0 (0.0%) | 0 (0.0%) |
Disability Class: Vision Difficulty
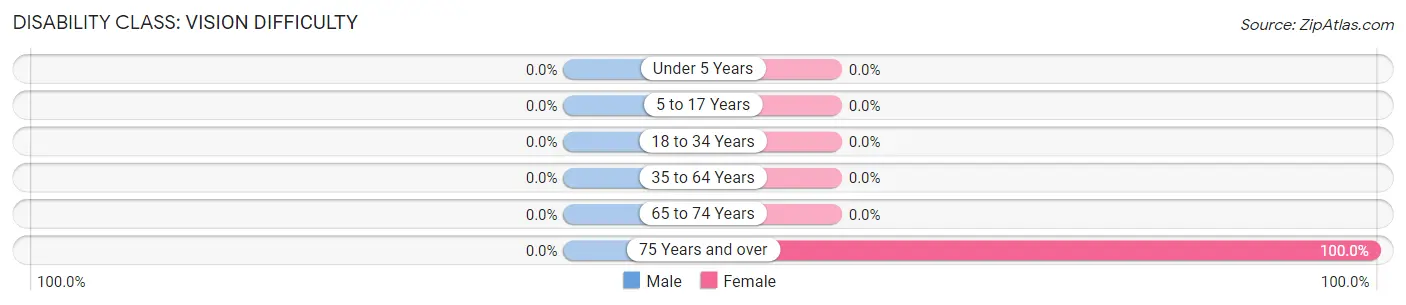
| Age Bracket | Male | Female |
| Under 5 Years | 0 (0.0%) | 0 (0.0%) |
| 5 to 17 Years | 0 (0.0%) | 0 (0.0%) |
| 18 to 34 Years | 0 (0.0%) | 0 (0.0%) |
| 35 to 64 Years | 0 (0.0%) | 0 (0.0%) |
| 65 to 74 Years | 0 (0.0%) | 0 (0.0%) |
| 75 Years and over | 0 (0.0%) | 3 (100.0%) |
Disability Class: Cognitive Difficulty
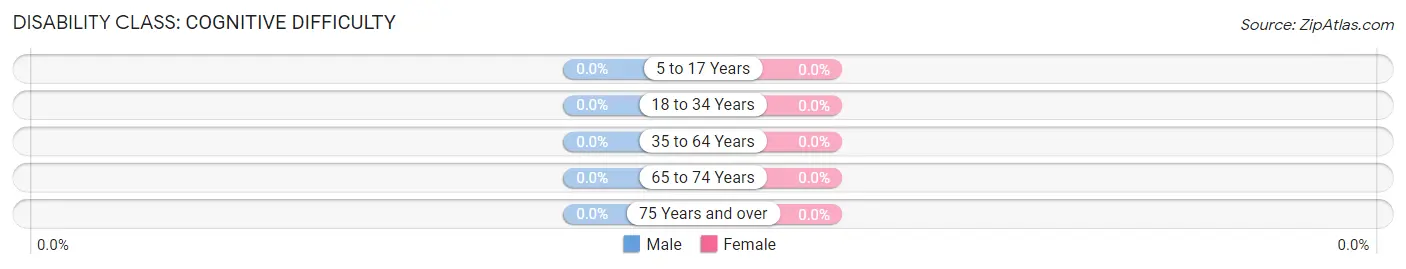
| Age Bracket | Male | Female |
| 5 to 17 Years | 0 (0.0%) | 0 (0.0%) |
| 18 to 34 Years | 0 (0.0%) | 0 (0.0%) |
| 35 to 64 Years | 0 (0.0%) | 0 (0.0%) |
| 65 to 74 Years | 0 (0.0%) | 0 (0.0%) |
| 75 Years and over | 0 (0.0%) | 0 (0.0%) |
Disability Class: Ambulatory Difficulty
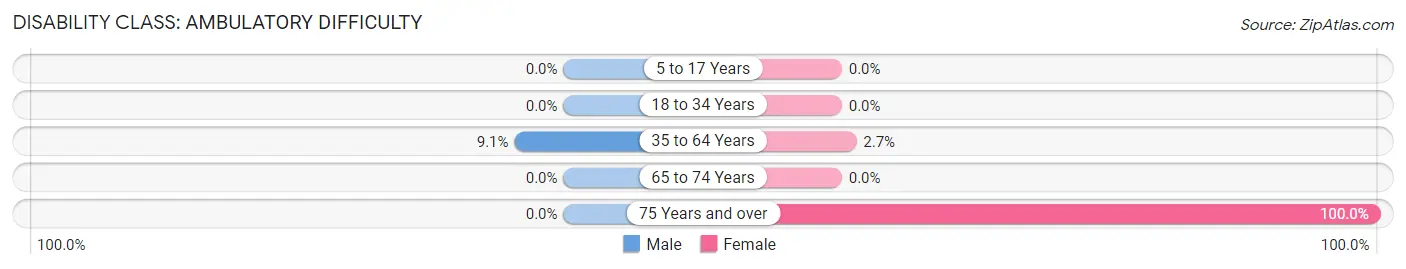
| Age Bracket | Male | Female |
| 5 to 17 Years | 0 (0.0%) | 0 (0.0%) |
| 18 to 34 Years | 0 (0.0%) | 0 (0.0%) |
| 35 to 64 Years | 1 (9.1%) | 1 (2.7%) |
| 65 to 74 Years | 0 (0.0%) | 0 (0.0%) |
| 75 Years and over | 0 (0.0%) | 3 (100.0%) |
Disability Class: Self-Care Difficulty
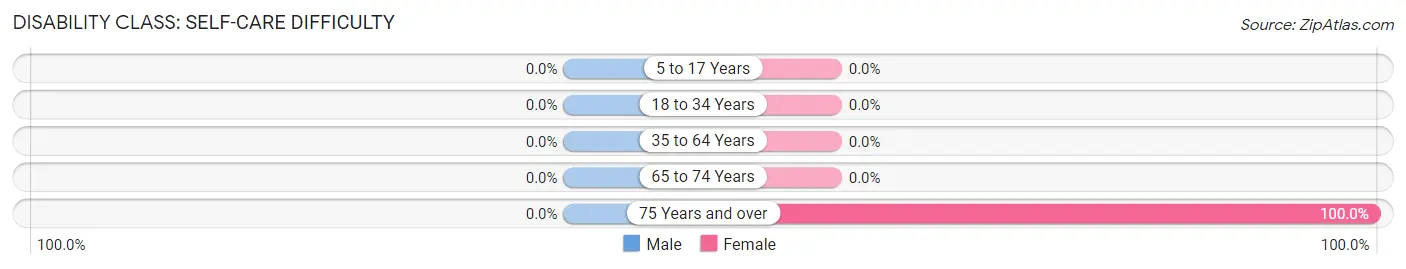
| Age Bracket | Male | Female |
| 5 to 17 Years | 0 (0.0%) | 0 (0.0%) |
| 18 to 34 Years | 0 (0.0%) | 0 (0.0%) |
| 35 to 64 Years | 0 (0.0%) | 0 (0.0%) |
| 65 to 74 Years | 0 (0.0%) | 0 (0.0%) |
| 75 Years and over | 0 (0.0%) | 3 (100.0%) |
Technology Access in Lexa
Computing Device Access in Lexa
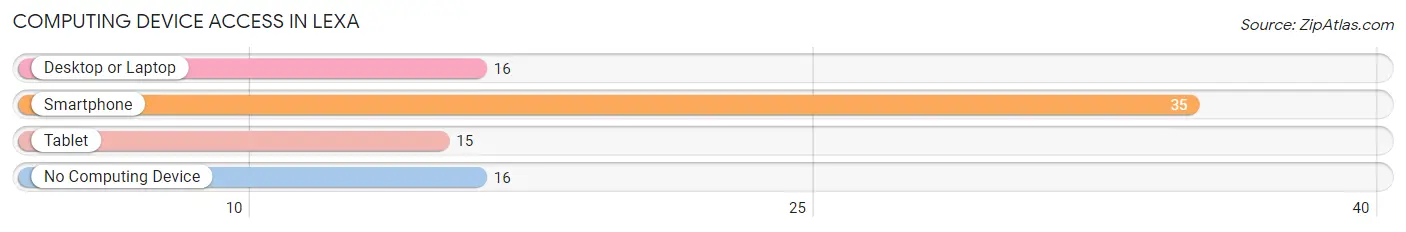
| Device Type | # Households | % Households |
| Desktop or Laptop | 16 | 31.4% |
| Smartphone | 35 | 68.6% |
| Tablet | 15 | 29.4% |
| No Computing Device | 16 | 31.4% |
| Total | 51 | 100.0% |
Internet Access in Lexa
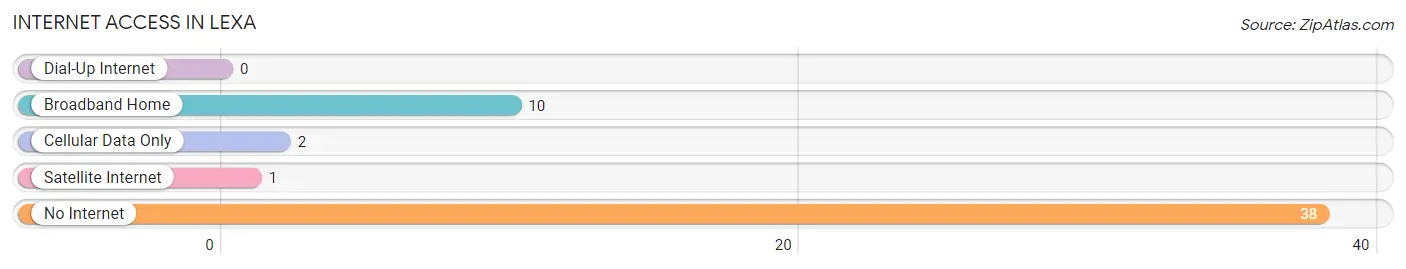
| Internet Type | # Households | % Households |
| Dial-Up Internet | 0 | 0.0% |
| Broadband Home | 10 | 19.6% |
| Cellular Data Only | 2 | 3.9% |
| Satellite Internet | 1 | 2.0% |
| No Internet | 38 | 74.5% |
| Total | 51 | 100.0% |
Lexa Summary
AR History
Arkansas is a state located in the Southern United States. It is bordered by Missouri to the north, Tennessee and Mississippi to the east, Louisiana to the south, and Texas to the southwest. Arkansas was admitted to the Union as the 25th state on June 15, 1836.
The first inhabitants of Arkansas were Native Americans, including the Caddo, Osage, Quapaw, and Cherokee. The first Europeans to explore the area were the Spanish, who arrived in 1541. The French established the first permanent settlement in Arkansas in 1686. The French and Spanish both had a significant influence on the culture and history of Arkansas.
In 1803, the United States acquired Arkansas as part of the Louisiana Purchase. Arkansas became a territory in 1819 and was admitted to the Union in 1836. During the Civil War, Arkansas was a Confederate state. After the war, Arkansas was readmitted to the Union in 1868.
Arkansas has a rich history of agriculture, industry, and politics. The state has been home to many influential figures, including President Bill Clinton, Senator J. William Fulbright, and Governor Orval Faubus.
Geography
Arkansas is located in the south-central United States. It is bordered by Missouri to the north, Tennessee and Mississippi to the east, Louisiana to the south, and Texas to the southwest. Arkansas is the 29th largest state in the United States, with an area of 53,179 square miles.
The landscape of Arkansas is diverse, ranging from the Ozark Mountains in the northwest to the flat Delta region in the east. The state is home to numerous rivers, including the Arkansas, White, and Mississippi. The highest point in Arkansas is Magazine Mountain, which has an elevation of 2,753 feet.
Economy
Arkansas has a diverse economy, with a mix of agriculture, industry, and services. The state’s major industries include agriculture, manufacturing, and tourism.
Agriculture is a major part of the Arkansas economy. The state is a leading producer of rice, cotton, soybeans, and poultry. Other important agricultural products include corn, wheat, hay, and timber.
Manufacturing is also an important part of the Arkansas economy. The state is home to several major companies, including Tyson Foods, J.B. Hunt, and Walmart.
Tourism is also a major industry in Arkansas. The state is home to numerous attractions, including Hot Springs National Park, the Ozark National Forest, and the Buffalo National River.
Demographics
As of 2020, Arkansas had an estimated population of 3,017,804. The state has a population density of 56.3 people per square mile.
The largest city in Arkansas is Little Rock, with an estimated population of 198,541. Other major cities include Fort Smith, Fayetteville, and Springdale.
The racial makeup of Arkansas is 73.2% White, 16.9% Black or African American, 0.7% Native American, 1.7% Asian, 0.1% Pacific Islander, and 5.4% from other races. The state also has a large Hispanic or Latino population, making up 8.3% of the population.
The median household income in Arkansas is $45,869, and the median home value is $133,400. The state has a poverty rate of 17.2%.
Common Questions
What is Per Capita Income in Lexa?
Per Capita income in Lexa is $32,864.
What is the Median Family Income in Lexa?
Median Family Income in Lexa is $67,083.
What is the Median Household income in Lexa?
Median Household Income in Lexa is $43,750.
What is Income or Wage Gap in Lexa?
Income or Wage Gap in Lexa is 0.7%.
Women in Lexa earn 99.3 cents for every dollar earned by a man.
What is Inequality or Gini Index in Lexa?
Inequality or Gini Index in Lexa is 0.30.
What is the Total Population of Lexa?
Total Population of Lexa is 92.
What is the Total Male Population of Lexa?
Total Male Population of Lexa is 42.
What is the Total Female Population of Lexa?
Total Female Population of Lexa is 50.
What is the Ratio of Males per 100 Females in Lexa?
There are 84.00 Males per 100 Females in Lexa.
What is the Ratio of Females per 100 Males in Lexa?
There are 119.05 Females per 100 Males in Lexa.
What is the Median Population Age in Lexa?
Median Population Age in Lexa is 56.5 Years.
What is the Average Family Size in Lexa
Average Family Size in Lexa is 4.7 People.
What is the Average Household Size in Lexa
Average Household Size in Lexa is 1.8 People.
How Large is the Labor Force in Lexa?
There are 51 People in the Labor Forcein in Lexa.
What is the Percentage of People in the Labor Force in Lexa?
66.2% of People are in the Labor Force in Lexa.