Fulton, AR Map & Demographics
Fulton Map
Fulton Overview
$24,696
PER CAPITA INCOME
$36,250
AVG FAMILY INCOME
$36,397
AVG HOUSEHOLD INCOME
0.39
INEQUALITY / GINI INDEX
208
TOTAL POPULATION
89
MALE POPULATION
119
FEMALE POPULATION
74.79
MALES / 100 FEMALES
133.71
FEMALES / 100 MALES
58.9
MEDIAN AGE
2.5
AVG FAMILY SIZE
1.9
AVG HOUSEHOLD SIZE
76
LABOR FORCE [ PEOPLE ]
38.0%
PERCENT IN LABOR FORCE
Fulton Zip Codes
Fulton Area Codes
Income in Fulton
Income Overview in Fulton
Per Capita Income in Fulton is $24,696, while median incomes of families and households are $36,250 and $36,397 respectively.
| Characteristic | Number | Measure |
| Per Capita Income | 208 | $24,696 |
| Median Family Income | 69 | $36,250 |
| Mean Family Income | 69 | $45,075 |
| Median Household Income | 107 | $36,397 |
| Mean Household Income | 107 | $43,336 |
| Income Deficit | 69 | $0 |
| Wage / Income Gap (%) | 208 | 0.00% |
| Wage / Income Gap ($) | 208 | 100.00¢ per $1 |
| Gini / Inequality Index | 208 | 0.39 |
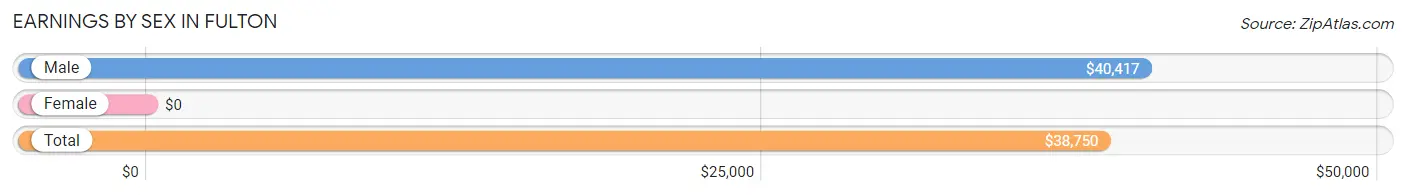
Earnings by Sex in Fulton
| Sex | Number | Average Earnings |
| Male | 42 (53.8%) | $40,417 |
| Female | 36 (46.2%) | $0 |
| Total | 78 (100.0%) | $38,750 |
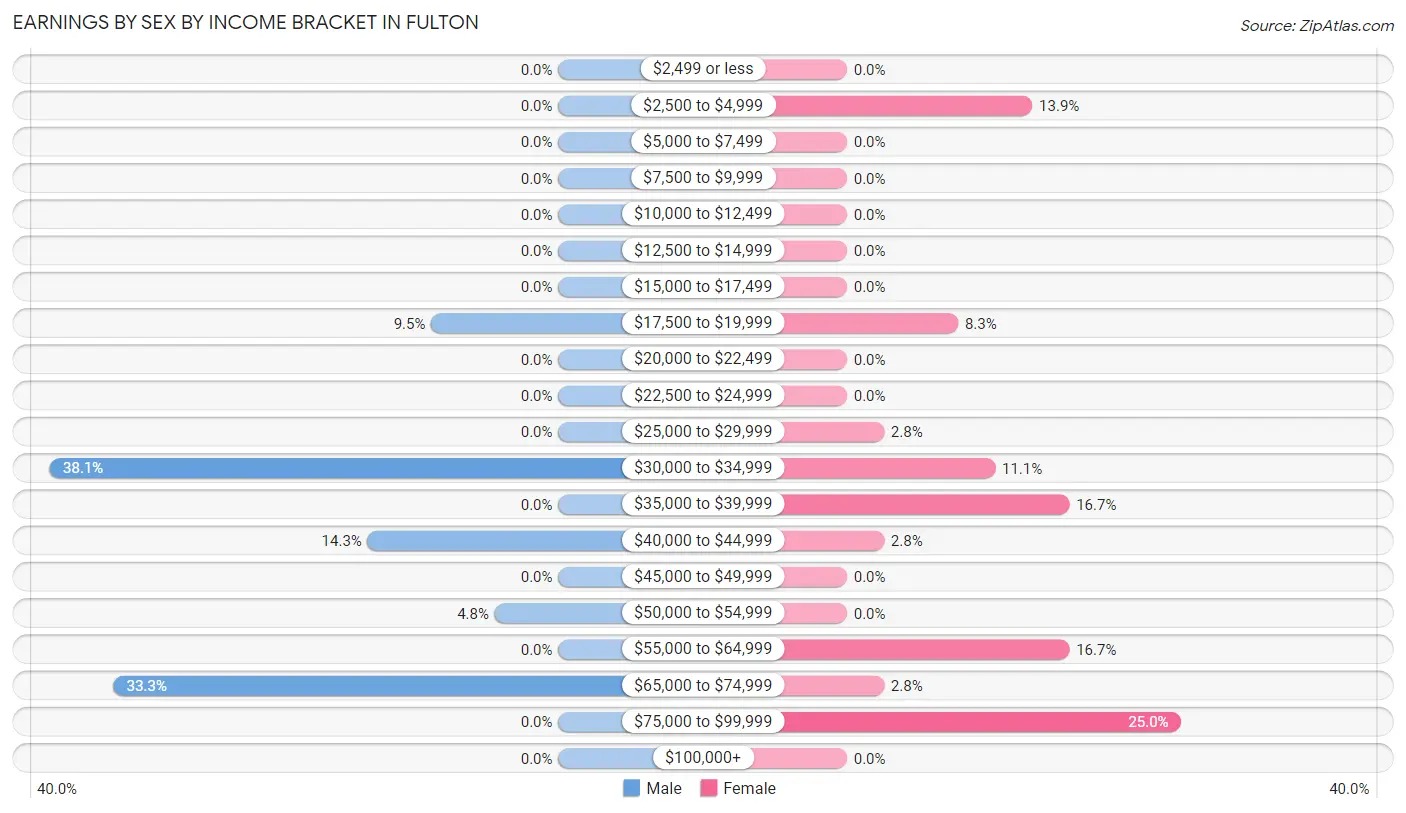
Earnings by Sex by Income Bracket in Fulton
The most common earnings brackets in Fulton are $30,000 to $34,999 for men (16 | 38.1%) and $75,000 to $99,999 for women (9 | 25.0%).
| Income | Male | Female |
| $2,499 or less | 0 (0.0%) | 0 (0.0%) |
| $2,500 to $4,999 | 0 (0.0%) | 5 (13.9%) |
| $5,000 to $7,499 | 0 (0.0%) | 0 (0.0%) |
| $7,500 to $9,999 | 0 (0.0%) | 0 (0.0%) |
| $10,000 to $12,499 | 0 (0.0%) | 0 (0.0%) |
| $12,500 to $14,999 | 0 (0.0%) | 0 (0.0%) |
| $15,000 to $17,499 | 0 (0.0%) | 0 (0.0%) |
| $17,500 to $19,999 | 4 (9.5%) | 3 (8.3%) |
| $20,000 to $22,499 | 0 (0.0%) | 0 (0.0%) |
| $22,500 to $24,999 | 0 (0.0%) | 0 (0.0%) |
| $25,000 to $29,999 | 0 (0.0%) | 1 (2.8%) |
| $30,000 to $34,999 | 16 (38.1%) | 4 (11.1%) |
| $35,000 to $39,999 | 0 (0.0%) | 6 (16.7%) |
| $40,000 to $44,999 | 6 (14.3%) | 1 (2.8%) |
| $45,000 to $49,999 | 0 (0.0%) | 0 (0.0%) |
| $50,000 to $54,999 | 2 (4.8%) | 0 (0.0%) |
| $55,000 to $64,999 | 0 (0.0%) | 6 (16.7%) |
| $65,000 to $74,999 | 14 (33.3%) | 1 (2.8%) |
| $75,000 to $99,999 | 0 (0.0%) | 9 (25.0%) |
| $100,000+ | 0 (0.0%) | 0 (0.0%) |
| Total | 42 (100.0%) | 36 (100.0%) |
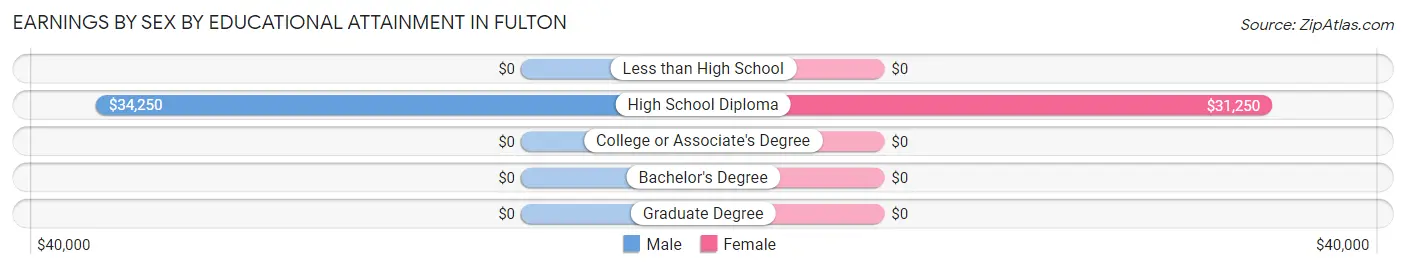
Earnings by Sex by Educational Attainment in Fulton
| Educational Attainment | Male Income | Female Income |
| Less than High School | - | - |
| High School Diploma | $34,250 | $31,250 |
| College or Associate's Degree | - | - |
| Bachelor's Degree | - | - |
| Graduate Degree | - | - |
| Total | $40,417 | $0 |
Family Income in Fulton
Family Income Brackets in Fulton
According to the Fulton family income data, there are 26 families falling into the $35,000 to $49,999 income range, which is the most common income bracket and makes up 37.7% of all families.
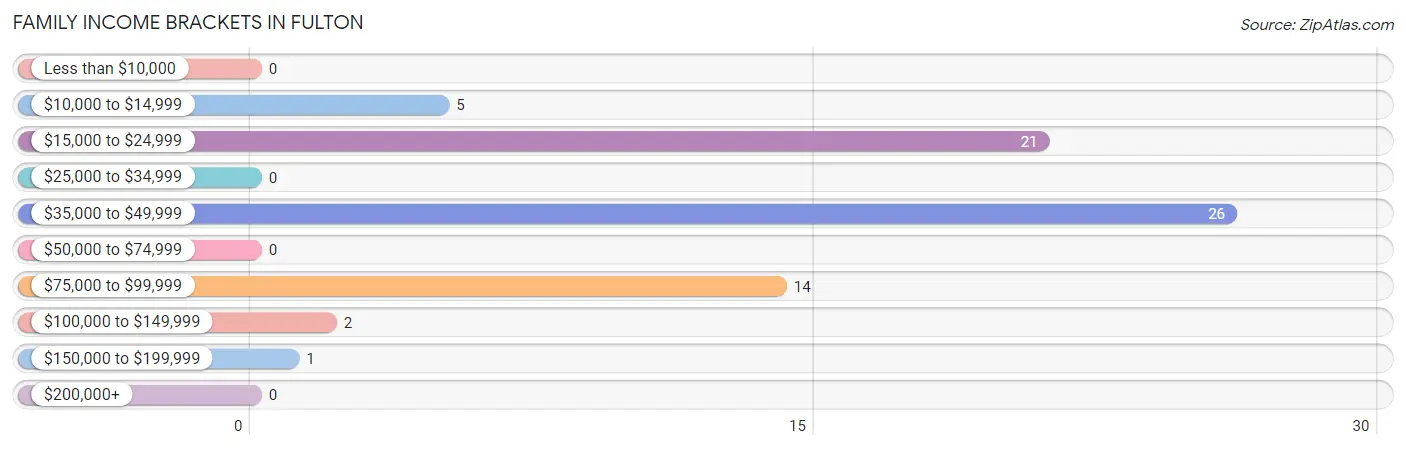
| Income Bracket | # Families | % Families |
| Less than $10,000 | 0 | 0.0% |
| $10,000 to $14,999 | 5 | 7.2% |
| $15,000 to $24,999 | 21 | 30.4% |
| $25,000 to $34,999 | 0 | 0.0% |
| $35,000 to $49,999 | 26 | 37.7% |
| $50,000 to $74,999 | 0 | 0.0% |
| $75,000 to $99,999 | 14 | 20.3% |
| $100,000 to $149,999 | 2 | 2.9% |
| $150,000 to $199,999 | 1 | 1.4% |
| $200,000+ | 0 | 0.0% |
Family Income by Famaliy Size in Fulton
2-person families (61 | 88.4%) account for the highest median family income in Fulton with $35,938 per family, while 2-person families (61 | 88.4%) have the highest median income of $17,969 per family member.
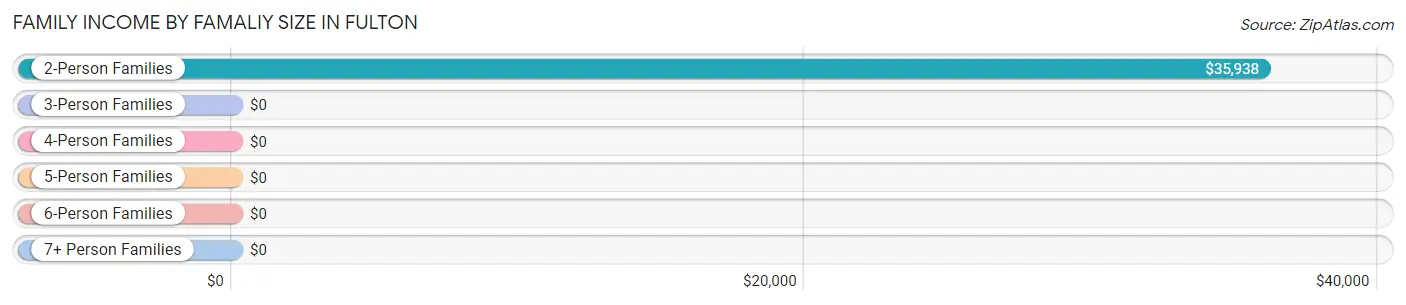
| Income Bracket | # Families | Median Income |
| 2-Person Families | 61 (88.4%) | $35,938 |
| 3-Person Families | 7 (10.1%) | $0 |
| 4-Person Families | 0 (0.0%) | $0 |
| 5-Person Families | 1 (1.5%) | $0 |
| 6-Person Families | 0 (0.0%) | $0 |
| 7+ Person Families | 0 (0.0%) | $0 |
| Total | 69 (100.0%) | $36,250 |
Family Income by Number of Earners in Fulton
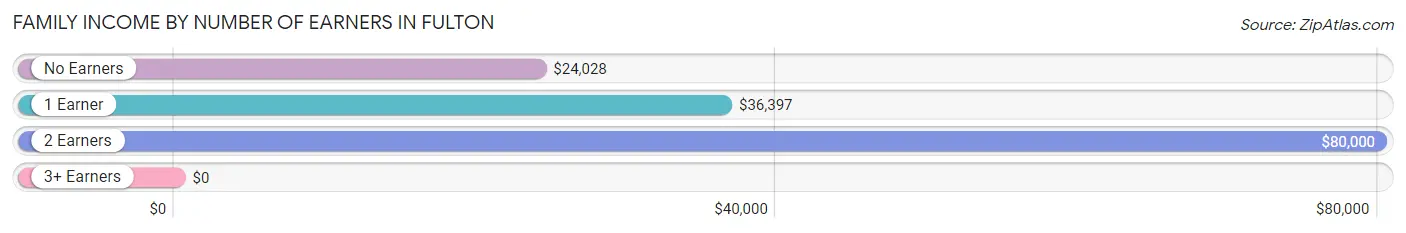
| Number of Earners | # Families | Median Income |
| No Earners | 32 (46.4%) | $24,028 |
| 1 Earner | 25 (36.2%) | $36,397 |
| 2 Earners | 12 (17.4%) | $80,000 |
| 3+ Earners | 0 (0.0%) | $0 |
| Total | 69 (100.0%) | $36,250 |
Household Income in Fulton
Household Income Brackets in Fulton
With 26 households falling in the category, the $35,000 to $49,999 income range is the most frequent in Fulton, accounting for 24.3% of all households.
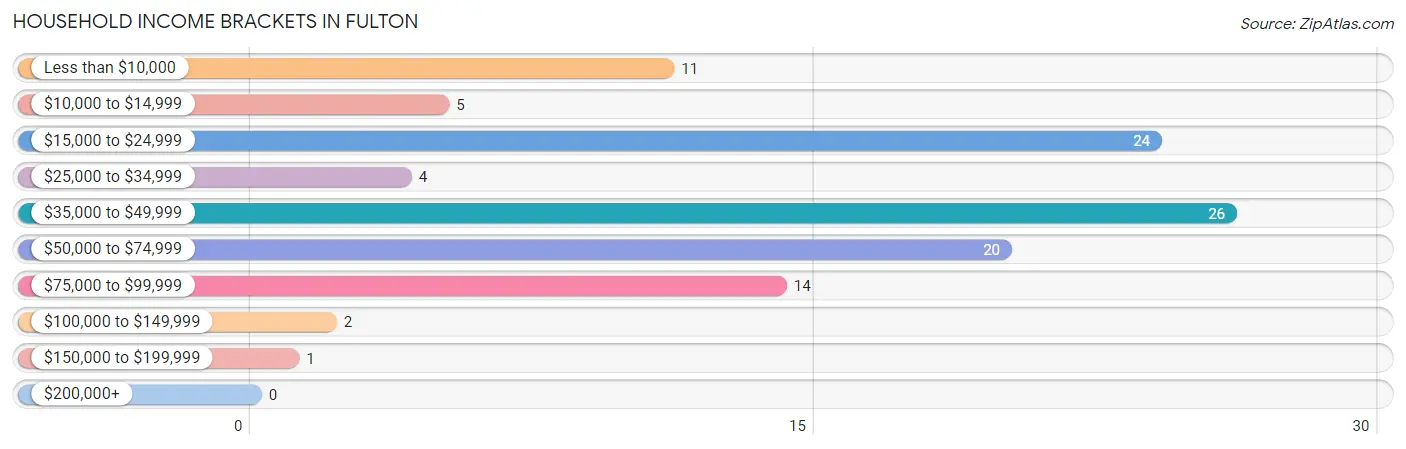
| Income Bracket | # Households | % Households |
| Less than $10,000 | 11 | 10.3% |
| $10,000 to $14,999 | 5 | 4.7% |
| $15,000 to $24,999 | 24 | 22.4% |
| $25,000 to $34,999 | 4 | 3.7% |
| $35,000 to $49,999 | 26 | 24.3% |
| $50,000 to $74,999 | 20 | 18.7% |
| $75,000 to $99,999 | 14 | 13.1% |
| $100,000 to $149,999 | 2 | 1.9% |
| $150,000 to $199,999 | 1 | 0.9% |
| $200,000+ | 0 | 0.0% |
Household Income by Householder Age in Fulton
The median household income in Fulton is $36,397, with the highest median household income of $43,611 found in the 65+ years age bracket for the primary householder. A total of 44 households (41.1%) fall into this category.
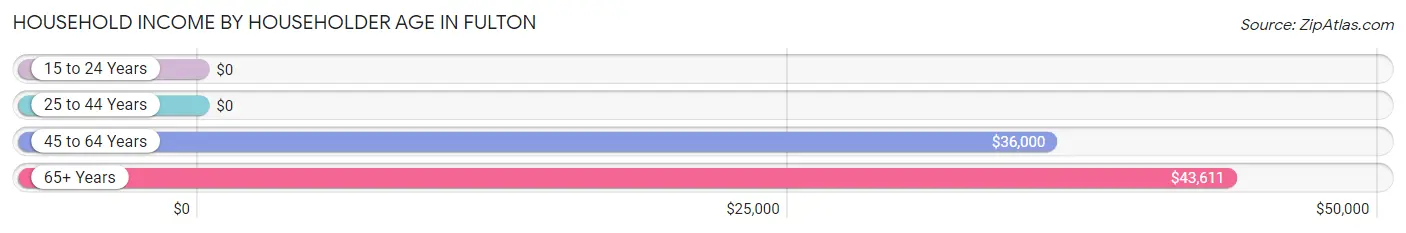
| Income Bracket | # Households | Median Income |
| 15 to 24 Years | 0 (0.0%) | $0 |
| 25 to 44 Years | 5 (4.7%) | $0 |
| 45 to 64 Years | 58 (54.2%) | $36,000 |
| 65+ Years | 44 (41.1%) | $43,611 |
| Total | 107 (100.0%) | $36,397 |
Poverty in Fulton
Income Below Poverty by Sex and Age in Fulton
With 13.5% poverty level for males and 8.4% for females among the residents of Fulton, 35 to 44 year old males and 35 to 44 year old females are the most vulnerable to poverty, with 6 males (60.0%) and 5 females (35.7%) in their respective age groups living below the poverty level.
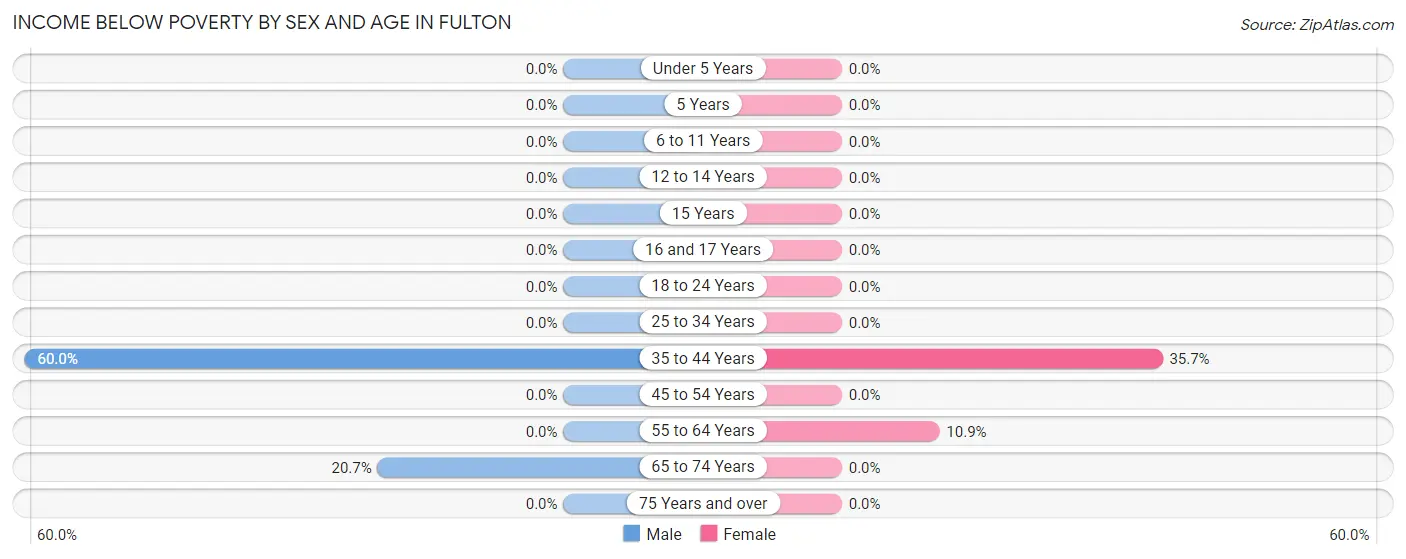
| Age Bracket | Male | Female |
| Under 5 Years | 0 (0.0%) | 0 (0.0%) |
| 5 Years | 0 (0.0%) | 0 (0.0%) |
| 6 to 11 Years | 0 (0.0%) | 0 (0.0%) |
| 12 to 14 Years | 0 (0.0%) | 0 (0.0%) |
| 15 Years | 0 (0.0%) | 0 (0.0%) |
| 16 and 17 Years | 0 (0.0%) | 0 (0.0%) |
| 18 to 24 Years | 0 (0.0%) | 0 (0.0%) |
| 25 to 34 Years | 0 (0.0%) | 0 (0.0%) |
| 35 to 44 Years | 6 (60.0%) | 5 (35.7%) |
| 45 to 54 Years | 0 (0.0%) | 0 (0.0%) |
| 55 to 64 Years | 0 (0.0%) | 5 (10.9%) |
| 65 to 74 Years | 6 (20.7%) | 0 (0.0%) |
| 75 Years and over | 0 (0.0%) | 0 (0.0%) |
| Total | 12 (13.5%) | 10 (8.4%) |
Income Above Poverty by Sex and Age in Fulton
According to the poverty statistics in Fulton, males aged 18 to 24 years and females aged 6 to 11 years are the age groups that are most secure financially, with 100.0% of males and 100.0% of females in these age groups living above the poverty line.
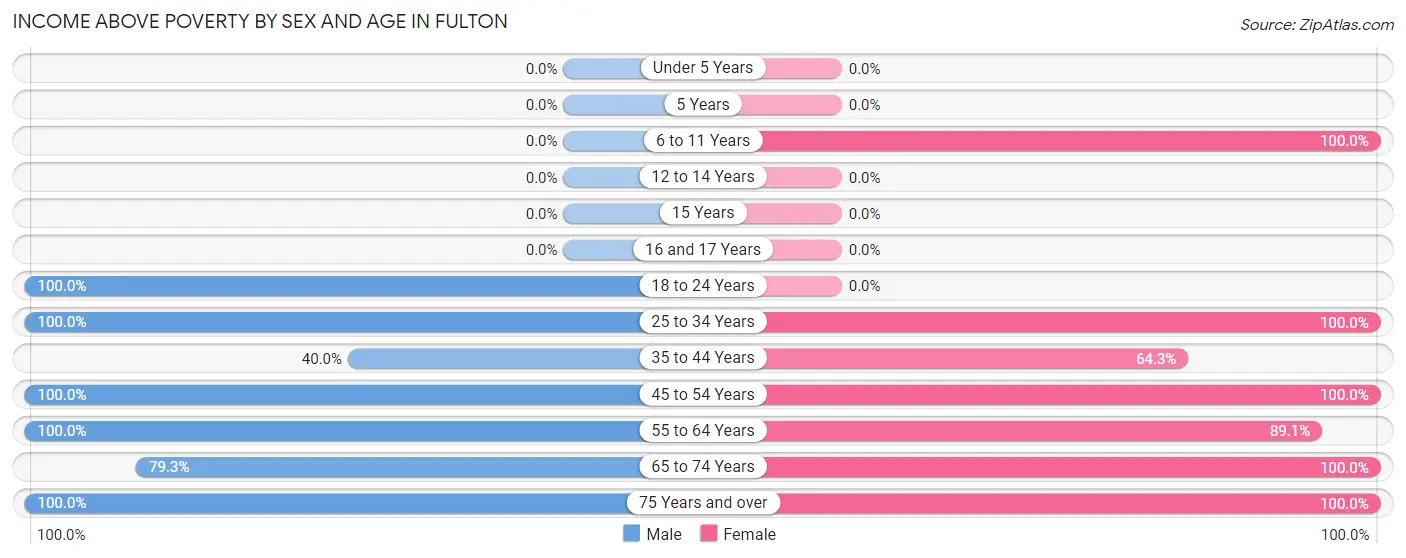
| Age Bracket | Male | Female |
| Under 5 Years | 0 (0.0%) | 0 (0.0%) |
| 5 Years | 0 (0.0%) | 0 (0.0%) |
| 6 to 11 Years | 0 (0.0%) | 8 (100.0%) |
| 12 to 14 Years | 0 (0.0%) | 0 (0.0%) |
| 15 Years | 0 (0.0%) | 0 (0.0%) |
| 16 and 17 Years | 0 (0.0%) | 0 (0.0%) |
| 18 to 24 Years | 10 (100.0%) | 0 (0.0%) |
| 25 to 34 Years | 2 (100.0%) | 4 (100.0%) |
| 35 to 44 Years | 4 (40.0%) | 9 (64.3%) |
| 45 to 54 Years | 9 (100.0%) | 20 (100.0%) |
| 55 to 64 Years | 16 (100.0%) | 41 (89.1%) |
| 65 to 74 Years | 23 (79.3%) | 14 (100.0%) |
| 75 Years and over | 13 (100.0%) | 13 (100.0%) |
| Total | 77 (86.5%) | 109 (91.6%) |
Income Below Poverty Among Married-Couple Families in Fulton
The poverty statistics for married-couple families in Fulton show that 12.2% or 5 of the total 41 families live below the poverty line. Families with no children have the highest poverty rate of 12.5%, comprising of 5 families. On the other hand, families with 1 or 2 children have the lowest poverty rate of 0.0%, which includes 0 families.
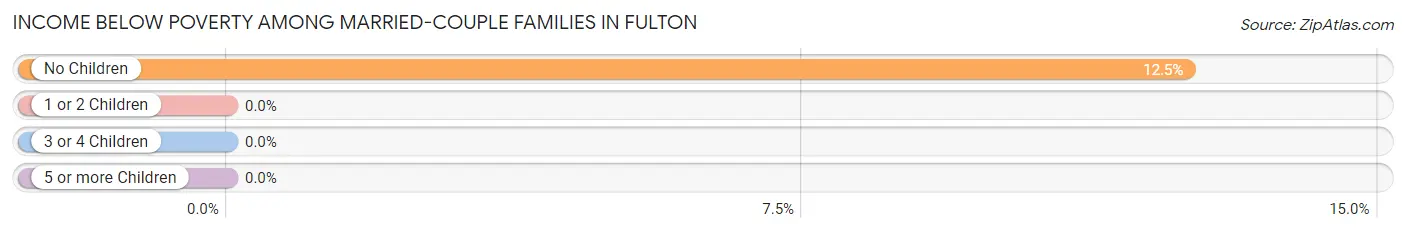
| Children | Above Poverty | Below Poverty |
| No Children | 35 (87.5%) | 5 (12.5%) |
| 1 or 2 Children | 1 (100.0%) | 0 (0.0%) |
| 3 or 4 Children | 0 (0.0%) | 0 (0.0%) |
| 5 or more Children | 0 (0.0%) | 0 (0.0%) |
| Total | 36 (87.8%) | 5 (12.2%) |
Income Below Poverty Among Single-Parent Households in Fulton
| Children | Single Father | Single Mother |
| No Children | 0 (0.0%) | 0 (0.0%) |
| 1 or 2 Children | 0 (0.0%) | 0 (0.0%) |
| 3 or 4 Children | 0 (0.0%) | 0 (0.0%) |
| 5 or more Children | 0 (0.0%) | 0 (0.0%) |
| Total | 0 (0.0%) | 0 (0.0%) |
Income Below Poverty Among Married-Couple vs Single-Parent Households in Fulton
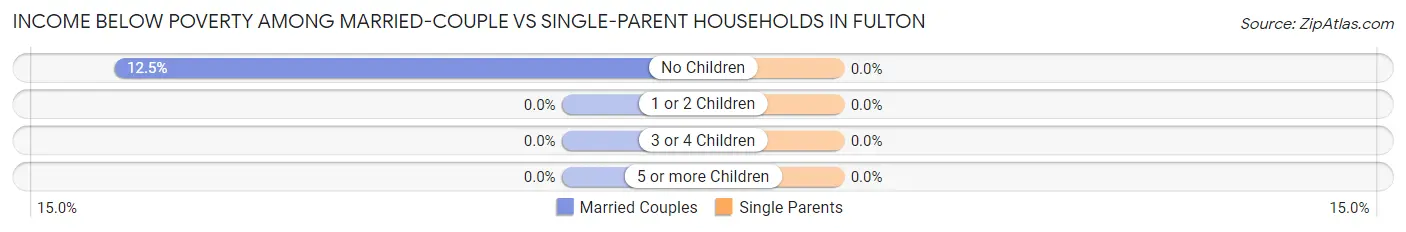
| Children | Married-Couple Families | Single-Parent Households |
| No Children | 5 (12.5%) | 0 (0.0%) |
| 1 or 2 Children | 0 (0.0%) | 0 (0.0%) |
| 3 or 4 Children | 0 (0.0%) | 0 (0.0%) |
| 5 or more Children | 0 (0.0%) | 0 (0.0%) |
| Total | 5 (12.2%) | 0 (0.0%) |
Race in Fulton
The most populous races in Fulton are Black / African American (113 | 54.3%), and White / Caucasian (95 | 45.7%).
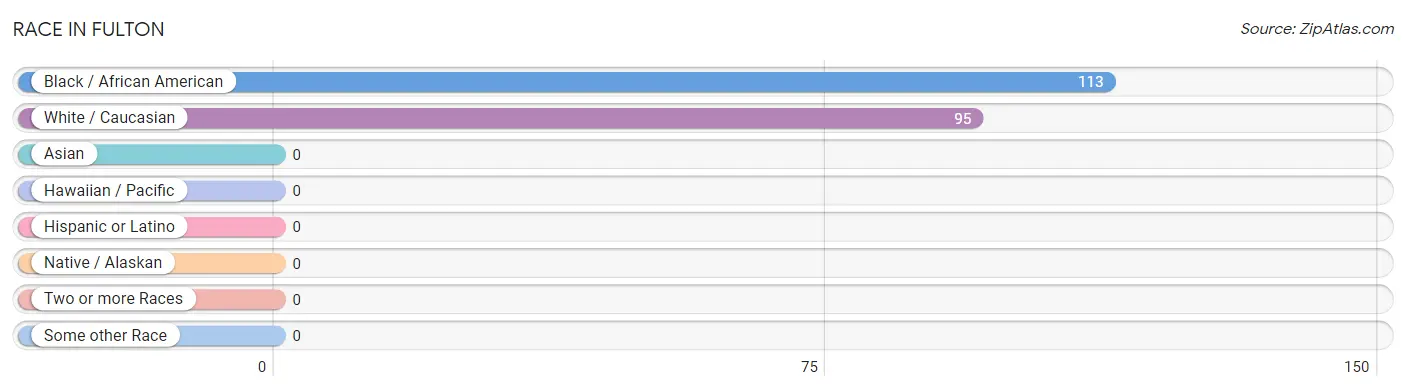
| Race | # Population | % Population |
| Asian | 0 | 0.0% |
| Black / African American | 113 | 54.3% |
| Hawaiian / Pacific | 0 | 0.0% |
| Hispanic or Latino | 0 | 0.0% |
| Native / Alaskan | 0 | 0.0% |
| White / Caucasian | 95 | 45.7% |
| Two or more Races | 0 | 0.0% |
| Some other Race | 0 | 0.0% |
| Total | 208 | 100.0% |
Ancestry in Fulton
The most populous ancestries reported in Fulton are Irish (48 | 23.1%), English (13 | 6.2%), African (9 | 4.3%), Subsaharan African (9 | 4.3%), and Scotch-Irish (7 | 3.4%), together accounting for 41.4% of all Fulton residents.
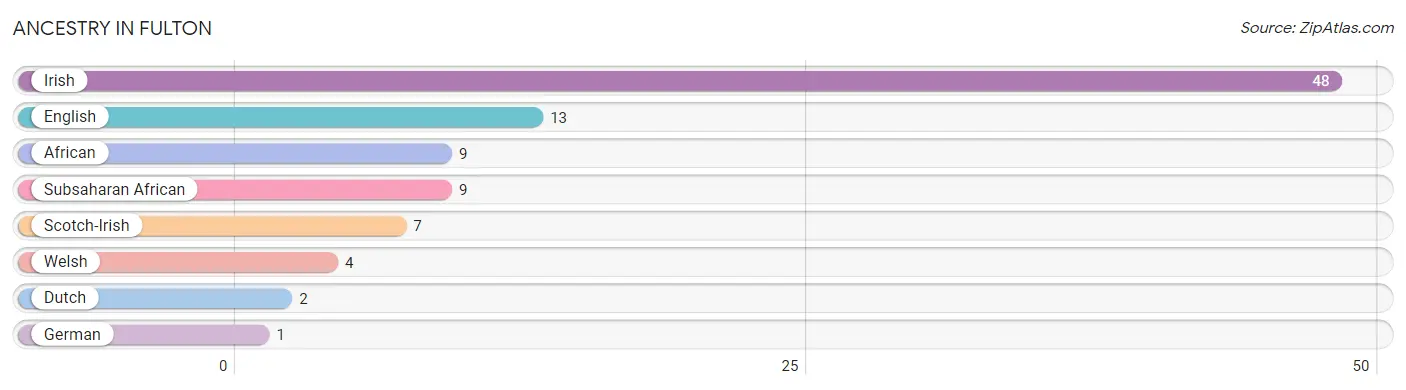
| Ancestry | # Population | % Population |
| African | 9 | 4.3% |
| Dutch | 2 | 1.0% |
| English | 13 | 6.2% |
| German | 1 | 0.5% |
| Irish | 48 | 23.1% |
| Scotch-Irish | 7 | 3.4% |
| Subsaharan African | 9 | 4.3% |
| Welsh | 4 | 1.9% | View All 8 Rows |
Immigrants in Fulton

| Immigration Origin | # Population | % Population | View All 0 Rows |
Sex and Age in Fulton
Sex and Age in Fulton
The most populous age groups in Fulton are 65 to 69 Years (26 | 29.2%) for men and 55 to 59 Years (36 | 30.2%) for women.
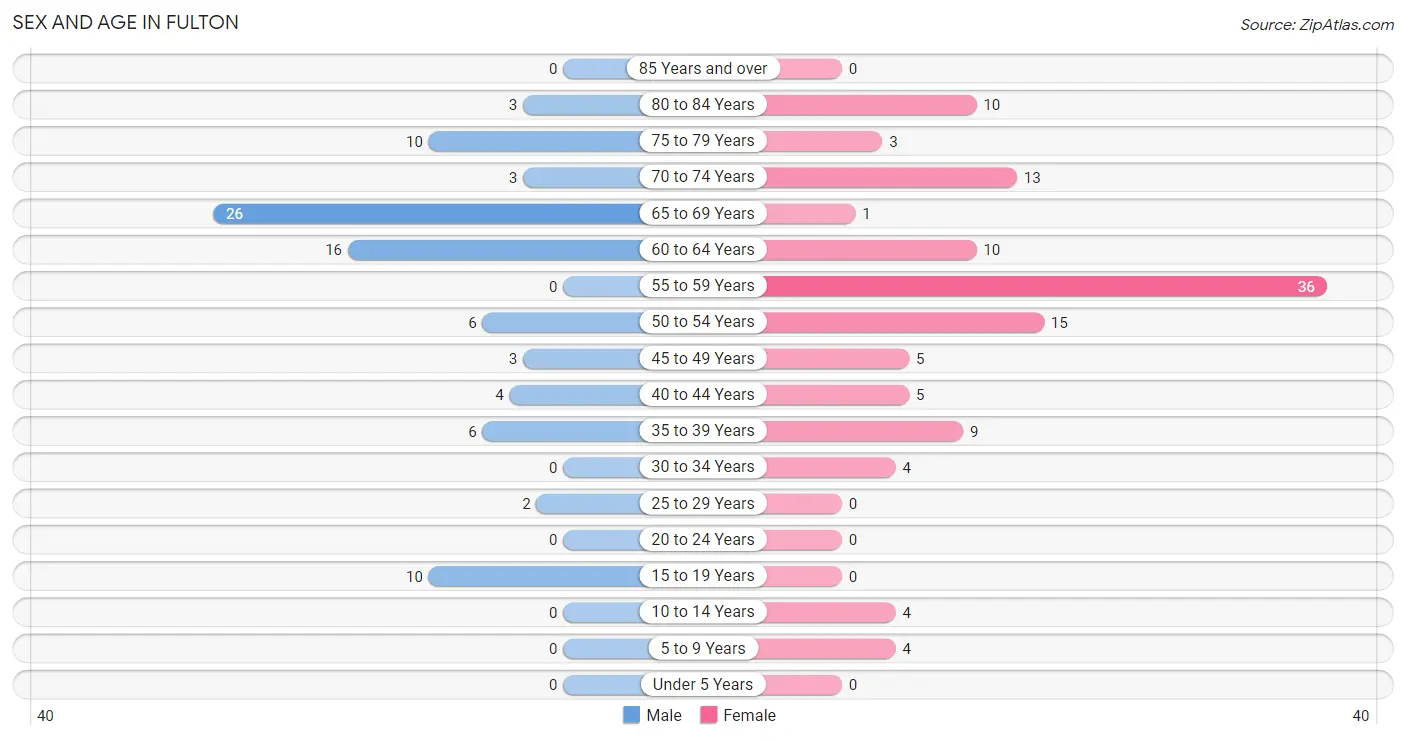
| Age Bracket | Male | Female |
| Under 5 Years | 0 (0.0%) | 0 (0.0%) |
| 5 to 9 Years | 0 (0.0%) | 4 (3.4%) |
| 10 to 14 Years | 0 (0.0%) | 4 (3.4%) |
| 15 to 19 Years | 10 (11.2%) | 0 (0.0%) |
| 20 to 24 Years | 0 (0.0%) | 0 (0.0%) |
| 25 to 29 Years | 2 (2.2%) | 0 (0.0%) |
| 30 to 34 Years | 0 (0.0%) | 4 (3.4%) |
| 35 to 39 Years | 6 (6.7%) | 9 (7.6%) |
| 40 to 44 Years | 4 (4.5%) | 5 (4.2%) |
| 45 to 49 Years | 3 (3.4%) | 5 (4.2%) |
| 50 to 54 Years | 6 (6.7%) | 15 (12.6%) |
| 55 to 59 Years | 0 (0.0%) | 36 (30.2%) |
| 60 to 64 Years | 16 (18.0%) | 10 (8.4%) |
| 65 to 69 Years | 26 (29.2%) | 1 (0.8%) |
| 70 to 74 Years | 3 (3.4%) | 13 (10.9%) |
| 75 to 79 Years | 10 (11.2%) | 3 (2.5%) |
| 80 to 84 Years | 3 (3.4%) | 10 (8.4%) |
| 85 Years and over | 0 (0.0%) | 0 (0.0%) |
| Total | 89 (100.0%) | 119 (100.0%) |
Families and Households in Fulton
Median Family Size in Fulton
The median family size in Fulton is 2.46 persons per family, with married-couple families (41 | 59.4%) accounting for the largest median family size of 2.73 persons per family. On the other hand, single male/father families (2 | 2.9%) represent the smallest median family size with 2.00 persons per family.
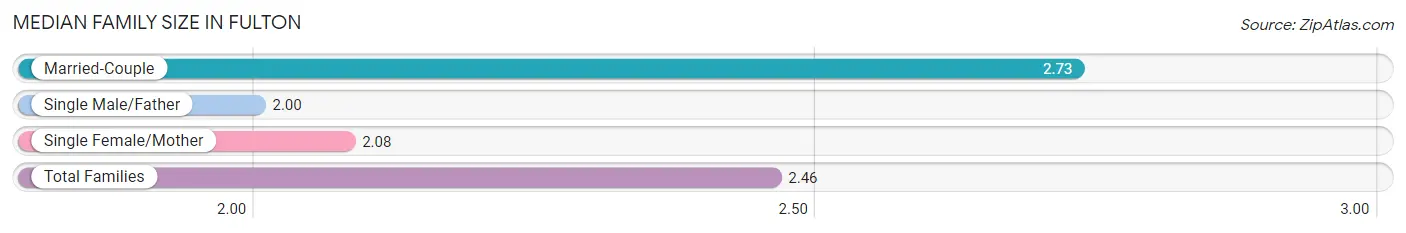
| Family Type | # Families | Family Size |
| Married-Couple | 41 (59.4%) | 2.73 |
| Single Male/Father | 2 (2.9%) | 2.00 |
| Single Female/Mother | 26 (37.7%) | 2.08 |
| Total Families | 69 (100.0%) | 2.46 |
Median Household Size in Fulton
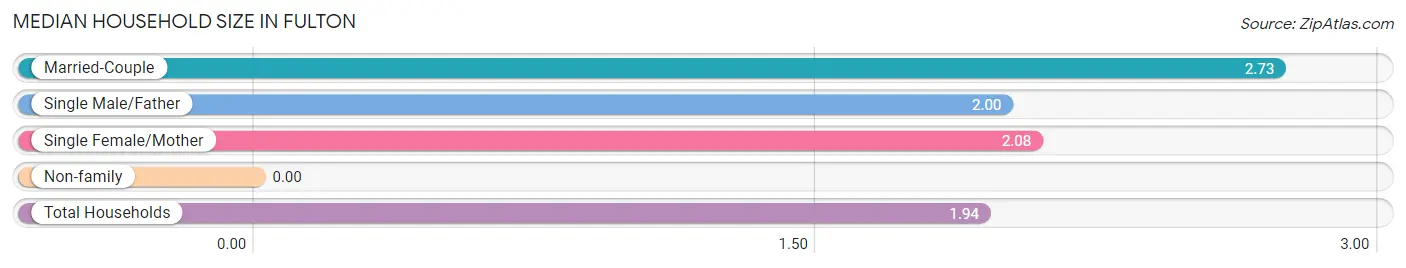
| Household Type | # Households | Household Size |
| Married-Couple | 41 (38.3%) | 2.73 |
| Single Male/Father | 2 (1.9%) | 2.00 |
| Single Female/Mother | 26 (24.3%) | 2.08 |
| Non-family | 38 (35.5%) | - |
| Total Households | 107 (100.0%) | 1.94 |
Household Size by Marriage Status in Fulton
Out of a total of 107 households in Fulton, 69 (64.5%) are family households, while 38 (35.5%) are nonfamily households. The most numerous type of family households are 2-person households, comprising 61, and the most common type of nonfamily households are 1-person households, comprising 38.
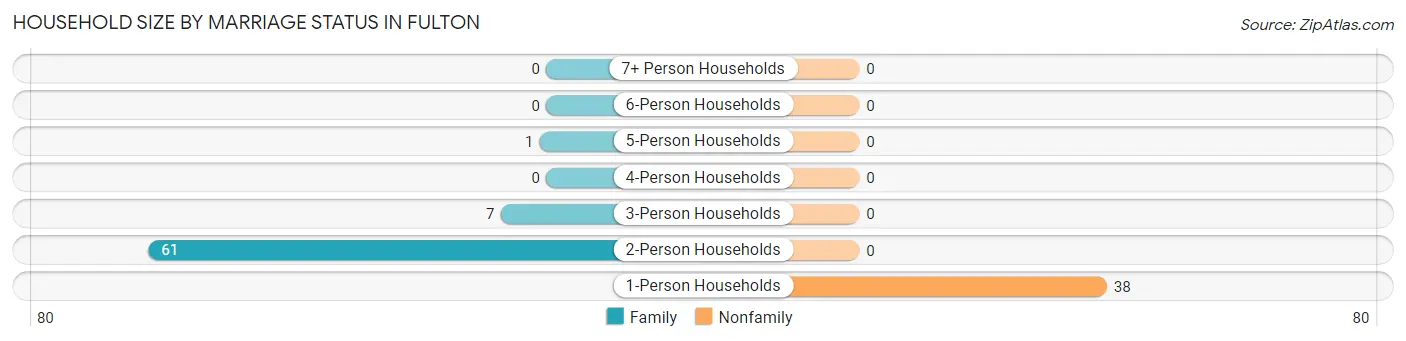
| Household Size | Family Households | Nonfamily Households |
| 1-Person Households | - | 38 (35.5%) |
| 2-Person Households | 61 (57.0%) | 0 (0.0%) |
| 3-Person Households | 7 (6.5%) | 0 (0.0%) |
| 4-Person Households | 0 (0.0%) | 0 (0.0%) |
| 5-Person Households | 1 (0.9%) | 0 (0.0%) |
| 6-Person Households | 0 (0.0%) | 0 (0.0%) |
| 7+ Person Households | 0 (0.0%) | 0 (0.0%) |
| Total | 69 (64.5%) | 38 (35.5%) |
Female Fertility in Fulton
Fertility by Age in Fulton
| Age Bracket | Women with Births | Births / 1,000 Women |
| 15 to 19 years | 0 (0.0%) | 0.0 |
| 20 to 34 years | 0 (0.0%) | 0.0 |
| 35 to 50 years | 0 (0.0%) | 0.0 |
| Total | 0 (0.0%) | 0.0 |
Fertility by Age by Marriage Status in Fulton
| Age Bracket | Married | Unmarried |
| 15 to 19 years | 0 (0.0%) | 0 (0.0%) |
| 20 to 34 years | 0 (0.0%) | 0 (0.0%) |
| 35 to 50 years | 0 (0.0%) | 0 (0.0%) |
| Total | 0 (0.0%) | 0 (0.0%) |
Fertility by Education in Fulton
| Educational Attainment | Women with Births | Births / 1,000 Women |
| Less than High School | 0 (0.0%) | 0.0 |
| High School Diploma | 0 (0.0%) | 0.0 |
| College or Associate's Degree | 0 (0.0%) | 0.0 |
| Bachelor's Degree | 0 (0.0%) | 0.0 |
| Graduate Degree | 0 (0.0%) | 0.0 |
| Total | 0 (0.0%) | 0.0 |
Fertility by Education by Marriage Status in Fulton
| Educational Attainment | Married | Unmarried |
| Less than High School | 0 (0.0%) | 0 (0.0%) |
| High School Diploma | 0 (0.0%) | 0 (0.0%) |
| College or Associate's Degree | 0 (0.0%) | 0 (0.0%) |
| Bachelor's Degree | 0 (0.0%) | 0 (0.0%) |
| Graduate Degree | 0 (0.0%) | 0 (0.0%) |
| Total | 0 (0.0%) | 0 (0.0%) |
Employment Characteristics in Fulton
Employment by Class of Employer in Fulton
Among the 76 employed individuals in Fulton, private company employees (36 | 47.4%), state government employees (20 | 26.3%), and local government employees (12 | 15.8%) make up the most common classes of employment.
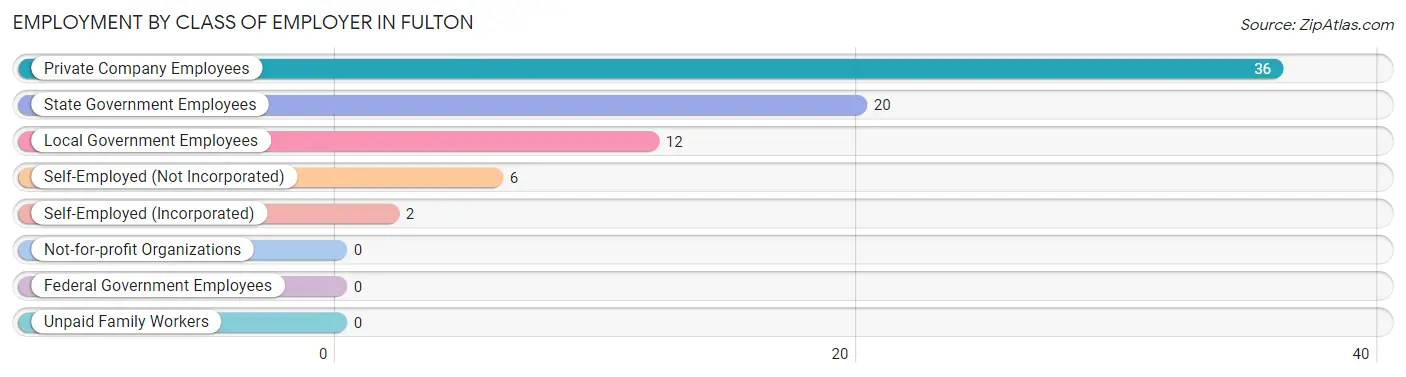
| Employer Class | # Employees | % Employees |
| Private Company Employees | 36 | 47.4% |
| Self-Employed (Incorporated) | 2 | 2.6% |
| Self-Employed (Not Incorporated) | 6 | 7.9% |
| Not-for-profit Organizations | 0 | 0.0% |
| Local Government Employees | 12 | 15.8% |
| State Government Employees | 20 | 26.3% |
| Federal Government Employees | 0 | 0.0% |
| Unpaid Family Workers | 0 | 0.0% |
| Total | 76 | 100.0% |
Employment Status by Age in Fulton
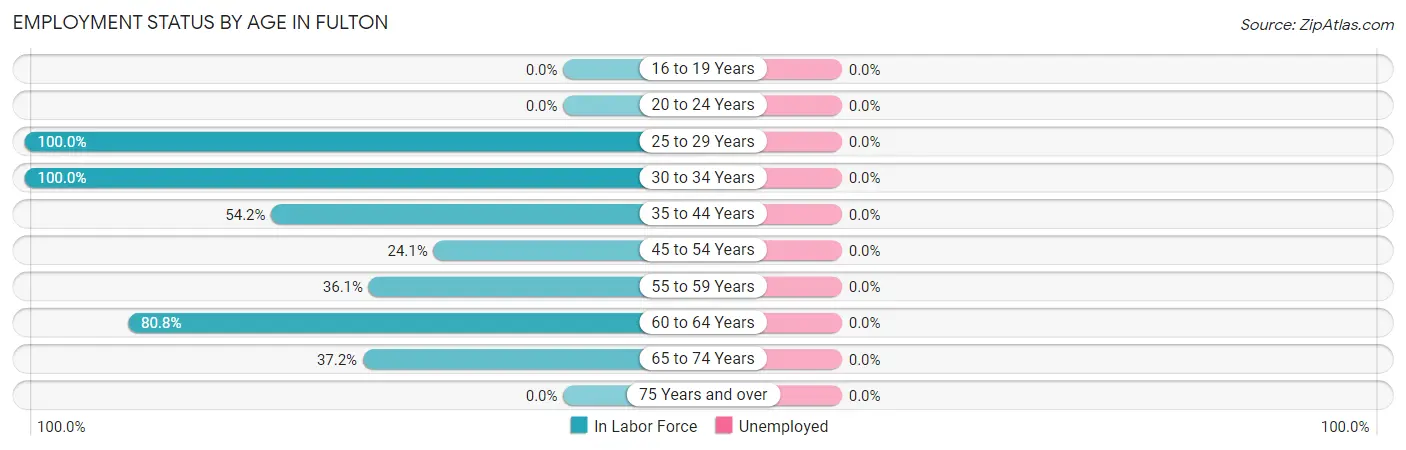
| Age Bracket | In Labor Force | Unemployed |
| 16 to 19 Years | 0 (0.0%) | 0 (0.0%) |
| 20 to 24 Years | 0 (0.0%) | 0 (0.0%) |
| 25 to 29 Years | 2 (100.0%) | 0 (0.0%) |
| 30 to 34 Years | 4 (100.0%) | 0 (0.0%) |
| 35 to 44 Years | 13 (54.2%) | 0 (0.0%) |
| 45 to 54 Years | 7 (24.1%) | 0 (0.0%) |
| 55 to 59 Years | 13 (36.1%) | 0 (0.0%) |
| 60 to 64 Years | 21 (80.8%) | 0 (0.0%) |
| 65 to 74 Years | 16 (37.2%) | 0 (0.0%) |
| 75 Years and over | 0 (0.0%) | 0 (0.0%) |
| Total | 76 (38.0%) | 0 (0.0%) |
Employment Status by Educational Attainment in Fulton
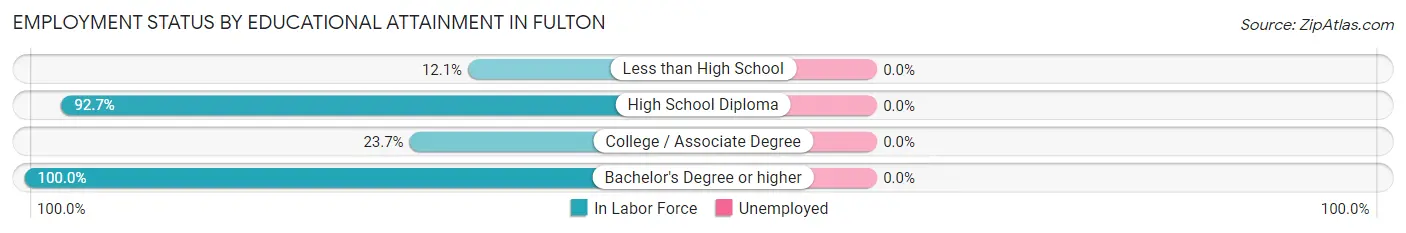
| Educational Attainment | In Labor Force | Unemployed |
| Less than High School | 4 (12.1%) | 0 (0.0%) |
| High School Diploma | 38 (92.7%) | 0 (0.0%) |
| College / Associate Degree | 9 (23.7%) | 0 (0.0%) |
| Bachelor's Degree or higher | 9 (100.0%) | 0 (0.0%) |
| Total | 60 (49.6%) | 0 (0.0%) |
Employment Occupations by Sex in Fulton
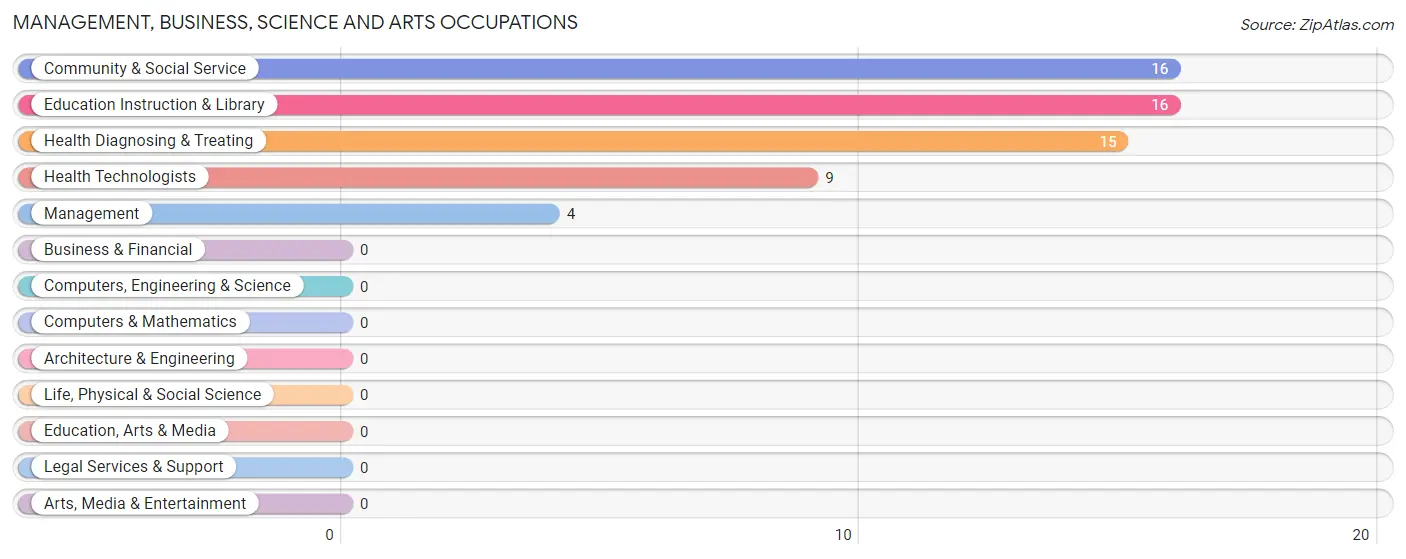
Management, Business, Science and Arts Occupations
The most common Management, Business, Science and Arts occupations in Fulton are Community & Social Service (16 | 21.0%), Education Instruction & Library (16 | 21.0%), Health Diagnosing & Treating (15 | 19.7%), Health Technologists (9 | 11.8%), and Management (4 | 5.3%).
Management, Business, Science and Arts Occupations by Sex
Within the Management, Business, Science and Arts occupations in Fulton, the most male-oriented occupations are Management (100.0%), Community & Social Service (87.5%), and Education Instruction & Library (87.5%), while the most female-oriented occupations are Health Diagnosing & Treating (100.0%), Health Technologists (100.0%), and Community & Social Service (12.5%).
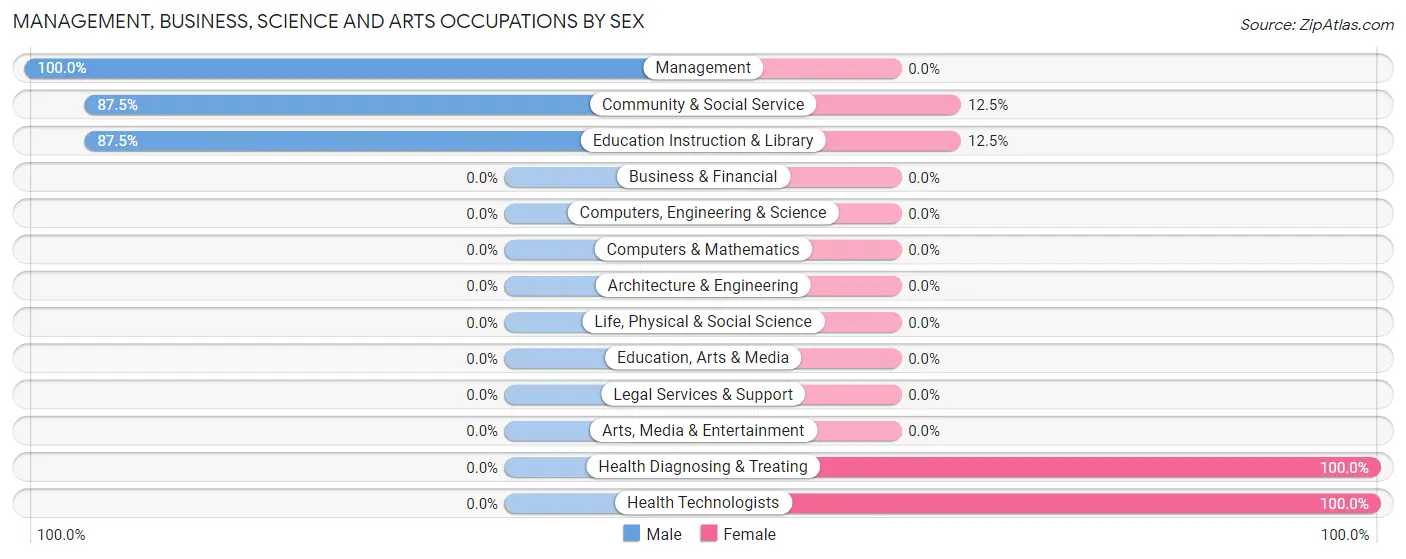
| Occupation | Male | Female |
| Management | 4 (100.0%) | 0 (0.0%) |
| Business & Financial | 0 (0.0%) | 0 (0.0%) |
| Computers, Engineering & Science | 0 (0.0%) | 0 (0.0%) |
| Computers & Mathematics | 0 (0.0%) | 0 (0.0%) |
| Architecture & Engineering | 0 (0.0%) | 0 (0.0%) |
| Life, Physical & Social Science | 0 (0.0%) | 0 (0.0%) |
| Community & Social Service | 14 (87.5%) | 2 (12.5%) |
| Education, Arts & Media | 0 (0.0%) | 0 (0.0%) |
| Legal Services & Support | 0 (0.0%) | 0 (0.0%) |
| Education Instruction & Library | 14 (87.5%) | 2 (12.5%) |
| Arts, Media & Entertainment | 0 (0.0%) | 0 (0.0%) |
| Health Diagnosing & Treating | 0 (0.0%) | 15 (100.0%) |
| Health Technologists | 0 (0.0%) | 9 (100.0%) |
| Total (Category) | 18 (51.4%) | 17 (48.6%) |
| Total (Overall) | 42 (55.3%) | 34 (44.7%) |
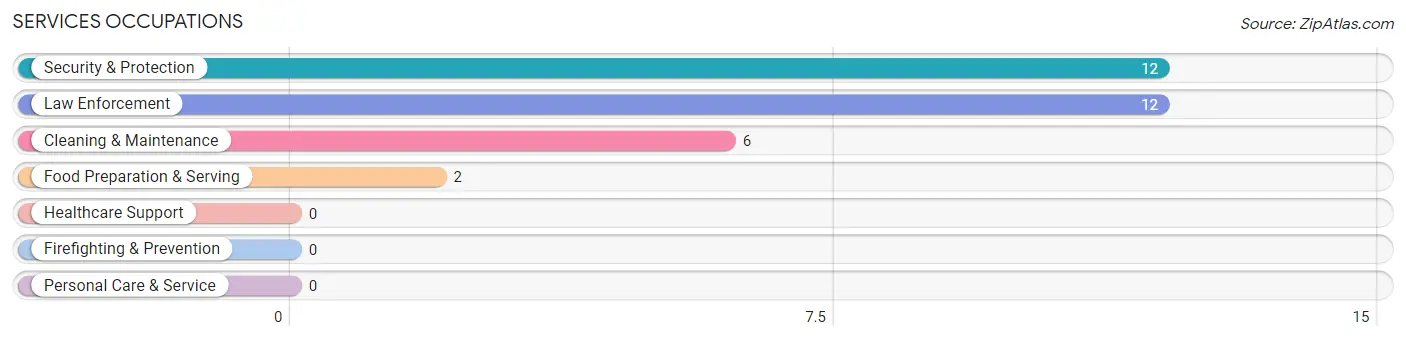
Services Occupations
The most common Services occupations in Fulton are Security & Protection (12 | 15.8%), Law Enforcement (12 | 15.8%), Cleaning & Maintenance (6 | 7.9%), and Food Preparation & Serving (2 | 2.6%).
Services Occupations by Sex
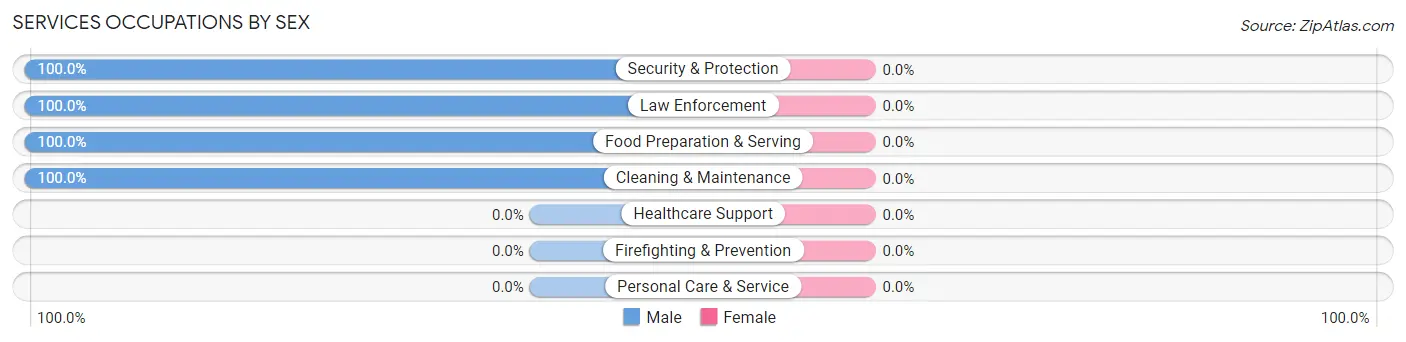
| Occupation | Male | Female |
| Healthcare Support | 0 (0.0%) | 0 (0.0%) |
| Security & Protection | 12 (100.0%) | 0 (0.0%) |
| Firefighting & Prevention | 0 (0.0%) | 0 (0.0%) |
| Law Enforcement | 12 (100.0%) | 0 (0.0%) |
| Food Preparation & Serving | 2 (100.0%) | 0 (0.0%) |
| Cleaning & Maintenance | 6 (100.0%) | 0 (0.0%) |
| Personal Care & Service | 0 (0.0%) | 0 (0.0%) |
| Total (Category) | 20 (100.0%) | 0 (0.0%) |
| Total (Overall) | 42 (55.3%) | 34 (44.7%) |
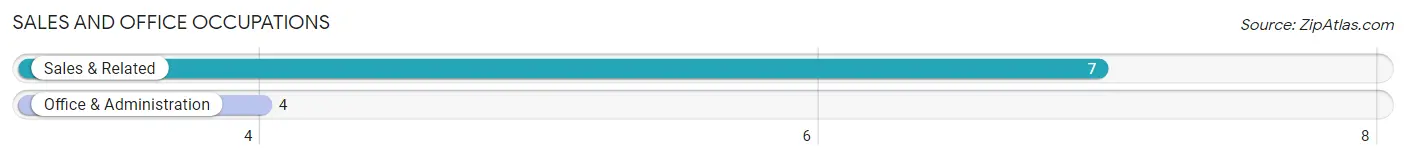
Sales and Office Occupations
The most common Sales and Office occupations in Fulton are Sales & Related (7 | 9.2%), and Office & Administration (4 | 5.3%).
Sales and Office Occupations by Sex

| Occupation | Male | Female |
| Sales & Related | 0 (0.0%) | 7 (100.0%) |
| Office & Administration | 0 (0.0%) | 4 (100.0%) |
| Total (Category) | 0 (0.0%) | 11 (100.0%) |
| Total (Overall) | 42 (55.3%) | 34 (44.7%) |
Natural Resources, Construction and Maintenance Occupations
The most common Natural Resources, Construction and Maintenance occupations in Fulton are , and Farming, Fishing & Forestry (5 | 6.6%).
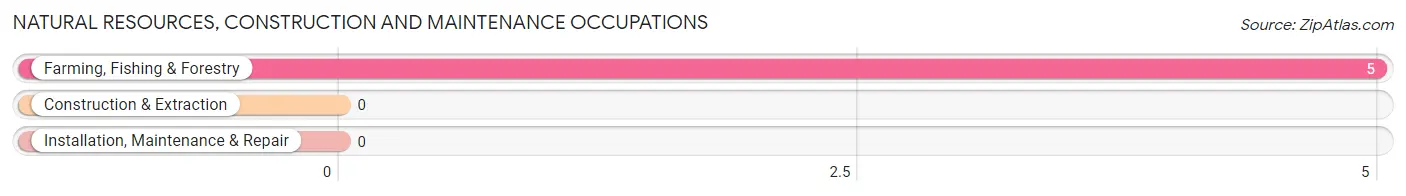
Natural Resources, Construction and Maintenance Occupations by Sex
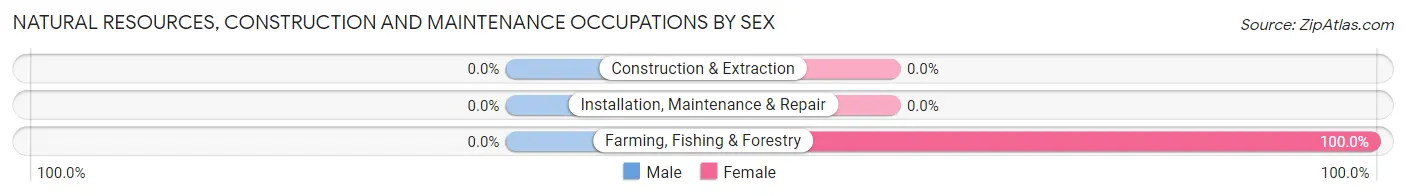
| Occupation | Male | Female |
| Farming, Fishing & Forestry | 0 (0.0%) | 5 (100.0%) |
| Construction & Extraction | 0 (0.0%) | 0 (0.0%) |
| Installation, Maintenance & Repair | 0 (0.0%) | 0 (0.0%) |
| Total (Category) | 0 (0.0%) | 5 (100.0%) |
| Total (Overall) | 42 (55.3%) | 34 (44.7%) |
Production, Transportation and Moving Occupations
The most common Production, Transportation and Moving occupations in Fulton are , and Production (5 | 6.6%).
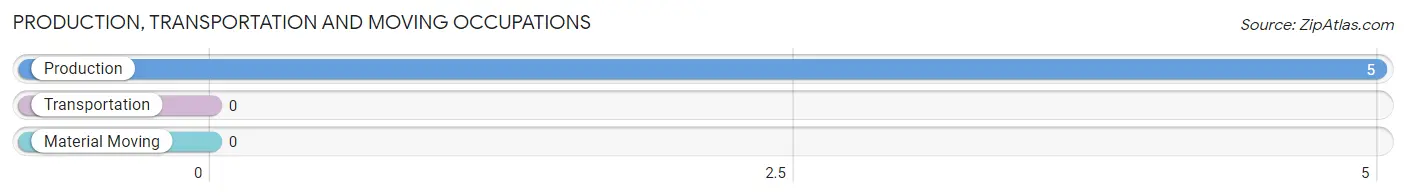
Production, Transportation and Moving Occupations by Sex
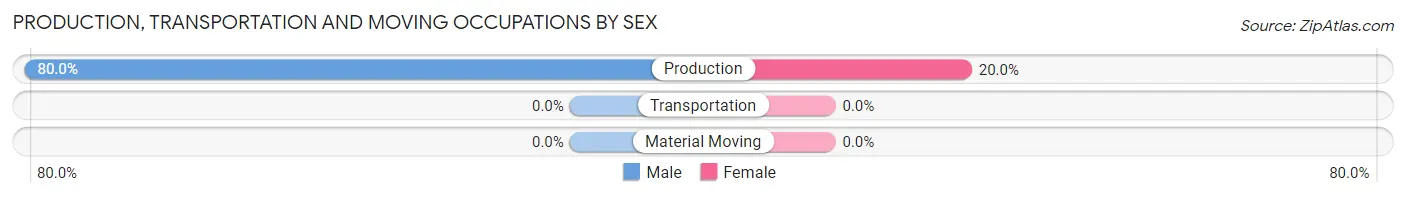
| Occupation | Male | Female |
| Production | 4 (80.0%) | 1 (20.0%) |
| Transportation | 0 (0.0%) | 0 (0.0%) |
| Material Moving | 0 (0.0%) | 0 (0.0%) |
| Total (Category) | 4 (80.0%) | 1 (20.0%) |
| Total (Overall) | 42 (55.3%) | 34 (44.7%) |
Employment Industries by Sex in Fulton
Employment Industries in Fulton
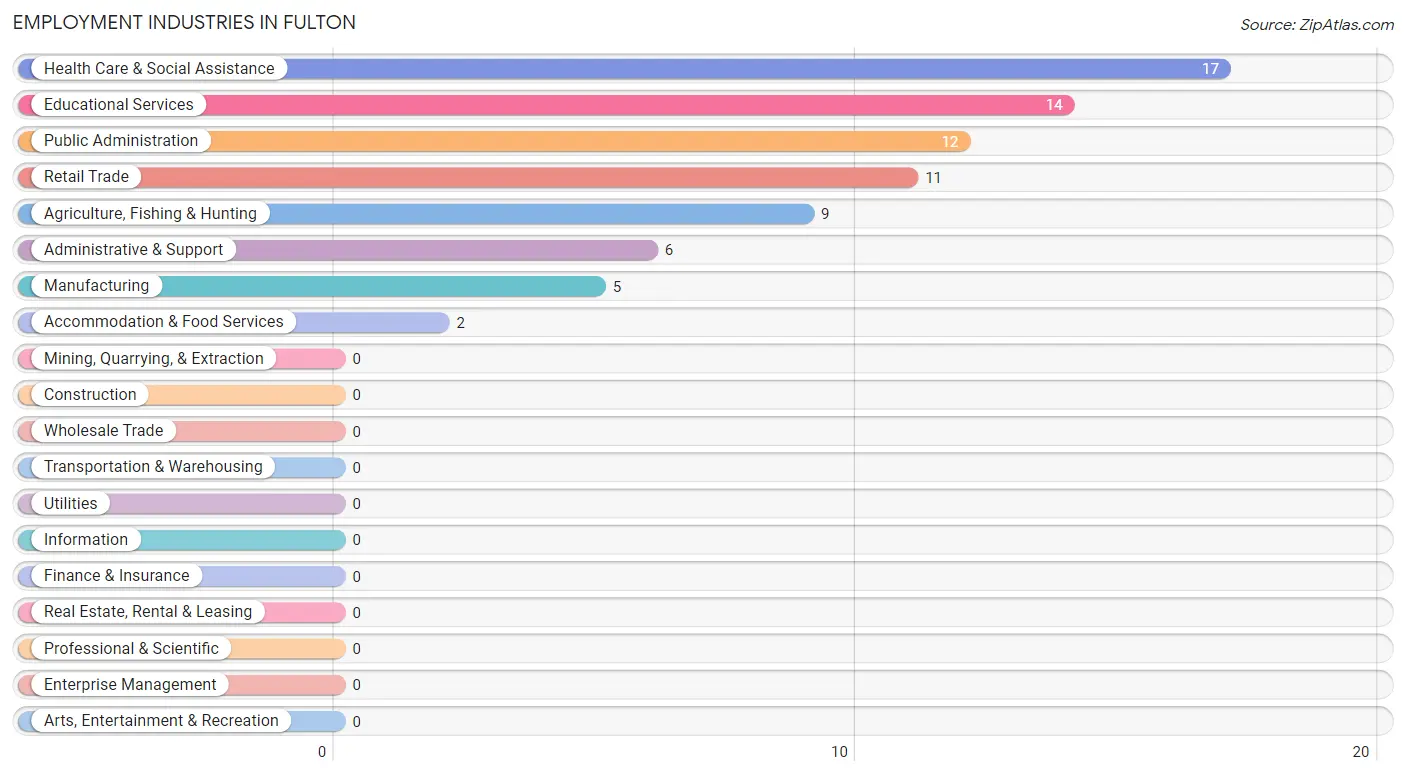
The major employment industries in Fulton include Health Care & Social Assistance (17 | 22.4%), Educational Services (14 | 18.4%), Public Administration (12 | 15.8%), Retail Trade (11 | 14.5%), and Agriculture, Fishing & Hunting (9 | 11.8%).
Employment Industries by Sex in Fulton
The Fulton industries that see more men than women are Administrative & Support (100.0%), Educational Services (100.0%), and Accommodation & Food Services (100.0%), whereas the industries that tend to have a higher number of women are Retail Trade (100.0%), Health Care & Social Assistance (100.0%), and Agriculture, Fishing & Hunting (55.6%).
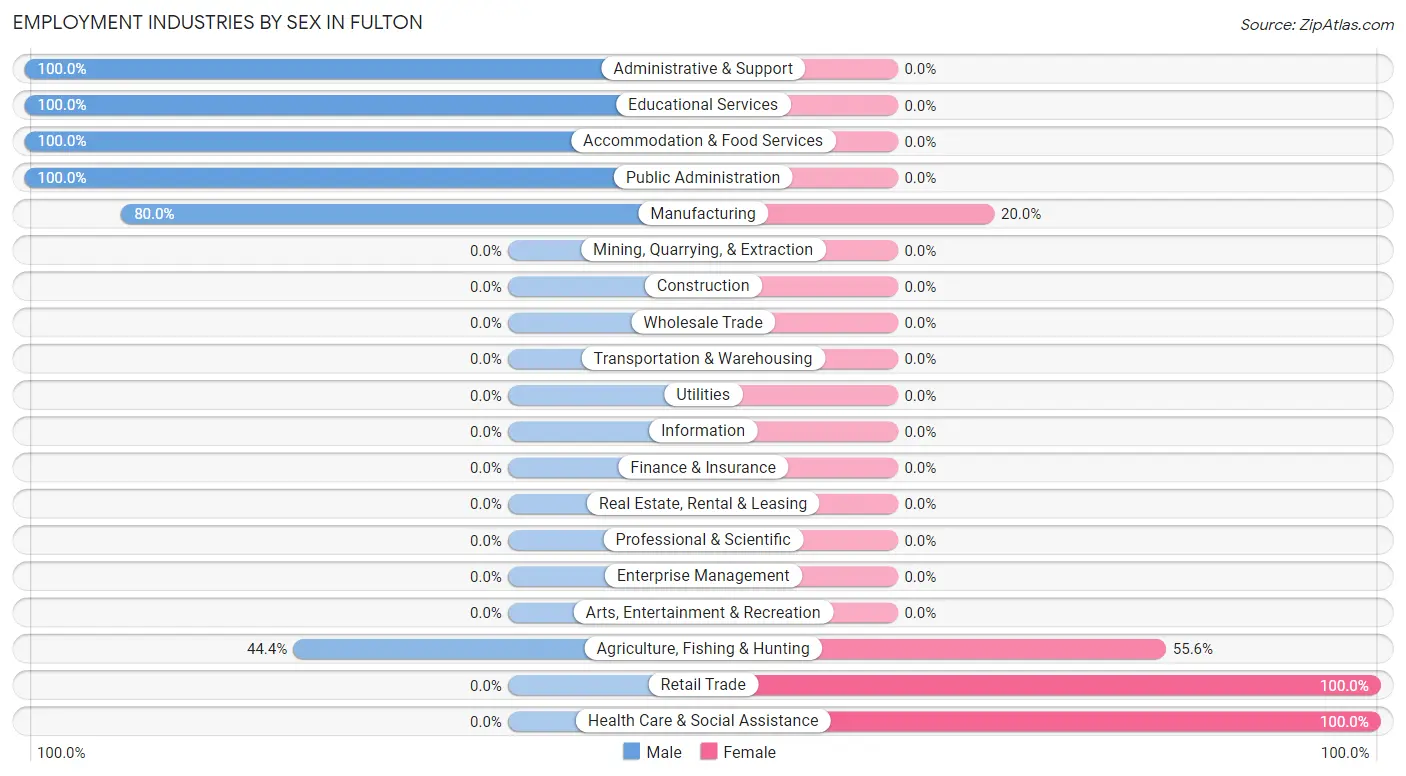
| Industry | Male | Female |
| Agriculture, Fishing & Hunting | 4 (44.4%) | 5 (55.6%) |
| Mining, Quarrying, & Extraction | 0 (0.0%) | 0 (0.0%) |
| Construction | 0 (0.0%) | 0 (0.0%) |
| Manufacturing | 4 (80.0%) | 1 (20.0%) |
| Wholesale Trade | 0 (0.0%) | 0 (0.0%) |
| Retail Trade | 0 (0.0%) | 11 (100.0%) |
| Transportation & Warehousing | 0 (0.0%) | 0 (0.0%) |
| Utilities | 0 (0.0%) | 0 (0.0%) |
| Information | 0 (0.0%) | 0 (0.0%) |
| Finance & Insurance | 0 (0.0%) | 0 (0.0%) |
| Real Estate, Rental & Leasing | 0 (0.0%) | 0 (0.0%) |
| Professional & Scientific | 0 (0.0%) | 0 (0.0%) |
| Enterprise Management | 0 (0.0%) | 0 (0.0%) |
| Administrative & Support | 6 (100.0%) | 0 (0.0%) |
| Educational Services | 14 (100.0%) | 0 (0.0%) |
| Health Care & Social Assistance | 0 (0.0%) | 17 (100.0%) |
| Arts, Entertainment & Recreation | 0 (0.0%) | 0 (0.0%) |
| Accommodation & Food Services | 2 (100.0%) | 0 (0.0%) |
| Public Administration | 12 (100.0%) | 0 (0.0%) |
| Total | 42 (55.3%) | 34 (44.7%) |
Education in Fulton
School Enrollment in Fulton
The most common levels of schooling among the 25 students in Fulton are high school (14 | 56.0%), elementary school (4 | 16.0%), and middle school (4 | 16.0%).
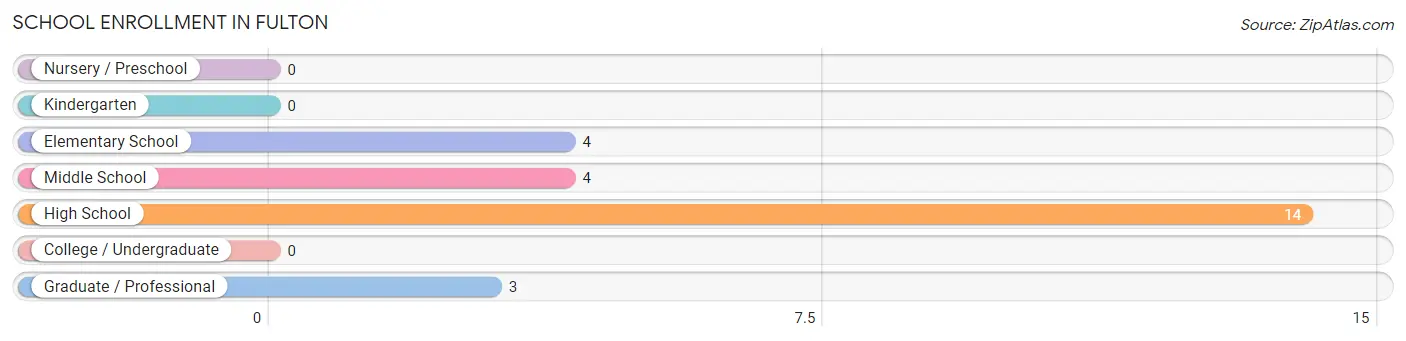
| School Level | # Students | % Students |
| Nursery / Preschool | 0 | 0.0% |
| Kindergarten | 0 | 0.0% |
| Elementary School | 4 | 16.0% |
| Middle School | 4 | 16.0% |
| High School | 14 | 56.0% |
| College / Undergraduate | 0 | 0.0% |
| Graduate / Professional | 3 | 12.0% |
| Total | 25 | 100.0% |
School Enrollment by Age by Funding Source in Fulton
Out of a total of 25 students who are enrolled in schools in Fulton, 11 (44.0%) attend a private institution, while the remaining 14 (56.0%) are enrolled in public schools. The age group of 18 to 19 year olds has the highest likelihood of being enrolled in private schools, with 10 (100.0% in the age bracket) enrolled. Conversely, the age group of 5 to 9 year old has the lowest likelihood of being enrolled in a private school, with 4 (100.0% in the age bracket) attending a public institution.
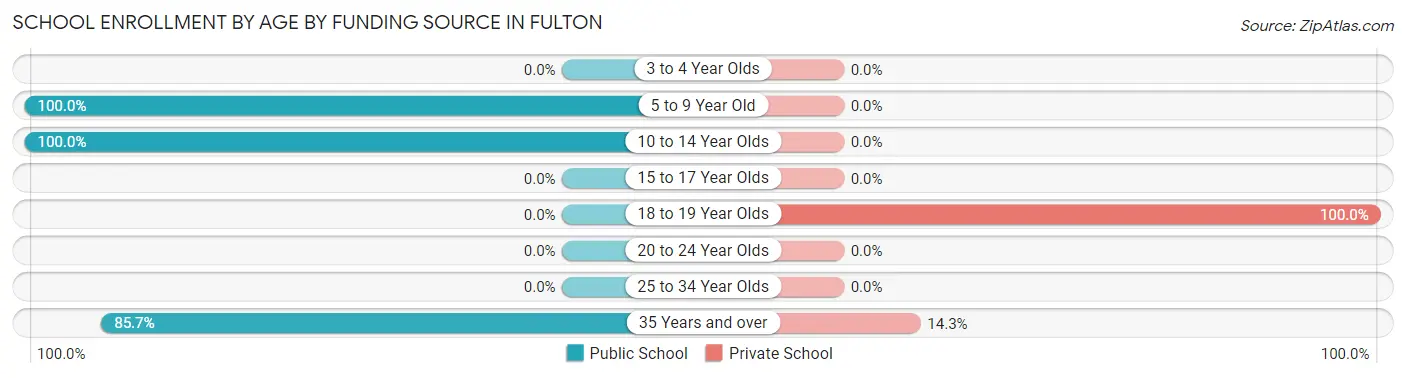
| Age Bracket | Public School | Private School |
| 3 to 4 Year Olds | 0 (0.0%) | 0 (0.0%) |
| 5 to 9 Year Old | 4 (100.0%) | 0 (0.0%) |
| 10 to 14 Year Olds | 4 (100.0%) | 0 (0.0%) |
| 15 to 17 Year Olds | 0 (0.0%) | 0 (0.0%) |
| 18 to 19 Year Olds | 0 (0.0%) | 10 (100.0%) |
| 20 to 24 Year Olds | 0 (0.0%) | 0 (0.0%) |
| 25 to 34 Year Olds | 0 (0.0%) | 0 (0.0%) |
| 35 Years and over | 6 (85.7%) | 1 (14.3%) |
| Total | 14 (56.0%) | 11 (44.0%) |
Educational Attainment by Field of Study in Fulton
Physical & health sciences (14 | 51.8%), science & technology (11 | 40.7%), bio, nature & agricultural (1 | 3.7%), and arts & humanities (1 | 3.7%) are the most common fields of study among 27 individuals in Fulton who have obtained a bachelor's degree or higher.
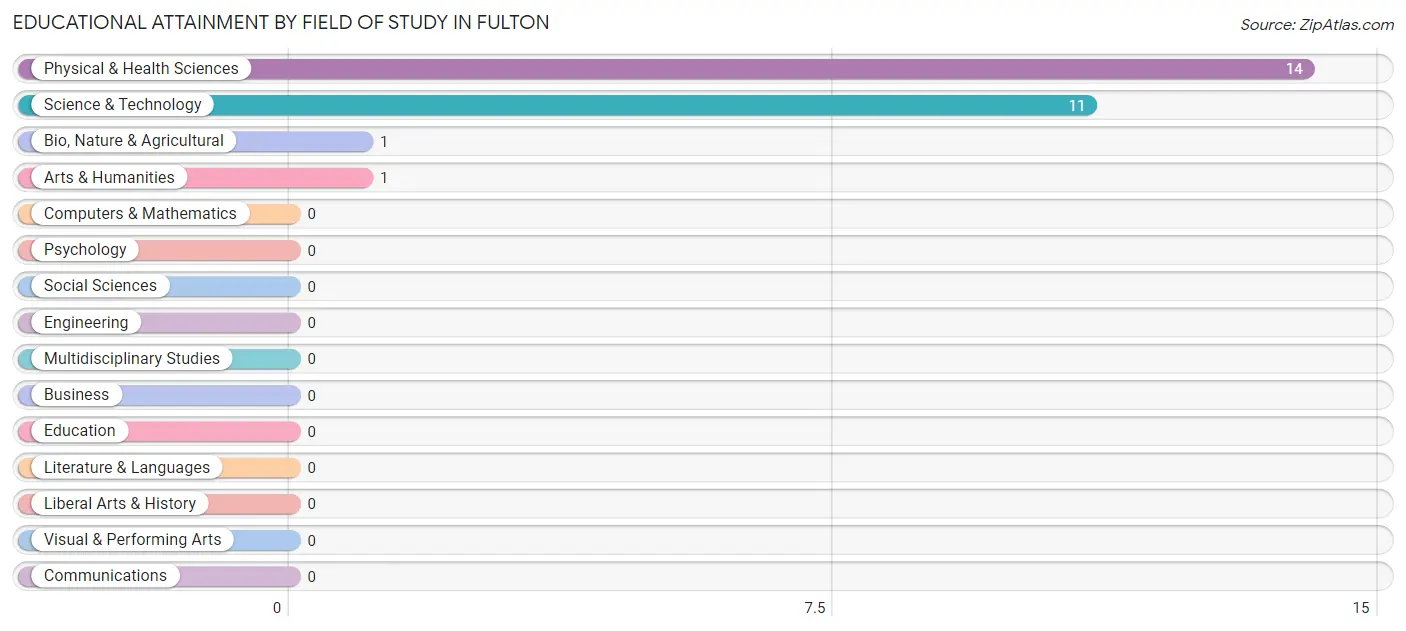
| Field of Study | # Graduates | % Graduates |
| Computers & Mathematics | 0 | 0.0% |
| Bio, Nature & Agricultural | 1 | 3.7% |
| Physical & Health Sciences | 14 | 51.8% |
| Psychology | 0 | 0.0% |
| Social Sciences | 0 | 0.0% |
| Engineering | 0 | 0.0% |
| Multidisciplinary Studies | 0 | 0.0% |
| Science & Technology | 11 | 40.7% |
| Business | 0 | 0.0% |
| Education | 0 | 0.0% |
| Literature & Languages | 0 | 0.0% |
| Liberal Arts & History | 0 | 0.0% |
| Visual & Performing Arts | 0 | 0.0% |
| Communications | 0 | 0.0% |
| Arts & Humanities | 1 | 3.7% |
| Total | 27 | 100.0% |
Transportation & Commute in Fulton
Vehicle Availability by Sex in Fulton
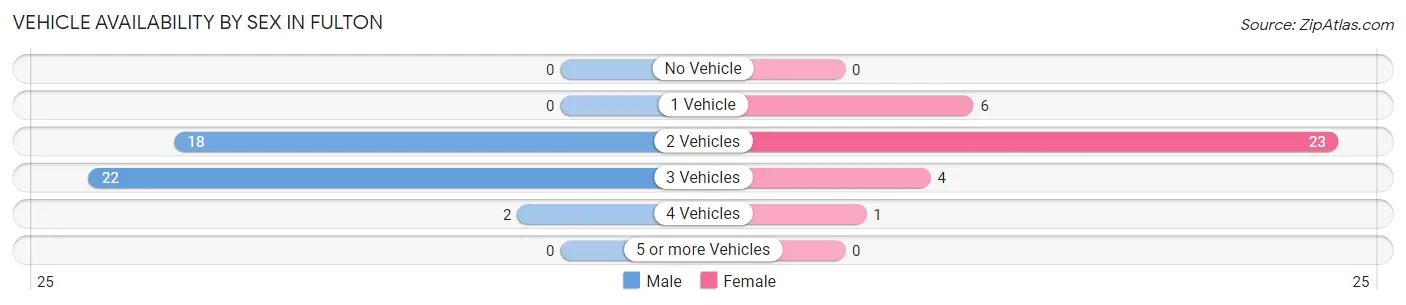
The most prevalent vehicle ownership categories in Fulton are males with 3 vehicles (22, accounting for 52.4%) and females with 3 vehicles (4, making up 64.7%).
| Vehicles Available | Male | Female |
| No Vehicle | 0 (0.0%) | 0 (0.0%) |
| 1 Vehicle | 0 (0.0%) | 6 (17.6%) |
| 2 Vehicles | 18 (42.9%) | 23 (67.6%) |
| 3 Vehicles | 22 (52.4%) | 4 (11.8%) |
| 4 Vehicles | 2 (4.8%) | 1 (2.9%) |
| 5 or more Vehicles | 0 (0.0%) | 0 (0.0%) |
| Total | 42 (100.0%) | 34 (100.0%) |
Commute Time in Fulton
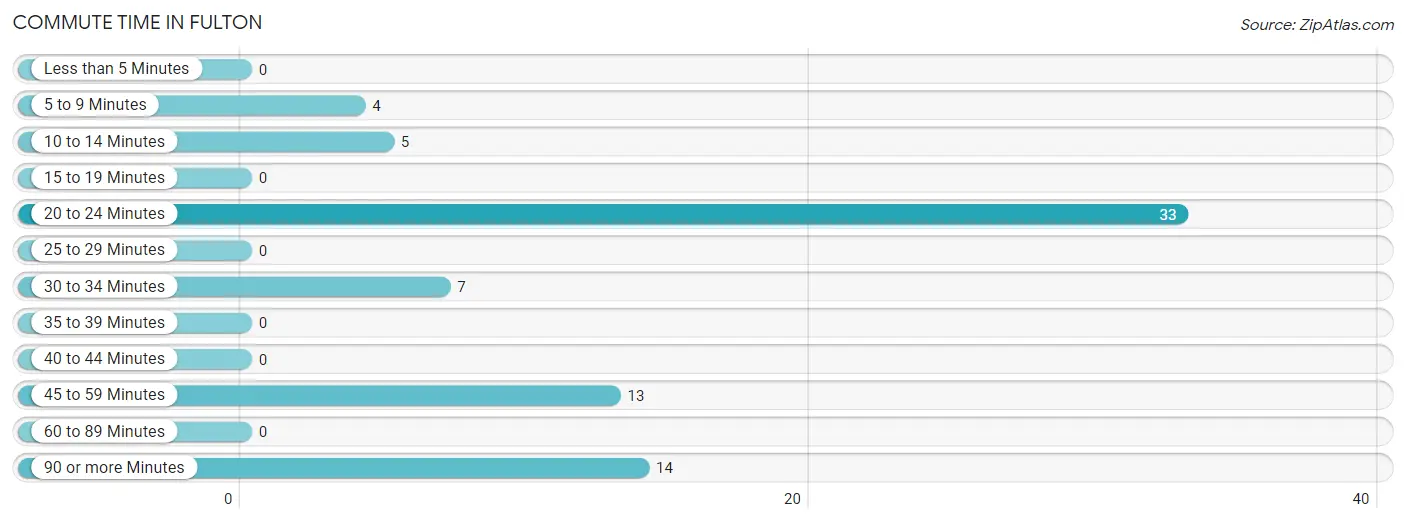
The most frequently occuring commute durations in Fulton are 20 to 24 minutes (33 commuters, 43.4%), 90 or more minutes (14 commuters, 18.4%), and 45 to 59 minutes (13 commuters, 17.1%).
| Commute Time | # Commuters | % Commuters |
| Less than 5 Minutes | 0 | 0.0% |
| 5 to 9 Minutes | 4 | 5.3% |
| 10 to 14 Minutes | 5 | 6.6% |
| 15 to 19 Minutes | 0 | 0.0% |
| 20 to 24 Minutes | 33 | 43.4% |
| 25 to 29 Minutes | 0 | 0.0% |
| 30 to 34 Minutes | 7 | 9.2% |
| 35 to 39 Minutes | 0 | 0.0% |
| 40 to 44 Minutes | 0 | 0.0% |
| 45 to 59 Minutes | 13 | 17.1% |
| 60 to 89 Minutes | 0 | 0.0% |
| 90 or more Minutes | 14 | 18.4% |
Commute Time by Sex in Fulton
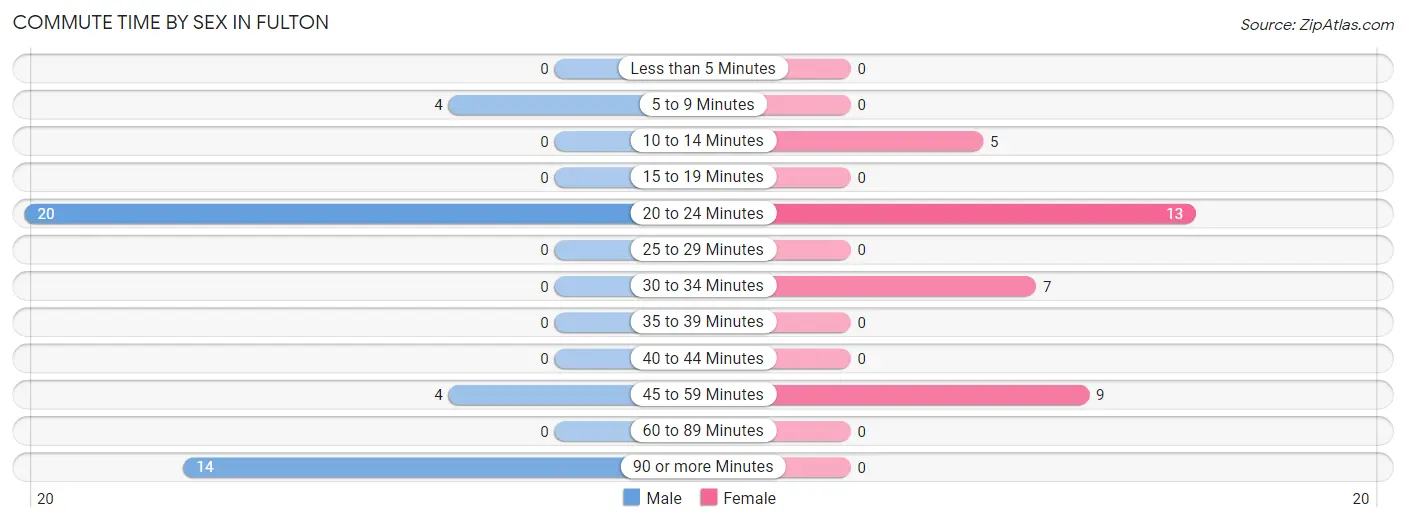
The most common commute times in Fulton are 20 to 24 minutes (20 commuters, 47.6%) for males and 20 to 24 minutes (13 commuters, 38.2%) for females.
| Commute Time | Male | Female |
| Less than 5 Minutes | 0 (0.0%) | 0 (0.0%) |
| 5 to 9 Minutes | 4 (9.5%) | 0 (0.0%) |
| 10 to 14 Minutes | 0 (0.0%) | 5 (14.7%) |
| 15 to 19 Minutes | 0 (0.0%) | 0 (0.0%) |
| 20 to 24 Minutes | 20 (47.6%) | 13 (38.2%) |
| 25 to 29 Minutes | 0 (0.0%) | 0 (0.0%) |
| 30 to 34 Minutes | 0 (0.0%) | 7 (20.6%) |
| 35 to 39 Minutes | 0 (0.0%) | 0 (0.0%) |
| 40 to 44 Minutes | 0 (0.0%) | 0 (0.0%) |
| 45 to 59 Minutes | 4 (9.5%) | 9 (26.5%) |
| 60 to 89 Minutes | 0 (0.0%) | 0 (0.0%) |
| 90 or more Minutes | 14 (33.3%) | 0 (0.0%) |
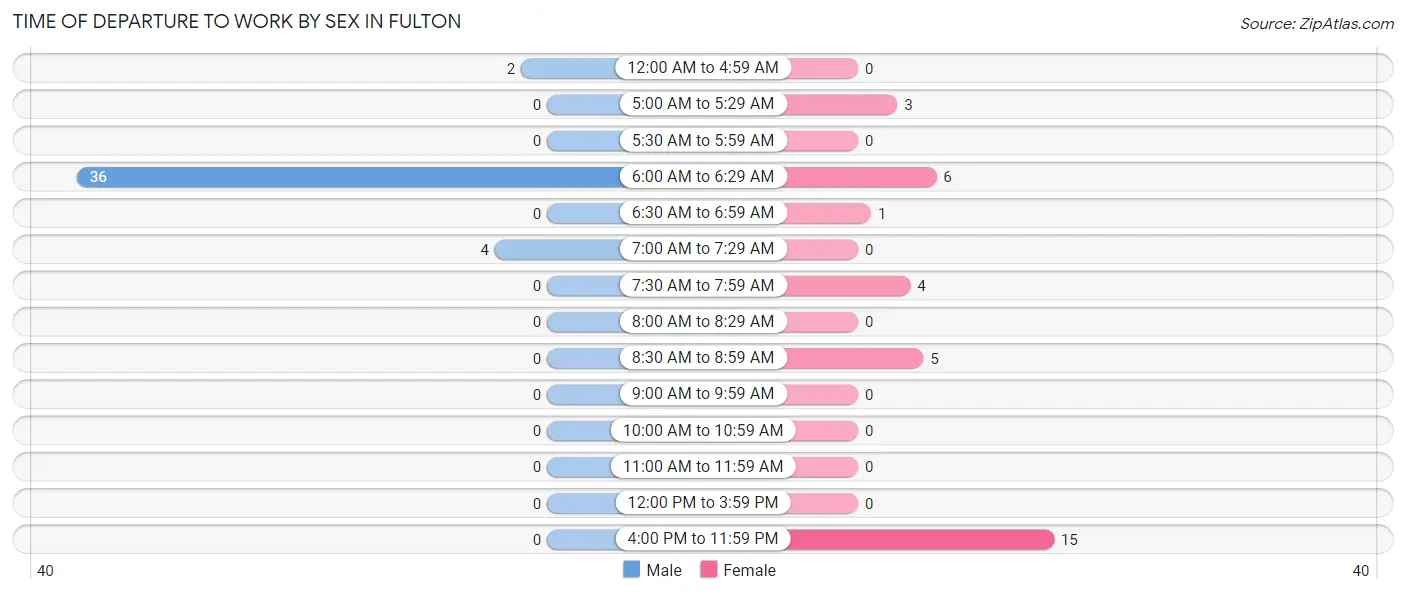
Time of Departure to Work by Sex in Fulton
The most frequent times of departure to work in Fulton are 6:00 AM to 6:29 AM (36, 85.7%) for males and 4:00 PM to 11:59 PM (15, 44.1%) for females.
| Time of Departure | Male | Female |
| 12:00 AM to 4:59 AM | 2 (4.8%) | 0 (0.0%) |
| 5:00 AM to 5:29 AM | 0 (0.0%) | 3 (8.8%) |
| 5:30 AM to 5:59 AM | 0 (0.0%) | 0 (0.0%) |
| 6:00 AM to 6:29 AM | 36 (85.7%) | 6 (17.6%) |
| 6:30 AM to 6:59 AM | 0 (0.0%) | 1 (2.9%) |
| 7:00 AM to 7:29 AM | 4 (9.5%) | 0 (0.0%) |
| 7:30 AM to 7:59 AM | 0 (0.0%) | 4 (11.8%) |
| 8:00 AM to 8:29 AM | 0 (0.0%) | 0 (0.0%) |
| 8:30 AM to 8:59 AM | 0 (0.0%) | 5 (14.7%) |
| 9:00 AM to 9:59 AM | 0 (0.0%) | 0 (0.0%) |
| 10:00 AM to 10:59 AM | 0 (0.0%) | 0 (0.0%) |
| 11:00 AM to 11:59 AM | 0 (0.0%) | 0 (0.0%) |
| 12:00 PM to 3:59 PM | 0 (0.0%) | 0 (0.0%) |
| 4:00 PM to 11:59 PM | 0 (0.0%) | 15 (44.1%) |
| Total | 42 (100.0%) | 34 (100.0%) |
Housing Occupancy in Fulton
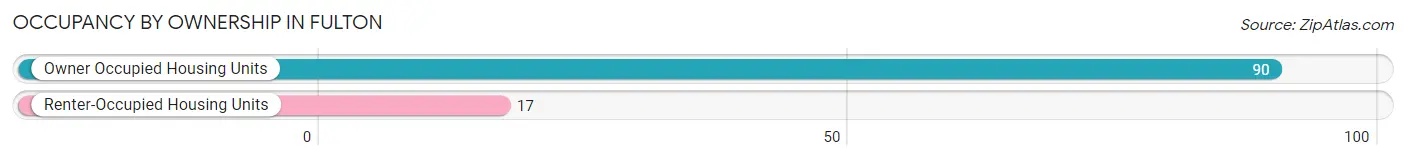
Occupancy by Ownership in Fulton
Of the total 107 dwellings in Fulton, owner-occupied units account for 90 (84.1%), while renter-occupied units make up 17 (15.9%).
| Occupancy | # Housing Units | % Housing Units |
| Owner Occupied Housing Units | 90 | 84.1% |
| Renter-Occupied Housing Units | 17 | 15.9% |
| Total Occupied Housing Units | 107 | 100.0% |
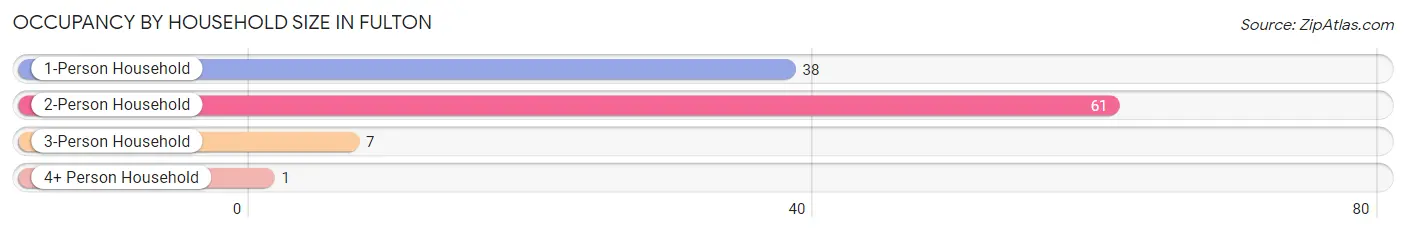
Occupancy by Household Size in Fulton
| Household Size | # Housing Units | % Housing Units |
| 1-Person Household | 38 | 35.5% |
| 2-Person Household | 61 | 57.0% |
| 3-Person Household | 7 | 6.5% |
| 4+ Person Household | 1 | 0.9% |
| Total Housing Units | 107 | 100.0% |
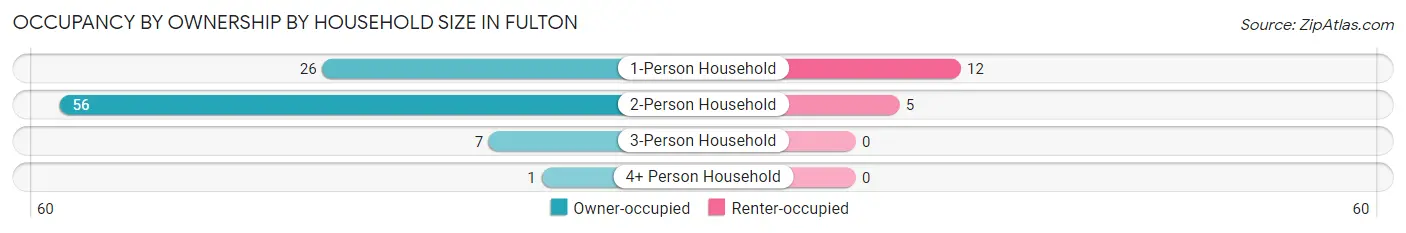
Occupancy by Ownership by Household Size in Fulton
| Household Size | Owner-occupied | Renter-occupied |
| 1-Person Household | 26 (68.4%) | 12 (31.6%) |
| 2-Person Household | 56 (91.8%) | 5 (8.2%) |
| 3-Person Household | 7 (100.0%) | 0 (0.0%) |
| 4+ Person Household | 1 (100.0%) | 0 (0.0%) |
| Total Housing Units | 90 (84.1%) | 17 (15.9%) |
Occupancy by Educational Attainment in Fulton
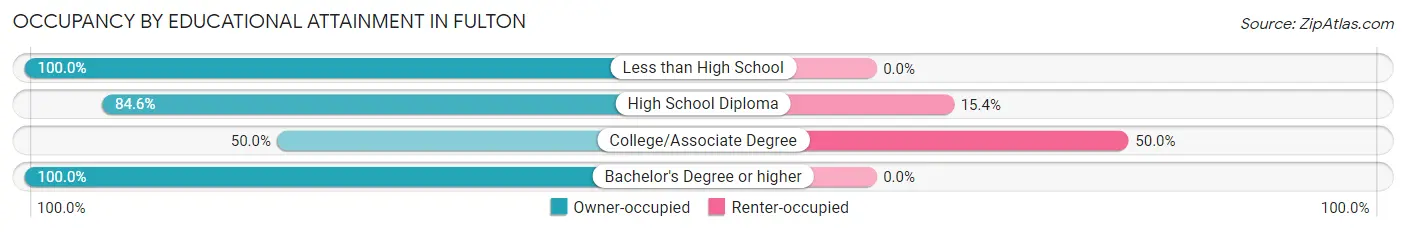
| Household Size | Owner-occupied | Renter-occupied |
| Less than High School | 29 (100.0%) | 0 (0.0%) |
| High School Diploma | 33 (84.6%) | 6 (15.4%) |
| College/Associate Degree | 11 (50.0%) | 11 (50.0%) |
| Bachelor's Degree or higher | 17 (100.0%) | 0 (0.0%) |
Occupancy by Age of Householder in Fulton
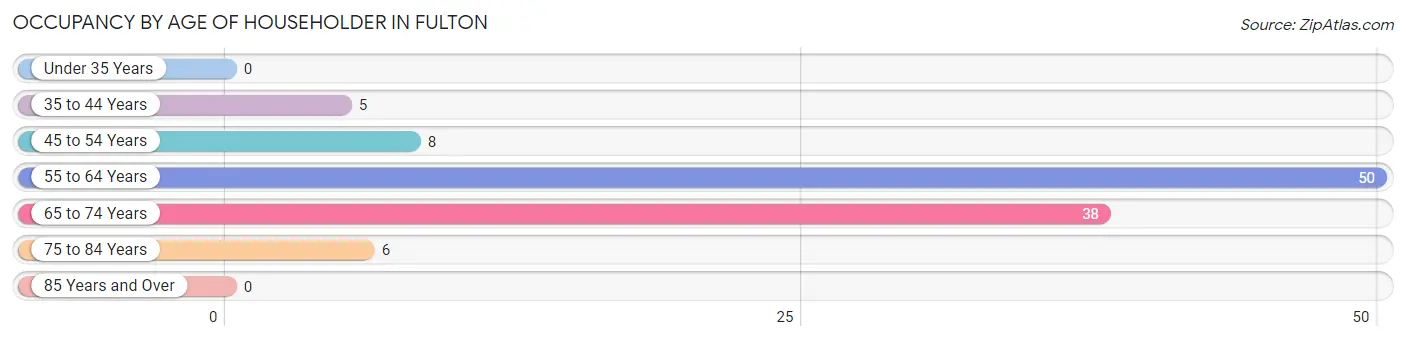
| Age Bracket | # Households | % Households |
| Under 35 Years | 0 | 0.0% |
| 35 to 44 Years | 5 | 4.7% |
| 45 to 54 Years | 8 | 7.5% |
| 55 to 64 Years | 50 | 46.7% |
| 65 to 74 Years | 38 | 35.5% |
| 75 to 84 Years | 6 | 5.6% |
| 85 Years and Over | 0 | 0.0% |
| Total | 107 | 100.0% |
Housing Finances in Fulton
Median Income by Occupancy in Fulton
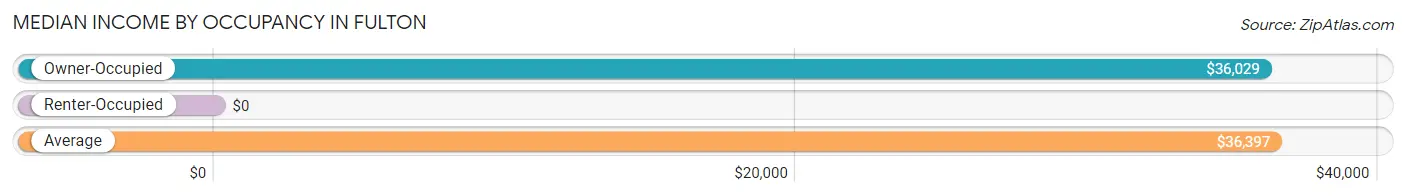
| Occupancy Type | # Households | Median Income |
| Owner-Occupied | 90 (84.1%) | $36,029 |
| Renter-Occupied | 17 (15.9%) | $0 |
| Average | 107 (100.0%) | $36,397 |
Occupancy by Householder Income Bracket in Fulton
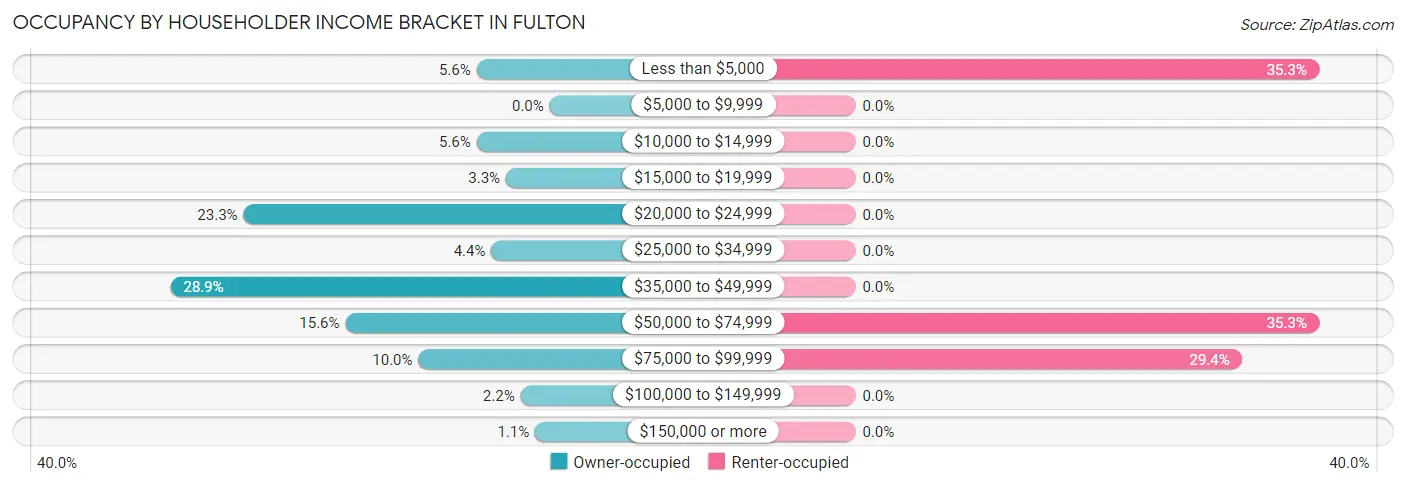
| Income Bracket | Owner-occupied | Renter-occupied |
| Less than $5,000 | 5 (5.6%) | 6 (35.3%) |
| $5,000 to $9,999 | 0 (0.0%) | 0 (0.0%) |
| $10,000 to $14,999 | 5 (5.6%) | 0 (0.0%) |
| $15,000 to $19,999 | 3 (3.3%) | 0 (0.0%) |
| $20,000 to $24,999 | 21 (23.3%) | 0 (0.0%) |
| $25,000 to $34,999 | 4 (4.4%) | 0 (0.0%) |
| $35,000 to $49,999 | 26 (28.9%) | 0 (0.0%) |
| $50,000 to $74,999 | 14 (15.6%) | 6 (35.3%) |
| $75,000 to $99,999 | 9 (10.0%) | 5 (29.4%) |
| $100,000 to $149,999 | 2 (2.2%) | 0 (0.0%) |
| $150,000 or more | 1 (1.1%) | 0 (0.0%) |
| Total | 90 (100.0%) | 17 (100.0%) |
Monthly Housing Cost Tiers in Fulton
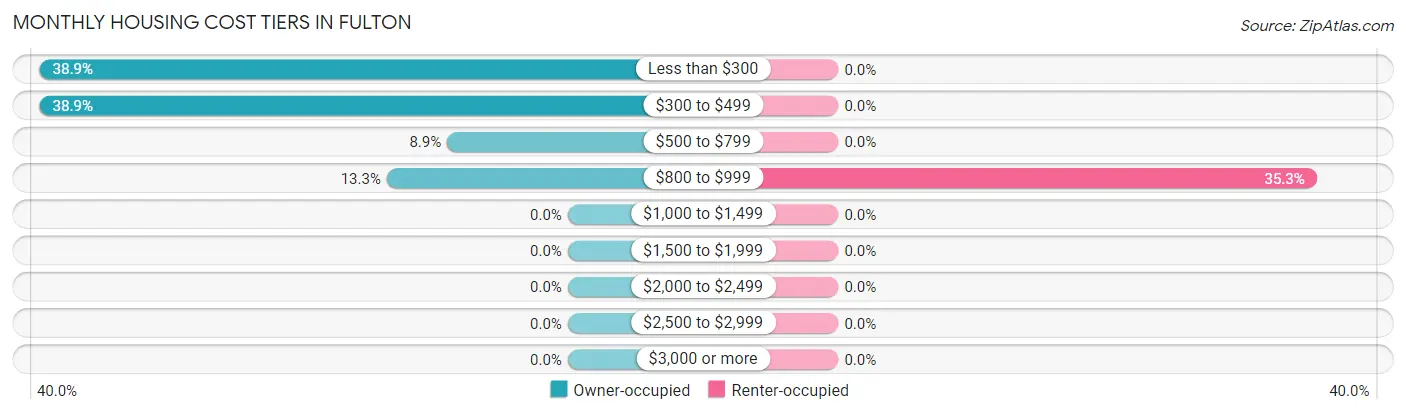
| Monthly Cost | Owner-occupied | Renter-occupied |
| Less than $300 | 35 (38.9%) | 0 (0.0%) |
| $300 to $499 | 35 (38.9%) | 0 (0.0%) |
| $500 to $799 | 8 (8.9%) | 0 (0.0%) |
| $800 to $999 | 12 (13.3%) | 6 (35.3%) |
| $1,000 to $1,499 | 0 (0.0%) | 0 (0.0%) |
| $1,500 to $1,999 | 0 (0.0%) | 0 (0.0%) |
| $2,000 to $2,499 | 0 (0.0%) | 0 (0.0%) |
| $2,500 to $2,999 | 0 (0.0%) | 0 (0.0%) |
| $3,000 or more | 0 (0.0%) | 0 (0.0%) |
| Total | 90 (100.0%) | 17 (100.0%) |
Physical Housing Characteristics in Fulton
Housing Structures in Fulton
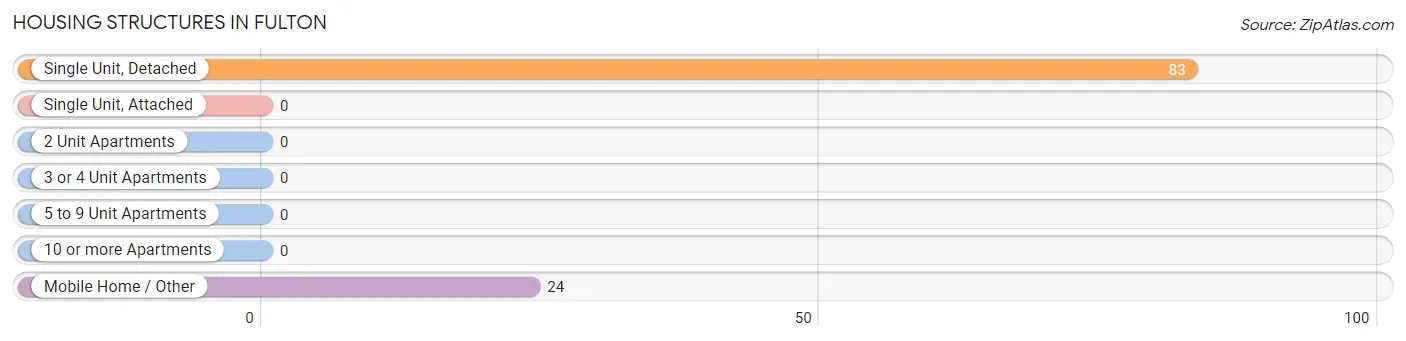
| Structure Type | # Housing Units | % Housing Units |
| Single Unit, Detached | 83 | 77.6% |
| Single Unit, Attached | 0 | 0.0% |
| 2 Unit Apartments | 0 | 0.0% |
| 3 or 4 Unit Apartments | 0 | 0.0% |
| 5 to 9 Unit Apartments | 0 | 0.0% |
| 10 or more Apartments | 0 | 0.0% |
| Mobile Home / Other | 24 | 22.4% |
| Total | 107 | 100.0% |
Housing Structures by Occupancy in Fulton
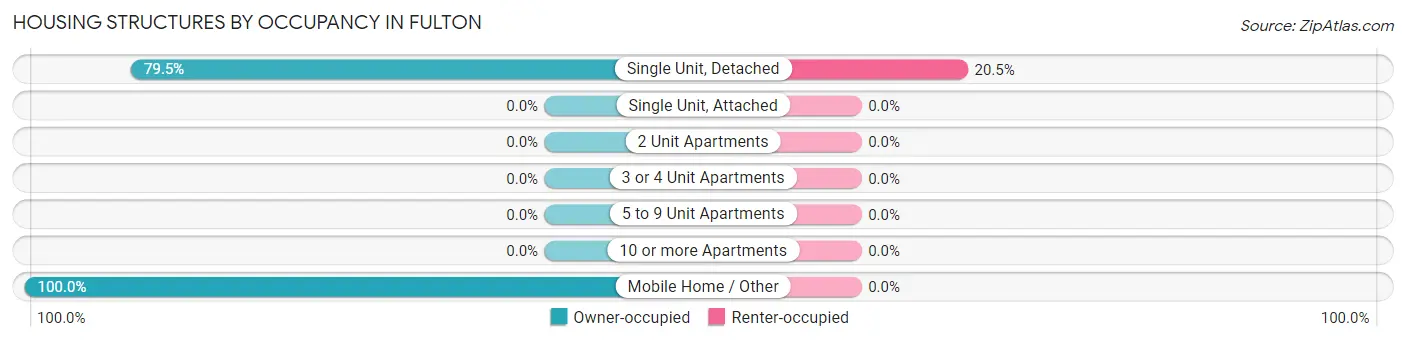
| Structure Type | Owner-occupied | Renter-occupied |
| Single Unit, Detached | 66 (79.5%) | 17 (20.5%) |
| Single Unit, Attached | 0 (0.0%) | 0 (0.0%) |
| 2 Unit Apartments | 0 (0.0%) | 0 (0.0%) |
| 3 or 4 Unit Apartments | 0 (0.0%) | 0 (0.0%) |
| 5 to 9 Unit Apartments | 0 (0.0%) | 0 (0.0%) |
| 10 or more Apartments | 0 (0.0%) | 0 (0.0%) |
| Mobile Home / Other | 24 (100.0%) | 0 (0.0%) |
| Total | 90 (84.1%) | 17 (15.9%) |
Housing Structures by Number of Rooms in Fulton
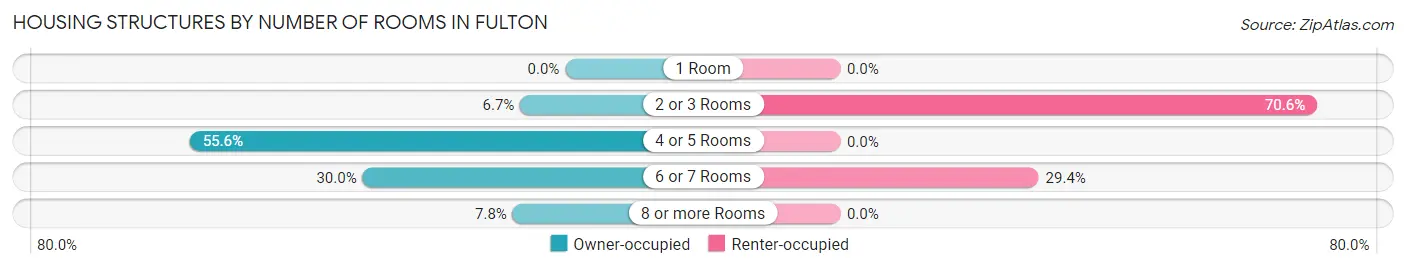
| Number of Rooms | Owner-occupied | Renter-occupied |
| 1 Room | 0 (0.0%) | 0 (0.0%) |
| 2 or 3 Rooms | 6 (6.7%) | 12 (70.6%) |
| 4 or 5 Rooms | 50 (55.6%) | 0 (0.0%) |
| 6 or 7 Rooms | 27 (30.0%) | 5 (29.4%) |
| 8 or more Rooms | 7 (7.8%) | 0 (0.0%) |
| Total | 90 (100.0%) | 17 (100.0%) |
Housing Structure by Heating Type in Fulton
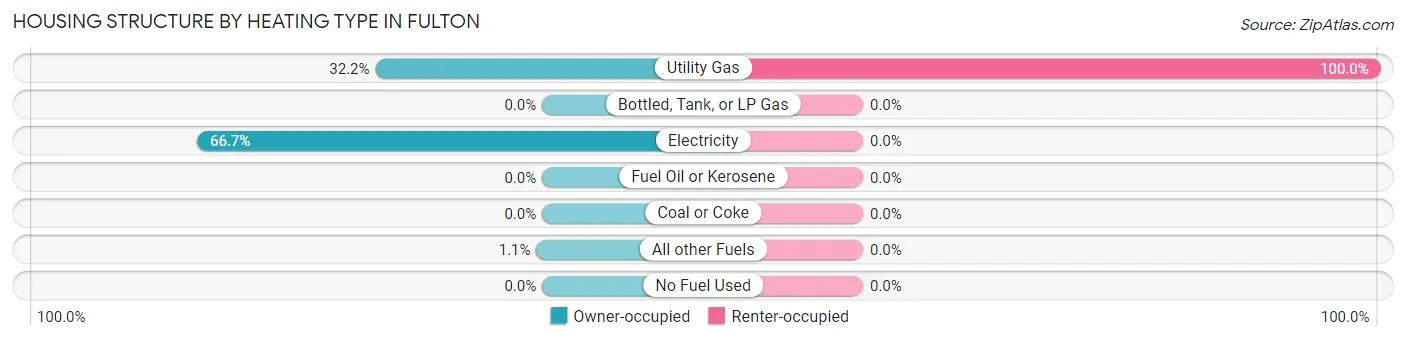
| Heating Type | Owner-occupied | Renter-occupied |
| Utility Gas | 29 (32.2%) | 17 (100.0%) |
| Bottled, Tank, or LP Gas | 0 (0.0%) | 0 (0.0%) |
| Electricity | 60 (66.7%) | 0 (0.0%) |
| Fuel Oil or Kerosene | 0 (0.0%) | 0 (0.0%) |
| Coal or Coke | 0 (0.0%) | 0 (0.0%) |
| All other Fuels | 1 (1.1%) | 0 (0.0%) |
| No Fuel Used | 0 (0.0%) | 0 (0.0%) |
| Total | 90 (100.0%) | 17 (100.0%) |
Household Vehicle Usage in Fulton
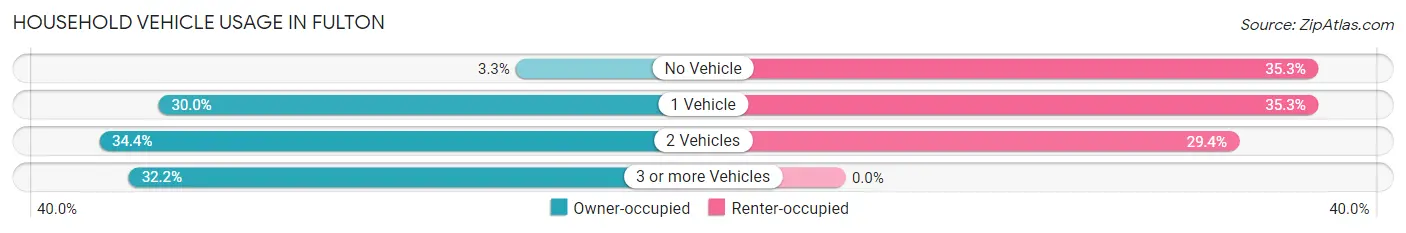
| Vehicles per Household | Owner-occupied | Renter-occupied |
| No Vehicle | 3 (3.3%) | 6 (35.3%) |
| 1 Vehicle | 27 (30.0%) | 6 (35.3%) |
| 2 Vehicles | 31 (34.4%) | 5 (29.4%) |
| 3 or more Vehicles | 29 (32.2%) | 0 (0.0%) |
| Total | 90 (100.0%) | 17 (100.0%) |
Real Estate & Mortgages in Fulton
Real Estate and Mortgage Overview in Fulton
| Characteristic | Without Mortgage | With Mortgage |
| Housing Units | 73 | 17 |
| Median Property Value | - | - |
| Median Household Income | - | - |
| Monthly Housing Costs | $304 | $0 |
| Real Estate Taxes | $349 | $15 |
Property Value by Mortgage Status in Fulton
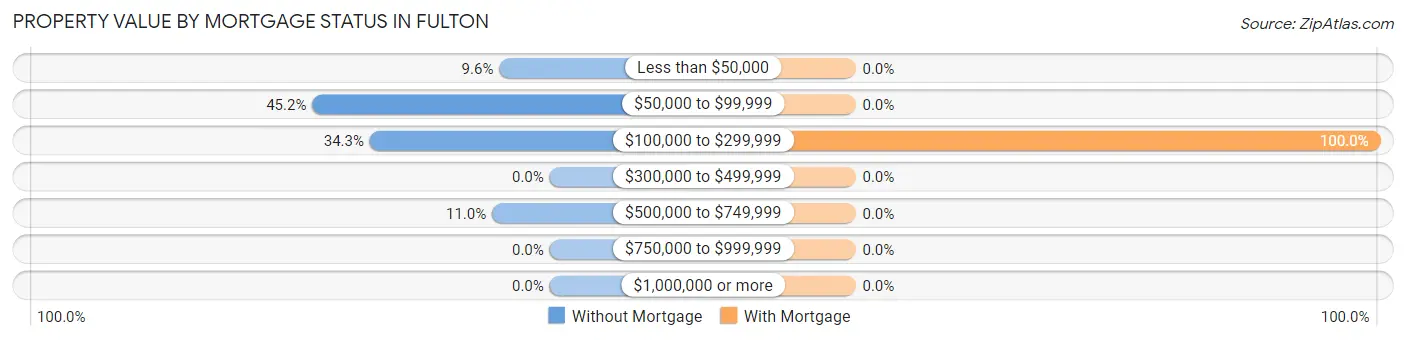
| Property Value | Without Mortgage | With Mortgage |
| Less than $50,000 | 7 (9.6%) | 0 (0.0%) |
| $50,000 to $99,999 | 33 (45.2%) | 0 (0.0%) |
| $100,000 to $299,999 | 25 (34.3%) | 17 (100.0%) |
| $300,000 to $499,999 | 0 (0.0%) | 0 (0.0%) |
| $500,000 to $749,999 | 8 (11.0%) | 0 (0.0%) |
| $750,000 to $999,999 | 0 (0.0%) | 0 (0.0%) |
| $1,000,000 or more | 0 (0.0%) | 0 (0.0%) |
| Total | 73 (100.0%) | 17 (100.0%) |
Household Income by Mortgage Status in Fulton
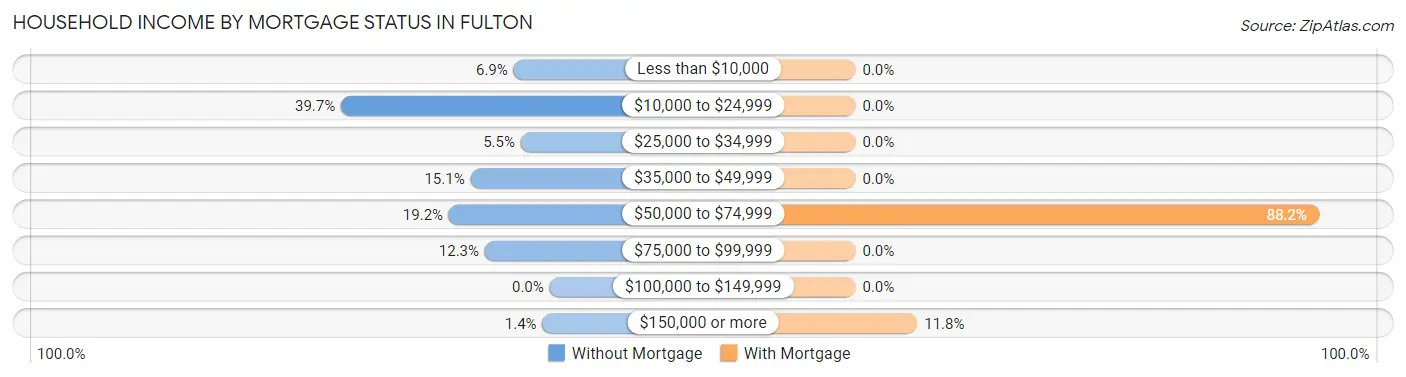
| Household Income | Without Mortgage | With Mortgage |
| Less than $10,000 | 5 (6.9%) | 0 (0.0%) |
| $10,000 to $24,999 | 29 (39.7%) | 0 (0.0%) |
| $25,000 to $34,999 | 4 (5.5%) | 0 (0.0%) |
| $35,000 to $49,999 | 11 (15.1%) | 0 (0.0%) |
| $50,000 to $74,999 | 14 (19.2%) | 15 (88.2%) |
| $75,000 to $99,999 | 9 (12.3%) | 0 (0.0%) |
| $100,000 to $149,999 | 0 (0.0%) | 0 (0.0%) |
| $150,000 or more | 1 (1.4%) | 2 (11.8%) |
| Total | 73 (100.0%) | 17 (100.0%) |
Property Value to Household Income Ratio in Fulton
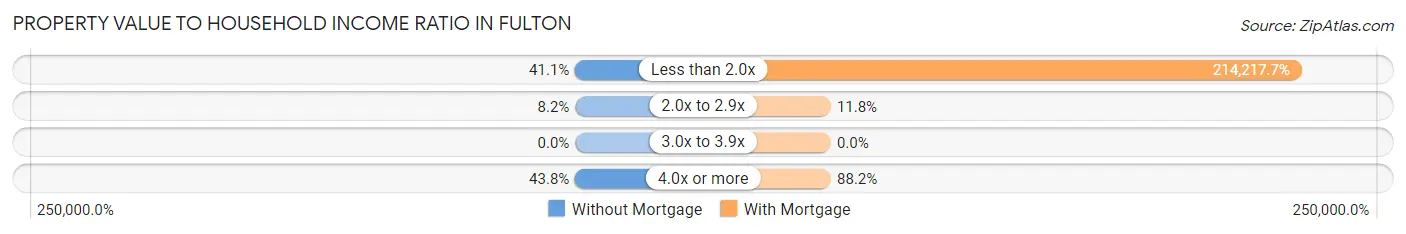
| Value-to-Income Ratio | Without Mortgage | With Mortgage |
| Less than 2.0x | 30 (41.1%) | 36,417 (214,217.7%) |
| 2.0x to 2.9x | 6 (8.2%) | 2 (11.8%) |
| 3.0x to 3.9x | 0 (0.0%) | 0 (0.0%) |
| 4.0x or more | 32 (43.8%) | 15 (88.2%) |
| Total | 73 (100.0%) | 17 (100.0%) |
Real Estate Taxes by Mortgage Status in Fulton
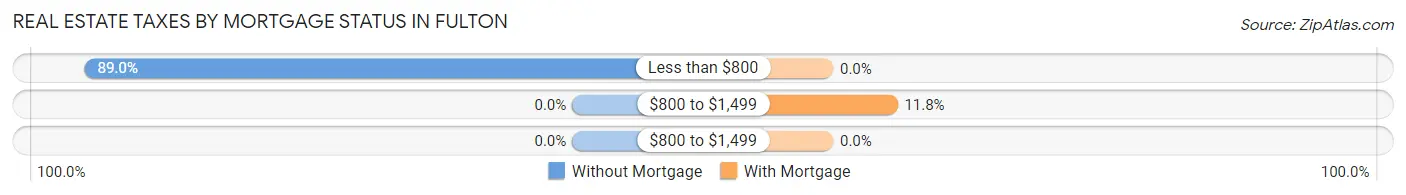
| Property Taxes | Without Mortgage | With Mortgage |
| Less than $800 | 65 (89.0%) | 0 (0.0%) |
| $800 to $1,499 | 0 (0.0%) | 2 (11.8%) |
| $800 to $1,499 | 0 (0.0%) | 0 (0.0%) |
| Total | 73 (100.0%) | 17 (100.0%) |
Health & Disability in Fulton
Health Insurance Coverage by Age in Fulton
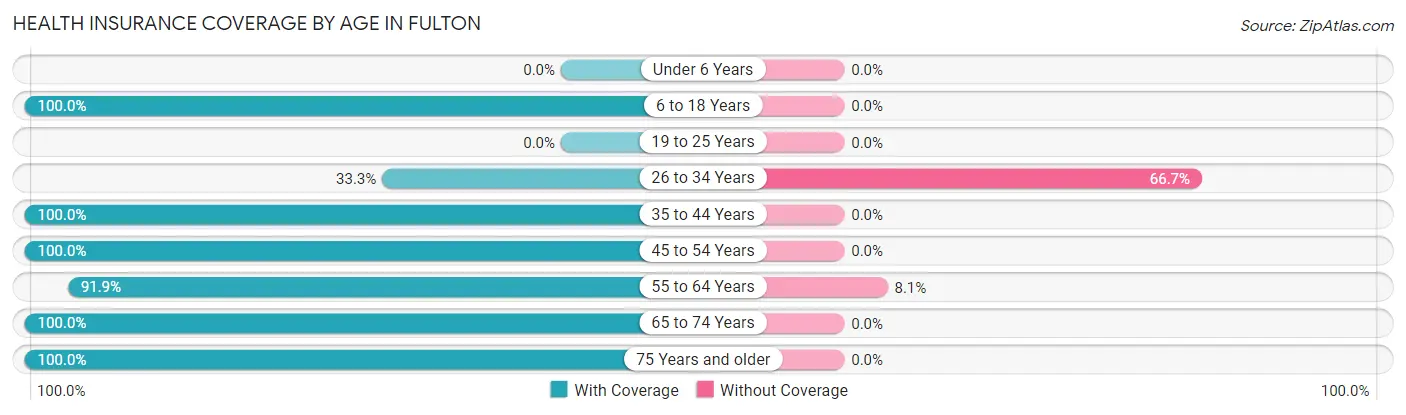
| Age Bracket | With Coverage | Without Coverage |
| Under 6 Years | 0 (0.0%) | 0 (0.0%) |
| 6 to 18 Years | 18 (100.0%) | 0 (0.0%) |
| 19 to 25 Years | 0 (0.0%) | 0 (0.0%) |
| 26 to 34 Years | 2 (33.3%) | 4 (66.7%) |
| 35 to 44 Years | 24 (100.0%) | 0 (0.0%) |
| 45 to 54 Years | 29 (100.0%) | 0 (0.0%) |
| 55 to 64 Years | 57 (91.9%) | 5 (8.1%) |
| 65 to 74 Years | 43 (100.0%) | 0 (0.0%) |
| 75 Years and older | 26 (100.0%) | 0 (0.0%) |
| Total | 199 (95.7%) | 9 (4.3%) |
Health Insurance Coverage by Citizenship Status in Fulton
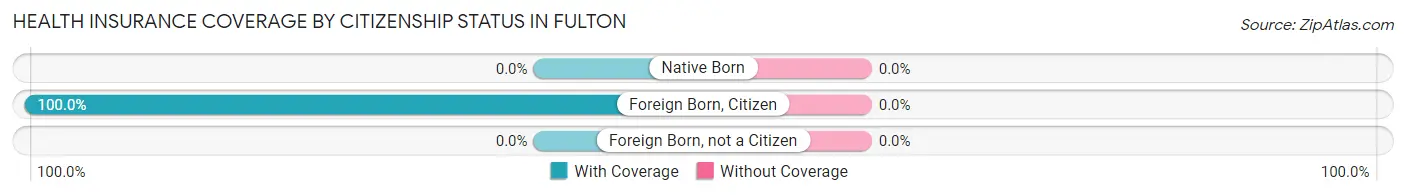
| Citizenship Status | With Coverage | Without Coverage |
| Native Born | 0 (0.0%) | 0 (0.0%) |
| Foreign Born, Citizen | 18 (100.0%) | 0 (0.0%) |
| Foreign Born, not a Citizen | 0 (0.0%) | 0 (0.0%) |
Health Insurance Coverage by Household Income in Fulton
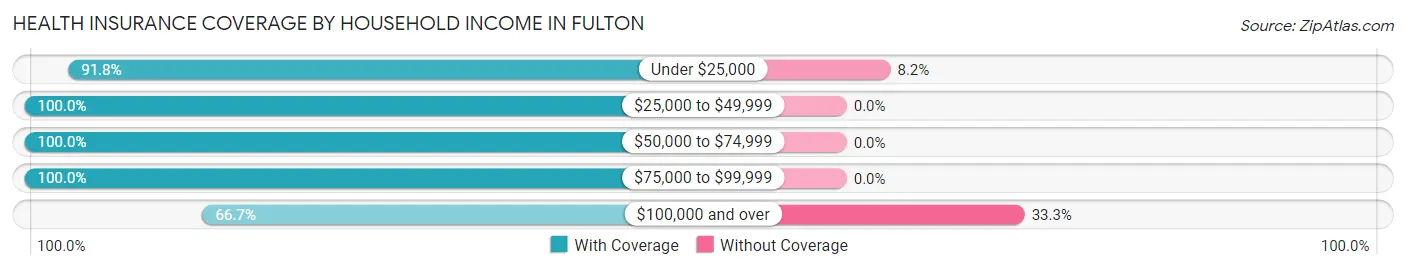
| Household Income | With Coverage | Without Coverage |
| Under $25,000 | 56 (91.8%) | 5 (8.2%) |
| $25,000 to $49,999 | 71 (100.0%) | 0 (0.0%) |
| $50,000 to $74,999 | 20 (100.0%) | 0 (0.0%) |
| $75,000 to $99,999 | 44 (100.0%) | 0 (0.0%) |
| $100,000 and over | 8 (66.7%) | 4 (33.3%) |
Public vs Private Health Insurance Coverage by Age in Fulton
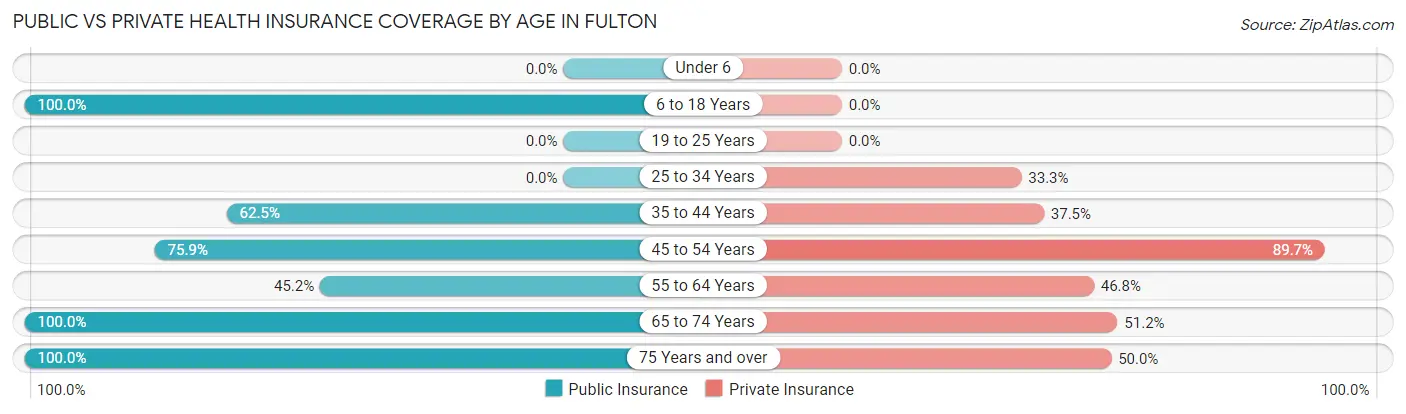
| Age Bracket | Public Insurance | Private Insurance |
| Under 6 | 0 (0.0%) | 0 (0.0%) |
| 6 to 18 Years | 18 (100.0%) | 0 (0.0%) |
| 19 to 25 Years | 0 (0.0%) | 0 (0.0%) |
| 25 to 34 Years | 0 (0.0%) | 2 (33.3%) |
| 35 to 44 Years | 15 (62.5%) | 9 (37.5%) |
| 45 to 54 Years | 22 (75.9%) | 26 (89.7%) |
| 55 to 64 Years | 28 (45.2%) | 29 (46.8%) |
| 65 to 74 Years | 43 (100.0%) | 22 (51.2%) |
| 75 Years and over | 26 (100.0%) | 13 (50.0%) |
| Total | 152 (73.1%) | 101 (48.6%) |
Disability Status by Sex by Age in Fulton
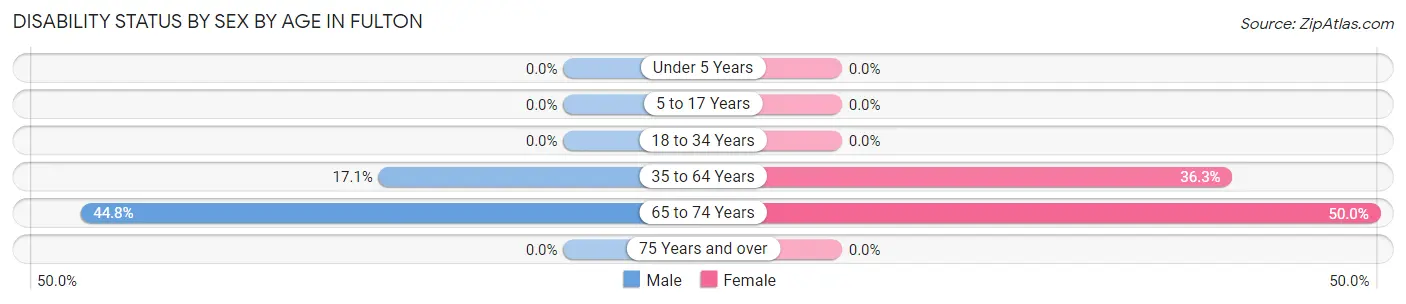
| Age Bracket | Male | Female |
| Under 5 Years | 0 (0.0%) | 0 (0.0%) |
| 5 to 17 Years | 0 (0.0%) | 0 (0.0%) |
| 18 to 34 Years | 0 (0.0%) | 0 (0.0%) |
| 35 to 64 Years | 6 (17.1%) | 29 (36.2%) |
| 65 to 74 Years | 13 (44.8%) | 7 (50.0%) |
| 75 Years and over | 0 (0.0%) | 0 (0.0%) |
Disability Class by Sex by Age in Fulton
Disability Class: Hearing Difficulty
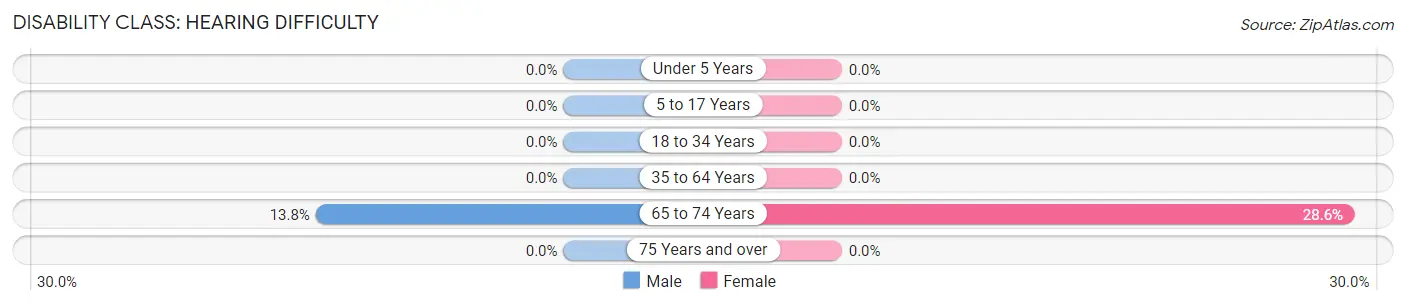
| Age Bracket | Male | Female |
| Under 5 Years | 0 (0.0%) | 0 (0.0%) |
| 5 to 17 Years | 0 (0.0%) | 0 (0.0%) |
| 18 to 34 Years | 0 (0.0%) | 0 (0.0%) |
| 35 to 64 Years | 0 (0.0%) | 0 (0.0%) |
| 65 to 74 Years | 4 (13.8%) | 4 (28.6%) |
| 75 Years and over | 0 (0.0%) | 0 (0.0%) |
Disability Class: Vision Difficulty
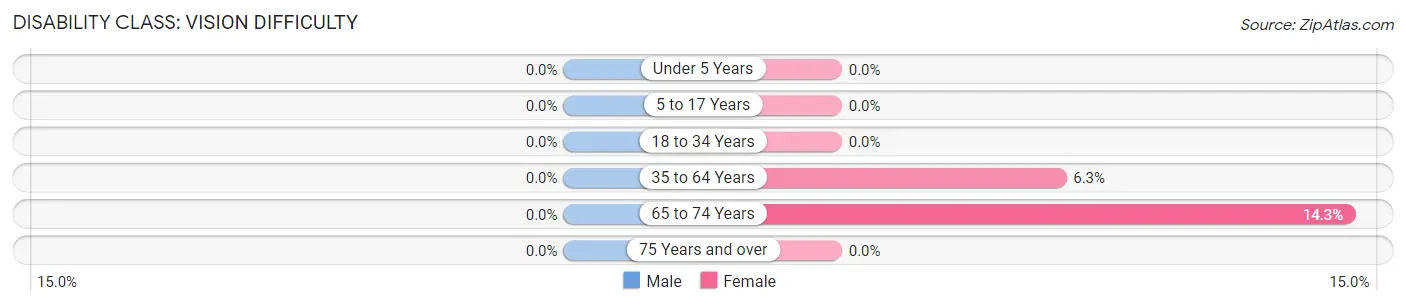
| Age Bracket | Male | Female |
| Under 5 Years | 0 (0.0%) | 0 (0.0%) |
| 5 to 17 Years | 0 (0.0%) | 0 (0.0%) |
| 18 to 34 Years | 0 (0.0%) | 0 (0.0%) |
| 35 to 64 Years | 0 (0.0%) | 5 (6.2%) |
| 65 to 74 Years | 0 (0.0%) | 2 (14.3%) |
| 75 Years and over | 0 (0.0%) | 0 (0.0%) |
Disability Class: Cognitive Difficulty
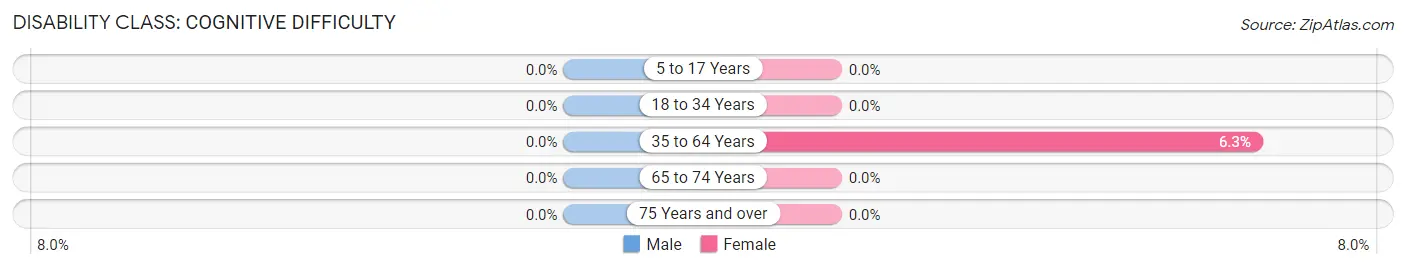
| Age Bracket | Male | Female |
| 5 to 17 Years | 0 (0.0%) | 0 (0.0%) |
| 18 to 34 Years | 0 (0.0%) | 0 (0.0%) |
| 35 to 64 Years | 0 (0.0%) | 5 (6.2%) |
| 65 to 74 Years | 0 (0.0%) | 0 (0.0%) |
| 75 Years and over | 0 (0.0%) | 0 (0.0%) |
Disability Class: Ambulatory Difficulty
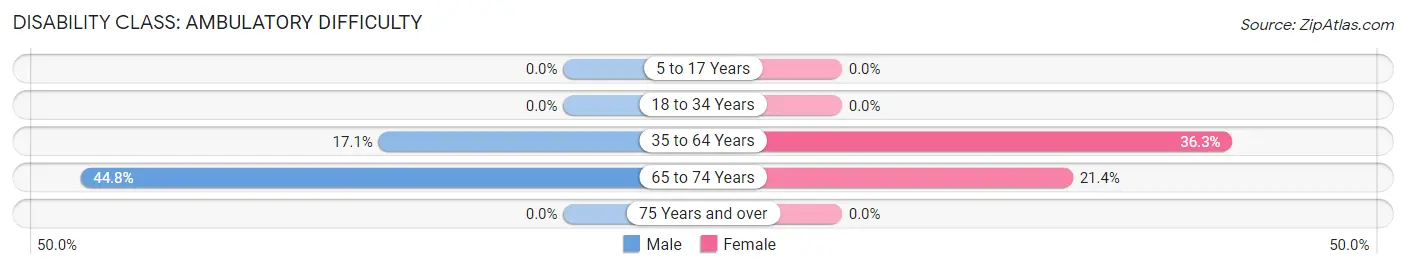
| Age Bracket | Male | Female |
| 5 to 17 Years | 0 (0.0%) | 0 (0.0%) |
| 18 to 34 Years | 0 (0.0%) | 0 (0.0%) |
| 35 to 64 Years | 6 (17.1%) | 29 (36.2%) |
| 65 to 74 Years | 13 (44.8%) | 3 (21.4%) |
| 75 Years and over | 0 (0.0%) | 0 (0.0%) |
Disability Class: Self-Care Difficulty
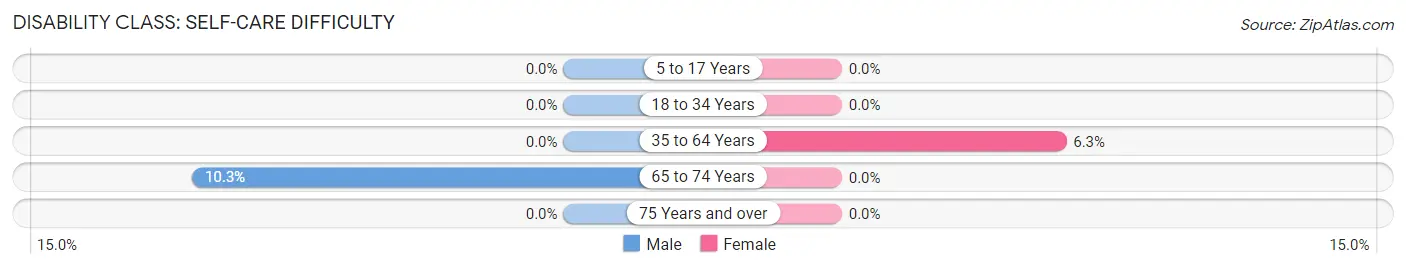
| Age Bracket | Male | Female |
| 5 to 17 Years | 0 (0.0%) | 0 (0.0%) |
| 18 to 34 Years | 0 (0.0%) | 0 (0.0%) |
| 35 to 64 Years | 0 (0.0%) | 5 (6.2%) |
| 65 to 74 Years | 3 (10.3%) | 0 (0.0%) |
| 75 Years and over | 0 (0.0%) | 0 (0.0%) |
Technology Access in Fulton
Computing Device Access in Fulton
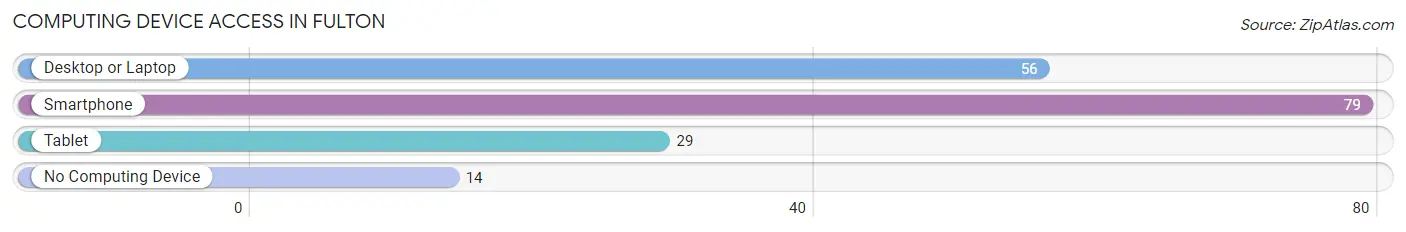
| Device Type | # Households | % Households |
| Desktop or Laptop | 56 | 52.3% |
| Smartphone | 79 | 73.8% |
| Tablet | 29 | 27.1% |
| No Computing Device | 14 | 13.1% |
| Total | 107 | 100.0% |
Internet Access in Fulton
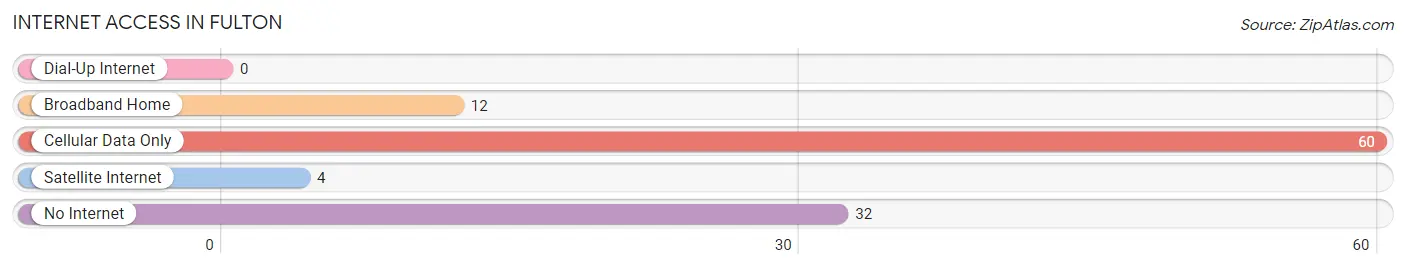
| Internet Type | # Households | % Households |
| Dial-Up Internet | 0 | 0.0% |
| Broadband Home | 12 | 11.2% |
| Cellular Data Only | 60 | 56.1% |
| Satellite Internet | 4 | 3.7% |
| No Internet | 32 | 29.9% |
| Total | 107 | 100.0% |
Fulton Summary
Fulton, Arkansas is a small city located in the northwest corner of the state, in the Ozark Mountains. It is the county seat of Fulton County, and is situated on the banks of the Arkansas River. The city has a population of 1,845, according to the 2010 census.
History
Fulton was founded in 1854 by a group of settlers from Kentucky and Tennessee. The city was named after Robert Fulton, the inventor of the steamboat. The city was incorporated in 1872, and the first post office was established in 1873.
The city was an important stop on the St. Louis-San Francisco Railway, which ran through the city from 1882 to 1971. The railroad brought economic growth to the city, and it became a center for timber and agricultural products.
Geography
Fulton is located in the northwest corner of Arkansas, in the Ozark Mountains. The city is situated on the banks of the Arkansas River, and is surrounded by rolling hills and forests. The city has a total area of 1.7 square miles, all of which is land.
The climate in Fulton is humid subtropical, with hot, humid summers and mild winters. The average annual temperature is 63 degrees Fahrenheit, and the average annual precipitation is 48 inches.
Economy
The economy of Fulton is largely based on agriculture and timber. The city is home to several large timber companies, and the surrounding area is known for its production of cotton, soybeans, and other crops.
The city is also home to several manufacturing companies, including a furniture factory and a plastics plant. The city is also home to a number of small businesses, including restaurants, retail stores, and service providers.
Demographics
According to the 2010 census, the population of Fulton was 1,845. The racial makeup of the city was 95.3% White, 0.7% African American, 0.3% Native American, 0.2% Asian, 0.1% Pacific Islander, and 3.4% from other races.
The median household income in Fulton was $30,938, and the median family income was $37,813. The per capita income was $17,845. About 17.3% of the population was below the poverty line.
Fulton is served by the Fulton County School District, which includes two elementary schools, one middle school, and one high school. The city is also home to a branch of the University of Arkansas Community College at Morrilton.
Fulton is a small city with a rich history and a strong economy. The city is home to a diverse population, and is a great place to live and work.
Common Questions
What is Per Capita Income in Fulton?
Per Capita income in Fulton is $24,696.
What is the Median Family Income in Fulton?
Median Family Income in Fulton is $36,250.
What is the Median Household income in Fulton?
Median Household Income in Fulton is $36,397.
What is Inequality or Gini Index in Fulton?
Inequality or Gini Index in Fulton is 0.39.
What is the Total Population of Fulton?
Total Population of Fulton is 208.
What is the Total Male Population of Fulton?
Total Male Population of Fulton is 89.
What is the Total Female Population of Fulton?
Total Female Population of Fulton is 119.
What is the Ratio of Males per 100 Females in Fulton?
There are 74.79 Males per 100 Females in Fulton.
What is the Ratio of Females per 100 Males in Fulton?
There are 133.71 Females per 100 Males in Fulton.
What is the Median Population Age in Fulton?
Median Population Age in Fulton is 58.9 Years.
What is the Average Family Size in Fulton
Average Family Size in Fulton is 2.5 People.
What is the Average Household Size in Fulton
Average Household Size in Fulton is 1.9 People.
How Large is the Labor Force in Fulton?
There are 76 People in the Labor Forcein in Fulton.
What is the Percentage of People in the Labor Force in Fulton?
38.0% of People are in the Labor Force in Fulton.