Kenyan Married-Couple Family Poverty

COMPARE

Kenyan
Race
Ancestry
AfghanAfricanAlaska NativeAlaskan AthabascanAlbanianAleutAlsatianAmericanApacheArabArapahoArgentineanArmenianAssyrian/Chaldean/SyriacAustralianAustrianBahamianBangladeshiBarbadianBasqueBelgianBelizeanBermudanBhutaneseBlackfeetBolivianBrazilianBritishBritish West IndianBulgarianBurmeseCajunCambodianCanadianCape VerdeanCarpatho RusynCelticCentral AmericanCentral American IndianCherokeeCheyenneChickasawChileanChineseChippewaChoctawColombianColvilleComancheCosta RicanCreeCreekCroatianCrowCubanCypriotCzechCzechoslovakianDanishDelawareDominicanDutchDutch West IndianEastern EuropeanEcuadorianEgyptianEnglishEstonianEthiopianEuropeanFijianFilipinoFinnishFrenchFrench American IndianFrench CanadianGermanGerman RussianGhanaianGreekGuamanian/ChamorroGuatemalanGuyaneseHaitianHmongHonduranHopiHoumaHungarianIcelanderIndian (Asian)IndonesianInupiatIranianIraqiIrishIroquoisIsraeliItalianJamaicanJapaneseJordanianKenyanKiowaKoreanLaotianLatvianLebaneseLiberianLithuanianLumbeeLuxembourgerMacedonianMalaysianMalteseMarshalleseMenomineeMexicanMexican American IndianMongolianMoroccanNative HawaiianNavajoNepaleseNew ZealanderNicaraguanNigerianNorthern EuropeanNorwegianOkinawanOsageOttawaPaiutePakistaniPalestinianPanamanianParaguayanPennsylvania GermanPeruvianPimaPolishPortuguesePotawatomiPuebloPuerto RicanPuget Sound SalishRomanianRussianSalvadoranSamoanScandinavianScotch-IrishScottishSeminoleSenegaleseSerbianShoshoneSierra LeoneanSiouxSlavicSlovakSloveneSomaliSouth AfricanSouth AmericanSouth American IndianSoviet UnionSpaniardSpanishSpanish AmericanSpanish American IndianSri LankanSubsaharan AfricanSudaneseSwedishSwissSyrianTaiwaneseThaiTlingit-HaidaTohono O'OdhamTonganTrinidadian and TobagonianTsimshianTurkishU.S. Virgin IslanderUgandanUkrainianUruguayanUteVenezuelanVietnameseWelshWest IndianYakamaYaquiYugoslavianYumanYup'ikZimbabwean
Immigration
NonimmigrantsImmigrantsAfghanistanAfricaAlbaniaArgentinaArmeniaAsiaAustraliaAustriaBahamasBangladeshBarbadosBelarusBelgiumBelizeBoliviaBosnia and HerzegovinaBrazilBulgariaBurma/MyanmarCabo VerdeCambodiaCameroonCanadaCaribbeanCentral AmericaChileChinaColombiaCongoCosta RicaCroatiaCubaCzechoslovakiaDenmarkDominicaDominican RepublicEastern AfricaEastern AsiaEastern EuropeEcuadorEgyptEl SalvadorEnglandEritreaEthiopiaEuropeFijiFranceGermanyGhanaGreeceGrenadaGuatemalaGuyanaHaitiHondurasHong KongHungaryIndiaIndonesiaIranIraqIrelandIsraelItalyJamaicaJapanJordanKazakhstanKenyaKoreaKuwaitLaosLatin AmericaLatviaLebanonLiberiaLithuaniaMalaysiaMexicoMicronesiaMiddle AfricaMoldovaMoroccoNepalNetherlandsNicaraguaNigeriaNorth AmericaNorth MacedoniaNorthern AfricaNorthern EuropeNorwayOceaniaPakistanPanamaPeruPhilippinesPolandPortugalRomaniaRussiaSaudi ArabiaScotlandSenegalSerbiaSierra LeoneSingaporeSomaliaSouth AfricaSouth AmericaSouth Central AsiaSouth Eastern AsiaSouthern EuropeSpainSri LankaSt. Vincent and the GrenadinesSudanSwedenSwitzerlandSyriaTaiwanThailandTrinidad and TobagoTurkeyUgandaUkraineUruguayUzbekistanVenezuelaVietnamWest IndiesWestern AfricaWestern AsiaWestern EuropeYemenZaireZimbabweAzores
Select to Compare
Race
Ancestry
AfghanAfricanAlaska NativeAlaskan AthabascanAlbanianAleutAlsatianAmericanApacheArabArapahoArgentineanArmenianAssyrian/Chaldean/SyriacAustralianAustrianBahamianBangladeshiBarbadianBasqueBelgianBelizeanBermudanBhutaneseBlackfeetBolivianBrazilianBritishBritish West IndianBulgarianBurmeseCajunCambodianCanadianCape VerdeanCarpatho RusynCelticCentral AmericanCentral American IndianCherokeeCheyenneChickasawChileanChineseChippewaChoctawColombianColvilleComancheCosta RicanCreeCreekCroatianCrowCubanCypriotCzechCzechoslovakianDanishDelawareDominicanDutchDutch West IndianEastern EuropeanEcuadorianEgyptianEnglishEstonianEthiopianEuropeanFijianFilipinoFinnishFrenchFrench American IndianFrench CanadianGermanGerman RussianGhanaianGreekGuamanian/ChamorroGuatemalanGuyaneseHaitianHmongHonduranHopiHoumaHungarianIcelanderIndian (Asian)IndonesianInupiatIranianIraqiIrishIroquoisIsraeliItalianJamaicanJapaneseJordanianKiowaKoreanLaotianLatvianLebaneseLiberianLithuanianLumbeeLuxembourgerMacedonianMalaysianMalteseMarshalleseMenomineeMexicanMexican American IndianMongolianMoroccanNative HawaiianNavajoNepaleseNew ZealanderNicaraguanNigerianNorthern EuropeanNorwegianOkinawanOsageOttawaPaiutePakistaniPalestinianPanamanianParaguayanPennsylvania GermanPeruvianPimaPolishPortuguesePotawatomiPuebloPuerto RicanPuget Sound SalishRomanianRussianSalvadoranSamoanScandinavianScotch-IrishScottishSeminoleSenegaleseSerbianShoshoneSierra LeoneanSiouxSlavicSlovakSloveneSomaliSouth AfricanSouth AmericanSouth American IndianSoviet UnionSpaniardSpanishSpanish AmericanSpanish American IndianSri LankanSubsaharan AfricanSudaneseSwedishSwissSyrianTaiwaneseThaiTlingit-HaidaTohono O'OdhamTonganTrinidadian and TobagonianTsimshianTurkishU.S. Virgin IslanderUgandanUkrainianUruguayanUteVenezuelanVietnameseWelshWest IndianYakamaYaquiYugoslavianYumanYup'ikZimbabwean
Immigration
NonimmigrantsImmigrantsAfghanistanAfricaAlbaniaArgentinaArmeniaAsiaAustraliaAustriaBahamasBangladeshBarbadosBelarusBelgiumBelizeBoliviaBosnia and HerzegovinaBrazilBulgariaBurma/MyanmarCabo VerdeCambodiaCameroonCanadaCaribbeanCentral AmericaChileChinaColombiaCongoCosta RicaCroatiaCubaCzechoslovakiaDenmarkDominicaDominican RepublicEastern AfricaEastern AsiaEastern EuropeEcuadorEgyptEl SalvadorEnglandEritreaEthiopiaEuropeFijiFranceGermanyGhanaGreeceGrenadaGuatemalaGuyanaHaitiHondurasHong KongHungaryIndiaIndonesiaIranIraqIrelandIsraelItalyJamaicaJapanJordanKazakhstanKenyaKoreaKuwaitLaosLatin AmericaLatviaLebanonLiberiaLithuaniaMalaysiaMexicoMicronesiaMiddle AfricaMoldovaMoroccoNepalNetherlandsNicaraguaNigeriaNorth AmericaNorth MacedoniaNorthern AfricaNorthern EuropeNorwayOceaniaPakistanPanamaPeruPhilippinesPolandPortugalRomaniaRussiaSaudi ArabiaScotlandSenegalSerbiaSierra LeoneSingaporeSomaliaSouth AfricaSouth AmericaSouth Central AsiaSouth Eastern AsiaSouthern EuropeSpainSri LankaSt. Vincent and the GrenadinesSudanSwedenSwitzerlandSyriaTaiwanThailandTrinidad and TobagoTurkeyUgandaUkraineUruguayUzbekistanVenezuelaVietnamWest IndiesWestern AfricaWestern AsiaWestern EuropeYemenZaireZimbabweAzores
Married-Couple Family Poverty
Income
Poverty
Unemployment
Labor Participation
Family Structure
Vehicle Availability
Education Level
Disability

Kenyan Married-Couple Family Poverty
Exceptional

4.8%
POVERTY | MARRIED-COUPLE FAMILIES
94.7/ 100
METRIC RATING
117th/ 347
METRIC RANK

Kenyan Married-Couple Family Poverty Correlation Chart

The statistical analysis conducted on geographies consisting of 167,574,201 people shows a substantial positive correlation between the proportion of Kenyans and poverty level among married-couple families in the United States with a correlation coefficient (R) of 0.577 and weighted average of 4.8%. On average, for every 1% (one percent) increase in Kenyans within a typical geography, there is an increase of 0.52% in poverty level among married-couple families.
Kenyan Married-Couple Family Poverty
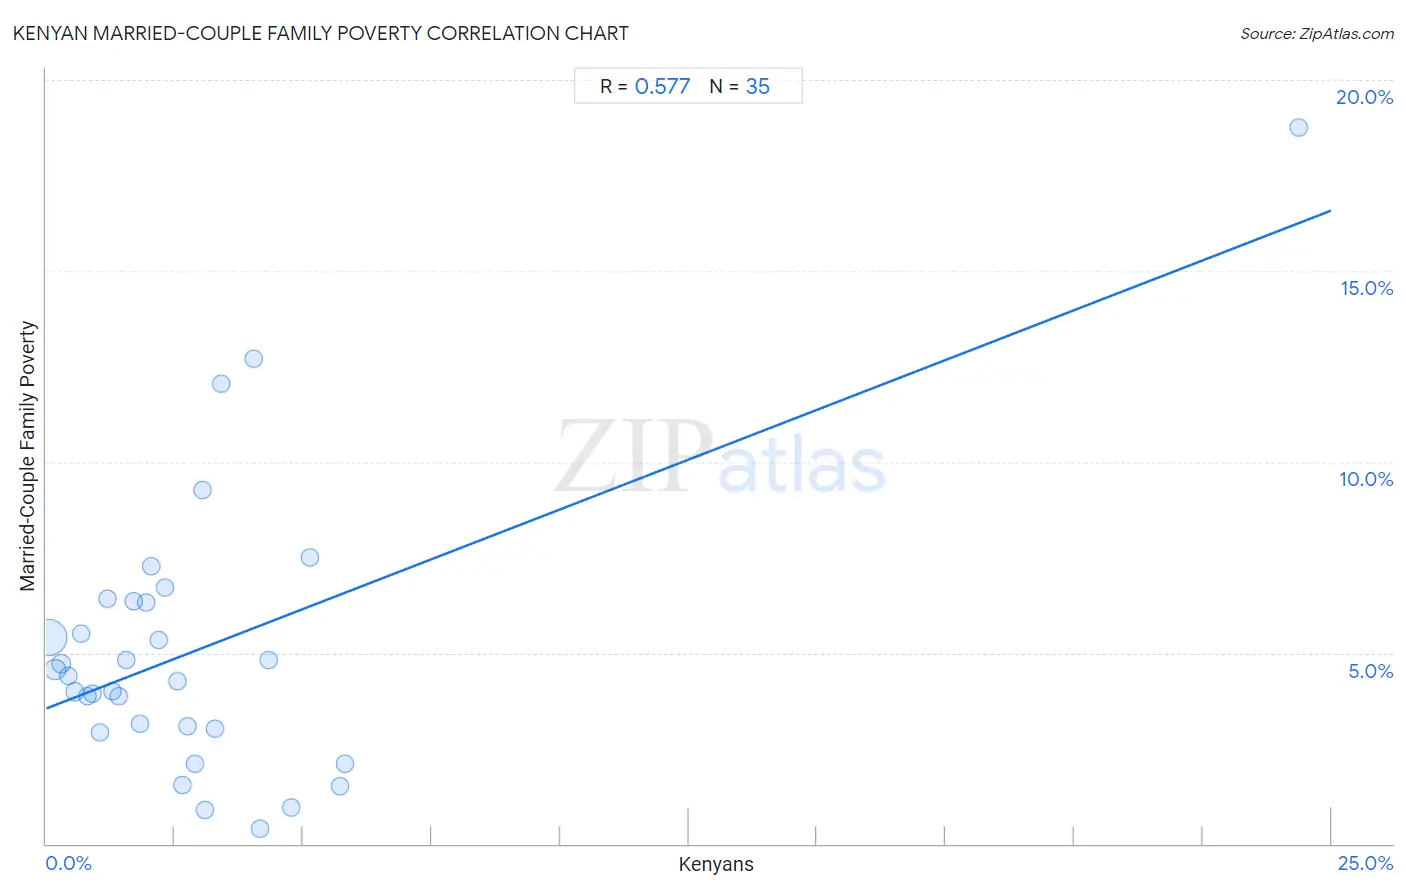
It is essential to understand that the correlation between the percentage of Kenyans and poverty level among married-couple families does not imply a direct cause-and-effect relationship. It remains uncertain whether the presence of Kenyans influences an upward or downward trend in the level of poverty level among married-couple families within an area, or if Kenyans simply ended up residing in those areas with higher or lower levels of poverty level among married-couple families due to other factors.

Demographics Similar to Kenyans by Married-Couple Family Poverty

In terms of married-couple family poverty, the demographic groups most similar to Kenyans are Immigrants from Philippines (4.8%, a difference of 0.020%), Celtic (4.8%, a difference of 0.10%), Taiwanese (4.8%, a difference of 0.11%), Immigrants from Indonesia (4.8%, a difference of 0.26%), and Immigrants from Eastern Asia (4.8%, a difference of 0.39%).
DemographicsRating | RankMarried-Couple Family Poverty
Immigrants from Bolivia
96.2
/100
|
#110
Exceptional
4.7%
Pakistanis
96.2
/100
|
#111
Exceptional
4.7%
Tongans
95.9
/100
|
#112
Exceptional
4.7%
Immigrants from Nepal
95.9
/100
|
#113
Exceptional
4.7%
Immigrants from Indonesia
95.1
/100
|
#114
Exceptional
4.8%
Taiwanese
94.8
/100
|
#115
Exceptional
4.8%
Celtics
94.8
/100
|
#116
Exceptional
4.8%
Kenyans
94.7
/100
|
#117
Exceptional
4.8%
Immigrants from Philippines
94.6
/100
|
#118
Exceptional
4.8%
Immigrants from Eastern Asia
94.0
/100
|
#119
Exceptional
4.8%
Immigrants from Southern Europe
93.4
/100
|
#120
Exceptional
4.8%
Indians (Asian)
93.2
/100
|
#121
Exceptional
4.8%
Whites/Caucasians
93.1
/100
|
#122
Exceptional
4.8%
Jordanians
93.1
/100
|
#123
Exceptional
4.8%
Romanians
92.5
/100
|
#124
Exceptional
4.8%

Kenyan Married-Couple Family Poverty Correlation Summary

MeasurementKenyan DataMarried-Couple Family Poverty Data
Minimum0.039%0.40%
Maximum24.4%18.8%
Range24.3%18.3%
Mean3.0%5.1%
Median2.2%4.4%
Interquartile 25% (IQ1)1.1%3.0%
Interquartile 75% (IQ3)3.4%6.3%
Interquartile Range (IQR)2.3%3.3%
Standard Deviation (Sample)4.0%3.7%
Standard Deviation (Population)4.0%3.6%

Correlation Details

Kenyan PercentileSample SizeMarried-Couple Family Poverty
[
0.0%
-
0.5%
]
0.039%
126,361,4685.4%
[
0.0%
-
0.5%
]
0.17%
21,707,8344.6%
[
0.0%
-
0.5%
]
0.30%
8,355,2594.7%
[
0.0%
-
0.5%
]
0.43%
4,657,6564.4%
[
0.5%
-
1.0%
]
0.55%
2,112,4454.0%
[
0.5%
-
1.0%
]
0.67%
1,141,3535.5%
[
0.5%
-
1.0%
]
0.80%
920,3283.9%
[
0.5%
-
1.0%
]
0.90%
420,6503.9%
[
1.0%
-
1.5%
]
1.05%
404,7732.9%
[
1.0%
-
1.5%
]
1.19%
326,4926.4%
[
1.0%
-
1.5%
]
1.30%
229,4764.0%
[
1.0%
-
1.5%
]
1.40%
189,8783.9%
[
1.5%
-
2.0%
]
1.56%
185,1784.8%
[
1.5%
-
2.0%
]
1.69%
93,9336.3%
[
1.5%
-
2.0%
]
1.82%
29,8293.1%
[
1.5%
-
2.0%
]
1.95%
131,0696.3%
[
2.0%
-
2.5%
]
2.05%
69,6127.3%
[
2.0%
-
2.5%
]
2.18%
82,9725.3%
[
2.0%
-
2.5%
]
2.32%
50,9806.7%
[
2.5%
-
3.0%
]
2.56%
5864.3%
[
2.5%
-
3.0%
]
2.65%
32,1861.5%
[
2.5%
-
3.0%
]
2.75%
8,2303.1%
[
2.5%
-
3.0%
]
2.90%
3,9662.1%
[
3.0%
-
3.5%
]
3.03%
5,9409.3%
[
3.0%
-
3.5%
]
3.10%
8,3890.88%
[
3.0%
-
3.5%
]
3.29%
2,0343.0%
[
3.0%
-
3.5%
]
3.40%
2,76412.1%
[
4.0%
-
4.5%
]
4.03%
3,91712.7%
[
4.0%
-
4.5%
]
4.15%
9,8220.40%
[
4.0%
-
4.5%
]
4.32%
2,4744.8%
[
4.5%
-
5.0%
]
4.77%
9,3320.94%
[
5.0%
-
5.5%
]
5.13%
4,9957.5%
[
5.5%
-
6.0%
]
5.71%
4,7281.5%
[
5.5%
-
6.0%
]
5.82%
3,2142.1%
[
24.0%
-
24.5%
]
24.37%
43918.8%