Immigrants from Northern Europe Married-Couple Family Poverty

COMPARE

Immigrants from Northern Europe
Race
Ancestry
AfghanAfricanAlaska NativeAlaskan AthabascanAlbanianAleutAlsatianAmericanApacheArabArapahoArgentineanArmenianAssyrian/Chaldean/SyriacAustralianAustrianBahamianBangladeshiBarbadianBasqueBelgianBelizeanBermudanBhutaneseBlackfeetBolivianBrazilianBritishBritish West IndianBulgarianBurmeseCajunCambodianCanadianCape VerdeanCarpatho RusynCelticCentral AmericanCentral American IndianCherokeeCheyenneChickasawChileanChineseChippewaChoctawColombianColvilleComancheCosta RicanCreeCreekCroatianCrowCubanCypriotCzechCzechoslovakianDanishDelawareDominicanDutchDutch West IndianEastern EuropeanEcuadorianEgyptianEnglishEstonianEthiopianEuropeanFijianFilipinoFinnishFrenchFrench American IndianFrench CanadianGermanGerman RussianGhanaianGreekGuamanian/ChamorroGuatemalanGuyaneseHaitianHmongHonduranHopiHoumaHungarianIcelanderIndian (Asian)IndonesianInupiatIranianIraqiIrishIroquoisIsraeliItalianJamaicanJapaneseJordanianKenyanKiowaKoreanLaotianLatvianLebaneseLiberianLithuanianLumbeeLuxembourgerMacedonianMalaysianMalteseMarshalleseMenomineeMexicanMexican American IndianMongolianMoroccanNative HawaiianNavajoNepaleseNew ZealanderNicaraguanNigerianNorthern EuropeanNorwegianOkinawanOsageOttawaPaiutePakistaniPalestinianPanamanianParaguayanPennsylvania GermanPeruvianPimaPolishPortuguesePotawatomiPuebloPuerto RicanPuget Sound SalishRomanianRussianSalvadoranSamoanScandinavianScotch-IrishScottishSeminoleSenegaleseSerbianShoshoneSierra LeoneanSiouxSlavicSlovakSloveneSomaliSouth AfricanSouth AmericanSouth American IndianSoviet UnionSpaniardSpanishSpanish AmericanSpanish American IndianSri LankanSubsaharan AfricanSudaneseSwedishSwissSyrianTaiwaneseThaiTlingit-HaidaTohono O'OdhamTonganTrinidadian and TobagonianTsimshianTurkishU.S. Virgin IslanderUgandanUkrainianUruguayanUteVenezuelanVietnameseWelshWest IndianYakamaYaquiYugoslavianYumanYup'ikZimbabwean
Immigration
NonimmigrantsImmigrantsAfghanistanAfricaAlbaniaArgentinaArmeniaAsiaAustraliaAustriaBahamasBangladeshBarbadosBelarusBelgiumBelizeBoliviaBosnia and HerzegovinaBrazilBulgariaBurma/MyanmarCabo VerdeCambodiaCameroonCanadaCaribbeanCentral AmericaChileChinaColombiaCongoCosta RicaCroatiaCubaCzechoslovakiaDenmarkDominicaDominican RepublicEastern AfricaEastern AsiaEastern EuropeEcuadorEgyptEl SalvadorEnglandEritreaEthiopiaEuropeFijiFranceGermanyGhanaGreeceGrenadaGuatemalaGuyanaHaitiHondurasHong KongHungaryIndiaIndonesiaIranIraqIrelandIsraelItalyJamaicaJapanJordanKazakhstanKenyaKoreaKuwaitLaosLatin AmericaLatviaLebanonLiberiaLithuaniaMalaysiaMexicoMicronesiaMiddle AfricaMoldovaMoroccoNepalNetherlandsNicaraguaNigeriaNorth AmericaNorth MacedoniaNorthern AfricaNorthern EuropeNorwayOceaniaPakistanPanamaPeruPhilippinesPolandPortugalRomaniaRussiaSaudi ArabiaScotlandSenegalSerbiaSierra LeoneSingaporeSomaliaSouth AfricaSouth AmericaSouth Central AsiaSouth Eastern AsiaSouthern EuropeSpainSri LankaSt. Vincent and the GrenadinesSudanSwedenSwitzerlandSyriaTaiwanThailandTrinidad and TobagoTurkeyUgandaUkraineUruguayUzbekistanVenezuelaVietnamWest IndiesWestern AfricaWestern AsiaWestern EuropeYemenZaireZimbabweAzores
Select to Compare
Race
Ancestry
AfghanAfricanAlaska NativeAlaskan AthabascanAlbanianAleutAlsatianAmericanApacheArabArapahoArgentineanArmenianAssyrian/Chaldean/SyriacAustralianAustrianBahamianBangladeshiBarbadianBasqueBelgianBelizeanBermudanBhutaneseBlackfeetBolivianBrazilianBritishBritish West IndianBulgarianBurmeseCajunCambodianCanadianCape VerdeanCarpatho RusynCelticCentral AmericanCentral American IndianCherokeeCheyenneChickasawChileanChineseChippewaChoctawColombianColvilleComancheCosta RicanCreeCreekCroatianCrowCubanCypriotCzechCzechoslovakianDanishDelawareDominicanDutchDutch West IndianEastern EuropeanEcuadorianEgyptianEnglishEstonianEthiopianEuropeanFijianFilipinoFinnishFrenchFrench American IndianFrench CanadianGermanGerman RussianGhanaianGreekGuamanian/ChamorroGuatemalanGuyaneseHaitianHmongHonduranHopiHoumaHungarianIcelanderIndian (Asian)IndonesianInupiatIranianIraqiIrishIroquoisIsraeliItalianJamaicanJapaneseJordanianKenyanKiowaKoreanLaotianLatvianLebaneseLiberianLithuanianLumbeeLuxembourgerMacedonianMalaysianMalteseMarshalleseMenomineeMexicanMexican American IndianMongolianMoroccanNative HawaiianNavajoNepaleseNew ZealanderNicaraguanNigerianNorthern EuropeanNorwegianOkinawanOsageOttawaPaiutePakistaniPalestinianPanamanianParaguayanPennsylvania GermanPeruvianPimaPolishPortuguesePotawatomiPuebloPuerto RicanPuget Sound SalishRomanianRussianSalvadoranSamoanScandinavianScotch-IrishScottishSeminoleSenegaleseSerbianShoshoneSierra LeoneanSiouxSlavicSlovakSloveneSomaliSouth AfricanSouth AmericanSouth American IndianSoviet UnionSpaniardSpanishSpanish AmericanSpanish American IndianSri LankanSubsaharan AfricanSudaneseSwedishSwissSyrianTaiwaneseThaiTlingit-HaidaTohono O'OdhamTonganTrinidadian and TobagonianTsimshianTurkishU.S. Virgin IslanderUgandanUkrainianUruguayanUteVenezuelanVietnameseWelshWest IndianYakamaYaquiYugoslavianYumanYup'ikZimbabwean
Immigration
NonimmigrantsImmigrantsAfghanistanAfricaAlbaniaArgentinaArmeniaAsiaAustraliaAustriaBahamasBangladeshBarbadosBelarusBelgiumBelizeBoliviaBosnia and HerzegovinaBrazilBulgariaBurma/MyanmarCabo VerdeCambodiaCameroonCanadaCaribbeanCentral AmericaChileChinaColombiaCongoCosta RicaCroatiaCubaCzechoslovakiaDenmarkDominicaDominican RepublicEastern AfricaEastern AsiaEastern EuropeEcuadorEgyptEl SalvadorEnglandEritreaEthiopiaEuropeFijiFranceGermanyGhanaGreeceGrenadaGuatemalaGuyanaHaitiHondurasHong KongHungaryIndiaIndonesiaIranIraqIrelandIsraelItalyJamaicaJapanJordanKazakhstanKenyaKoreaKuwaitLaosLatin AmericaLatviaLebanonLiberiaLithuaniaMalaysiaMexicoMicronesiaMiddle AfricaMoldovaMoroccoNepalNetherlandsNicaraguaNigeriaNorth AmericaNorth MacedoniaNorthern AfricaNorwayOceaniaPakistanPanamaPeruPhilippinesPolandPortugalRomaniaRussiaSaudi ArabiaScotlandSenegalSerbiaSierra LeoneSingaporeSomaliaSouth AfricaSouth AmericaSouth Central AsiaSouth Eastern AsiaSouthern EuropeSpainSri LankaSt. Vincent and the GrenadinesSudanSwedenSwitzerlandSyriaTaiwanThailandTrinidad and TobagoTurkeyUgandaUkraineUruguayUzbekistanVenezuelaVietnamWest IndiesWestern AfricaWestern AsiaWestern EuropeYemenZaireZimbabweAzores
Married-Couple Family Poverty
Income
Poverty
Unemployment
Labor Participation
Family Structure
Vehicle Availability
Education Level
Disability

Immigrants from Northern Europe Married-Couple Family Poverty
Exceptional

4.2%
POVERTY | MARRIED-COUPLE FAMILIES
99.8/ 100
METRIC RATING
39th/ 347
METRIC RANK

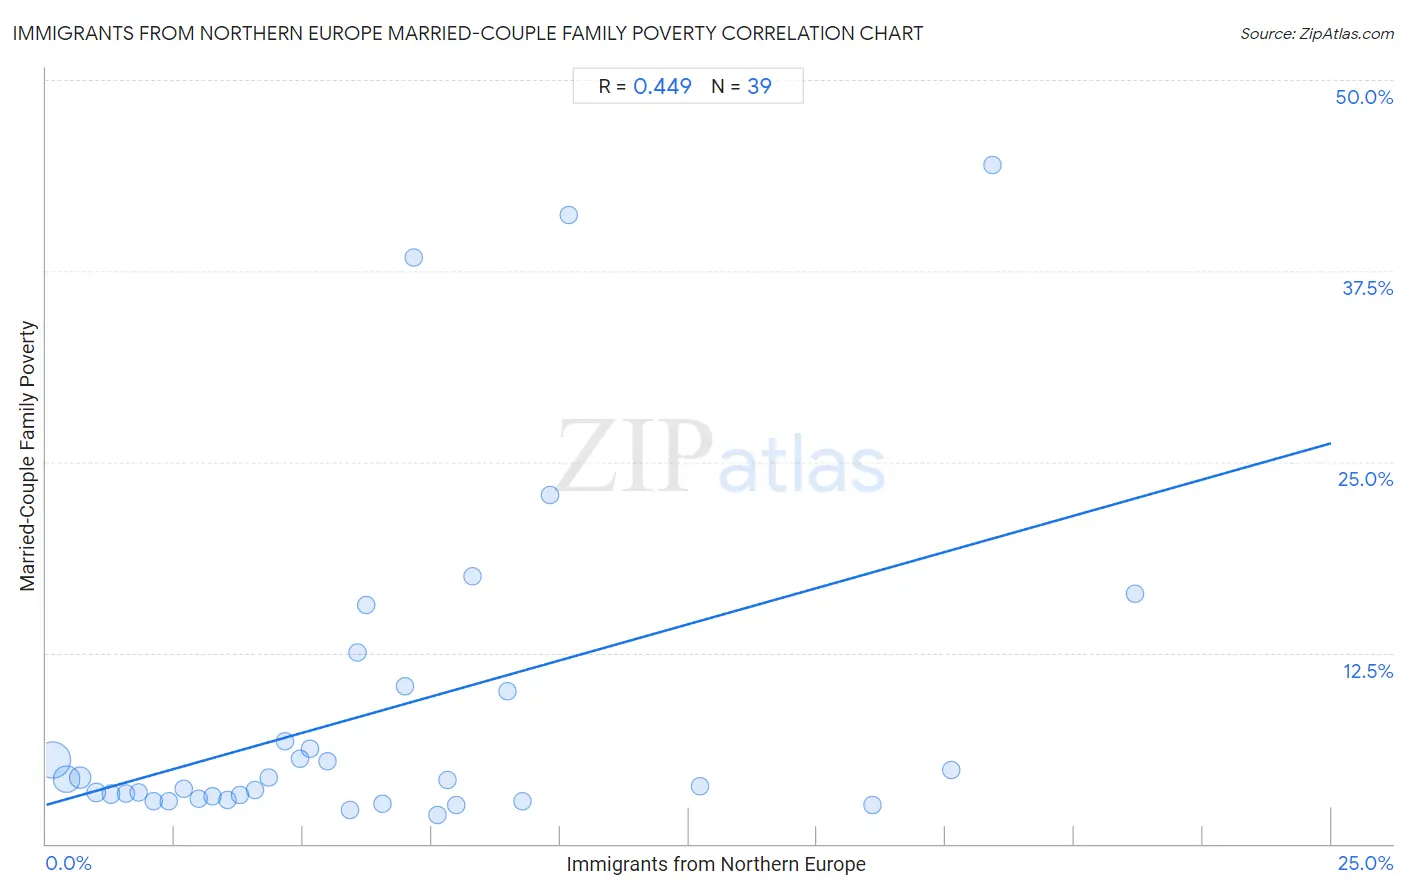
Immigrants from Northern Europe Married-Couple Family Poverty Correlation Chart

The statistical analysis conducted on geographies consisting of 470,220,521 people shows a moderate positive correlation between the proportion of Immigrants from Northern Europe and poverty level among married-couple families in the United States with a correlation coefficient (R) of 0.449 and weighted average of 4.2%. On average, for every 1% (one percent) increase in Immigrants from Northern Europe within a typical geography, there is an increase of 0.95% in poverty level among married-couple families.
Immigrants from Northern Europe Married-Couple Family Poverty
It is essential to understand that the correlation between the percentage of Immigrants from Northern Europe and poverty level among married-couple families does not imply a direct cause-and-effect relationship. It remains uncertain whether the presence of Immigrants from Northern Europe influences an upward or downward trend in the level of poverty level among married-couple families within an area, or if Immigrants from Northern Europe simply ended up residing in those areas with higher or lower levels of poverty level among married-couple families due to other factors.

Demographics Similar to Immigrants from Northern Europe by Married-Couple Family Poverty

In terms of married-couple family poverty, the demographic groups most similar to Immigrants from Northern Europe are Belgian (4.2%, a difference of 0.13%), Iranian (4.2%, a difference of 0.25%), French Canadian (4.2%, a difference of 0.28%), English (4.2%, a difference of 0.32%), and European (4.2%, a difference of 0.35%).
DemographicsRating | RankMarried-Couple Family Poverty
Greeks
99.9
/100
|
#32
Exceptional
4.2%
Irish
99.9
/100
|
#33
Exceptional
4.2%
Dutch
99.9
/100
|
#34
Exceptional
4.2%
Europeans
99.9
/100
|
#35
Exceptional
4.2%
English
99.9
/100
|
#36
Exceptional
4.2%
Iranians
99.9
/100
|
#37
Exceptional
4.2%
Belgians
99.9
/100
|
#38
Exceptional
4.2%
Immigrants from Northern Europe
99.8
/100
|
#39
Exceptional
4.2%
French Canadians
99.8
/100
|
#40
Exceptional
4.2%
Northern Europeans
99.8
/100
|
#41
Exceptional
4.3%
Scottish
99.8
/100
|
#42
Exceptional
4.3%
Swiss
99.8
/100
|
#43
Exceptional
4.3%
Immigrants from Japan
99.8
/100
|
#44
Exceptional
4.3%
Serbians
99.8
/100
|
#45
Exceptional
4.3%
British
99.8
/100
|
#46
Exceptional
4.3%

Immigrants from Northern Europe Married-Couple Family Poverty Correlation Summary

MeasurementImmigrants from Northern Europe DataMarried-Couple Family Poverty Data
Minimum0.13%1.9%
Maximum21.2%44.4%
Range21.1%42.6%
Mean6.4%8.6%
Median5.5%4.2%
Interquartile 25% (IQ1)2.7%3.0%
Interquartile 75% (IQ3)8.3%10.0%
Interquartile Range (IQR)5.6%7.0%
Standard Deviation (Sample)5.1%10.7%
Standard Deviation (Population)5.0%10.6%

Correlation Details

Immigrants from Northern Europe PercentileSample SizeMarried-Couple Family Poverty
[
0.0%
-
0.5%
]
0.13%
269,975,5005.5%
[
0.0%
-
0.5%
]
0.40%
113,944,4404.2%
[
0.5%
-
1.0%
]
0.66%
49,674,4164.3%
[
0.5%
-
1.0%
]
0.97%
17,714,7443.3%
[
1.0%
-
1.5%
]
1.26%
8,398,6383.2%
[
1.5%
-
2.0%
]
1.55%
4,887,9483.3%
[
1.5%
-
2.0%
]
1.80%
1,993,1933.3%
[
2.0%
-
2.5%
]
2.08%
1,477,6342.8%
[
2.0%
-
2.5%
]
2.38%
649,6142.8%
[
2.5%
-
3.0%
]
2.68%
406,1953.6%
[
2.5%
-
3.0%
]
2.96%
261,1723.0%
[
3.0%
-
3.5%
]
3.23%
218,3473.1%
[
3.5%
-
4.0%
]
3.53%
172,9262.9%
[
3.5%
-
4.0%
]
3.77%
147,2023.2%
[
4.0%
-
4.5%
]
4.07%
78,0313.5%
[
4.0%
-
4.5%
]
4.33%
62,2844.4%
[
4.5%
-
5.0%
]
4.64%
29,7356.7%
[
4.5%
-
5.0%
]
4.93%
14,0555.6%
[
5.0%
-
5.5%
]
5.13%
17,6866.2%
[
5.0%
-
5.5%
]
5.48%
40,1275.4%
[
5.5%
-
6.0%
]
5.90%
20,4752.2%
[
6.0%
-
6.5%
]
6.06%
97412.6%
[
6.0%
-
6.5%
]
6.22%
94815.6%
[
6.5%
-
7.0%
]
6.53%
15,6022.6%
[
6.5%
-
7.0%
]
6.97%
11,53710.3%
[
7.0%
-
7.5%
]
7.14%
37838.4%
[
7.5%
-
8.0%
]
7.60%
4341.9%
[
7.5%
-
8.0%
]
7.82%
1,4974.2%
[
7.5%
-
8.0%
]
7.96%
2262.6%
[
8.0%
-
8.5%
]
8.29%
53117.5%
[
8.5%
-
9.0%
]
8.97%
1,48310.0%
[
9.0%
-
9.5%
]
9.26%
8422.8%
[
9.5%
-
10.0%
]
9.80%
15322.9%
[
10.0%
-
10.5%
]
10.17%
5941.2%
[
12.5%
-
13.0%
]
12.71%
2913.8%
[
16.0%
-
16.5%
]
16.07%
3612.5%
[
17.5%
-
18.0%
]
17.61%
3524.8%
[
18.0%
-
18.5%
]
18.42%
3844.4%
[
21.0%
-
21.5%
]
21.19%
45316.4%