French American Indian Married-Couple Family Poverty

COMPARE

French American Indian
Race
Ancestry
AfghanAfricanAlaska NativeAlaskan AthabascanAlbanianAleutAlsatianAmericanApacheArabArapahoArgentineanArmenianAssyrian/Chaldean/SyriacAustralianAustrianBahamianBangladeshiBarbadianBasqueBelgianBelizeanBermudanBhutaneseBlackfeetBolivianBrazilianBritishBritish West IndianBulgarianBurmeseCajunCambodianCanadianCape VerdeanCarpatho RusynCelticCentral AmericanCentral American IndianCherokeeCheyenneChickasawChileanChineseChippewaChoctawColombianColvilleComancheCosta RicanCreeCreekCroatianCrowCubanCypriotCzechCzechoslovakianDanishDelawareDominicanDutchDutch West IndianEastern EuropeanEcuadorianEgyptianEnglishEstonianEthiopianEuropeanFijianFilipinoFinnishFrenchFrench American IndianFrench CanadianGermanGerman RussianGhanaianGreekGuamanian/ChamorroGuatemalanGuyaneseHaitianHmongHonduranHopiHoumaHungarianIcelanderIndian (Asian)IndonesianInupiatIranianIraqiIrishIroquoisIsraeliItalianJamaicanJapaneseJordanianKenyanKiowaKoreanLaotianLatvianLebaneseLiberianLithuanianLumbeeLuxembourgerMacedonianMalaysianMalteseMarshalleseMenomineeMexicanMexican American IndianMongolianMoroccanNative HawaiianNavajoNepaleseNew ZealanderNicaraguanNigerianNorthern EuropeanNorwegianOkinawanOsageOttawaPaiutePakistaniPalestinianPanamanianParaguayanPennsylvania GermanPeruvianPimaPolishPortuguesePotawatomiPuebloPuerto RicanPuget Sound SalishRomanianRussianSalvadoranSamoanScandinavianScotch-IrishScottishSeminoleSenegaleseSerbianShoshoneSierra LeoneanSiouxSlavicSlovakSloveneSomaliSouth AfricanSouth AmericanSouth American IndianSoviet UnionSpaniardSpanishSpanish AmericanSpanish American IndianSri LankanSubsaharan AfricanSudaneseSwedishSwissSyrianTaiwaneseThaiTlingit-HaidaTohono O'OdhamTonganTrinidadian and TobagonianTsimshianTurkishU.S. Virgin IslanderUgandanUkrainianUruguayanUteVenezuelanVietnameseWelshWest IndianYakamaYaquiYugoslavianYumanYup'ikZimbabwean
Immigration
NonimmigrantsImmigrantsAfghanistanAfricaAlbaniaArgentinaArmeniaAsiaAustraliaAustriaBahamasBangladeshBarbadosBelarusBelgiumBelizeBoliviaBosnia and HerzegovinaBrazilBulgariaBurma/MyanmarCabo VerdeCambodiaCameroonCanadaCaribbeanCentral AmericaChileChinaColombiaCongoCosta RicaCroatiaCubaCzechoslovakiaDenmarkDominicaDominican RepublicEastern AfricaEastern AsiaEastern EuropeEcuadorEgyptEl SalvadorEnglandEritreaEthiopiaEuropeFijiFranceGermanyGhanaGreeceGrenadaGuatemalaGuyanaHaitiHondurasHong KongHungaryIndiaIndonesiaIranIraqIrelandIsraelItalyJamaicaJapanJordanKazakhstanKenyaKoreaKuwaitLaosLatin AmericaLatviaLebanonLiberiaLithuaniaMalaysiaMexicoMicronesiaMiddle AfricaMoldovaMoroccoNepalNetherlandsNicaraguaNigeriaNorth AmericaNorth MacedoniaNorthern AfricaNorthern EuropeNorwayOceaniaPakistanPanamaPeruPhilippinesPolandPortugalRomaniaRussiaSaudi ArabiaScotlandSenegalSerbiaSierra LeoneSingaporeSomaliaSouth AfricaSouth AmericaSouth Central AsiaSouth Eastern AsiaSouthern EuropeSpainSri LankaSt. Vincent and the GrenadinesSudanSwedenSwitzerlandSyriaTaiwanThailandTrinidad and TobagoTurkeyUgandaUkraineUruguayUzbekistanVenezuelaVietnamWest IndiesWestern AfricaWestern AsiaWestern EuropeYemenZaireZimbabweAzores
Select to Compare
Race
Ancestry
AfghanAfricanAlaska NativeAlaskan AthabascanAlbanianAleutAlsatianAmericanApacheArabArapahoArgentineanArmenianAssyrian/Chaldean/SyriacAustralianAustrianBahamianBangladeshiBarbadianBasqueBelgianBelizeanBermudanBhutaneseBlackfeetBolivianBrazilianBritishBritish West IndianBulgarianBurmeseCajunCambodianCanadianCape VerdeanCarpatho RusynCelticCentral AmericanCentral American IndianCherokeeCheyenneChickasawChileanChineseChippewaChoctawColombianColvilleComancheCosta RicanCreeCreekCroatianCrowCubanCypriotCzechCzechoslovakianDanishDelawareDominicanDutchDutch West IndianEastern EuropeanEcuadorianEgyptianEnglishEstonianEthiopianEuropeanFijianFilipinoFinnishFrenchFrench CanadianGermanGerman RussianGhanaianGreekGuamanian/ChamorroGuatemalanGuyaneseHaitianHmongHonduranHopiHoumaHungarianIcelanderIndian (Asian)IndonesianInupiatIranianIraqiIrishIroquoisIsraeliItalianJamaicanJapaneseJordanianKenyanKiowaKoreanLaotianLatvianLebaneseLiberianLithuanianLumbeeLuxembourgerMacedonianMalaysianMalteseMarshalleseMenomineeMexicanMexican American IndianMongolianMoroccanNative HawaiianNavajoNepaleseNew ZealanderNicaraguanNigerianNorthern EuropeanNorwegianOkinawanOsageOttawaPaiutePakistaniPalestinianPanamanianParaguayanPennsylvania GermanPeruvianPimaPolishPortuguesePotawatomiPuebloPuerto RicanPuget Sound SalishRomanianRussianSalvadoranSamoanScandinavianScotch-IrishScottishSeminoleSenegaleseSerbianShoshoneSierra LeoneanSiouxSlavicSlovakSloveneSomaliSouth AfricanSouth AmericanSouth American IndianSoviet UnionSpaniardSpanishSpanish AmericanSpanish American IndianSri LankanSubsaharan AfricanSudaneseSwedishSwissSyrianTaiwaneseThaiTlingit-HaidaTohono O'OdhamTonganTrinidadian and TobagonianTsimshianTurkishU.S. Virgin IslanderUgandanUkrainianUruguayanUteVenezuelanVietnameseWelshWest IndianYakamaYaquiYugoslavianYumanYup'ikZimbabwean
Immigration
NonimmigrantsImmigrantsAfghanistanAfricaAlbaniaArgentinaArmeniaAsiaAustraliaAustriaBahamasBangladeshBarbadosBelarusBelgiumBelizeBoliviaBosnia and HerzegovinaBrazilBulgariaBurma/MyanmarCabo VerdeCambodiaCameroonCanadaCaribbeanCentral AmericaChileChinaColombiaCongoCosta RicaCroatiaCubaCzechoslovakiaDenmarkDominicaDominican RepublicEastern AfricaEastern AsiaEastern EuropeEcuadorEgyptEl SalvadorEnglandEritreaEthiopiaEuropeFijiFranceGermanyGhanaGreeceGrenadaGuatemalaGuyanaHaitiHondurasHong KongHungaryIndiaIndonesiaIranIraqIrelandIsraelItalyJamaicaJapanJordanKazakhstanKenyaKoreaKuwaitLaosLatin AmericaLatviaLebanonLiberiaLithuaniaMalaysiaMexicoMicronesiaMiddle AfricaMoldovaMoroccoNepalNetherlandsNicaraguaNigeriaNorth AmericaNorth MacedoniaNorthern AfricaNorthern EuropeNorwayOceaniaPakistanPanamaPeruPhilippinesPolandPortugalRomaniaRussiaSaudi ArabiaScotlandSenegalSerbiaSierra LeoneSingaporeSomaliaSouth AfricaSouth AmericaSouth Central AsiaSouth Eastern AsiaSouthern EuropeSpainSri LankaSt. Vincent and the GrenadinesSudanSwedenSwitzerlandSyriaTaiwanThailandTrinidad and TobagoTurkeyUgandaUkraineUruguayUzbekistanVenezuelaVietnamWest IndiesWestern AfricaWestern AsiaWestern EuropeYemenZaireZimbabweAzores
Married-Couple Family Poverty
Income
Poverty
Unemployment
Labor Participation
Family Structure
Vehicle Availability
Education Level
Disability

French American Indian Married-Couple Family Poverty
Poor

5.5%
POVERTY | MARRIED-COUPLE FAMILIES
16.1/ 100
METRIC RATING
208th/ 347
METRIC RANK

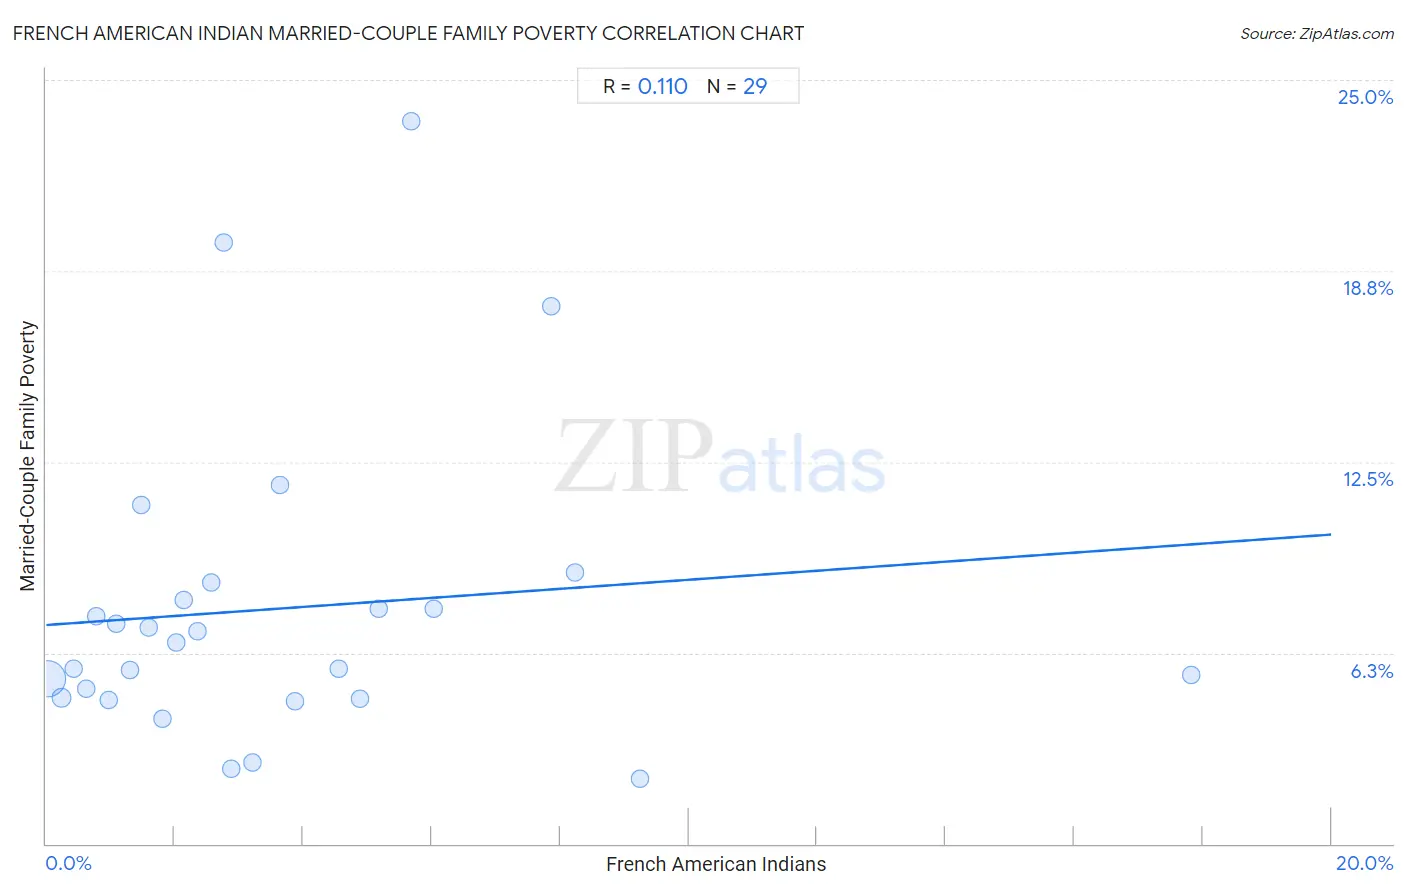
French American Indian Married-Couple Family Poverty Correlation Chart

The statistical analysis conducted on geographies consisting of 131,492,938 people shows a poor positive correlation between the proportion of French American Indians and poverty level among married-couple families in the United States with a correlation coefficient (R) of 0.110 and weighted average of 5.5%. On average, for every 1% (one percent) increase in French American Indians within a typical geography, there is an increase of 0.15% in poverty level among married-couple families.
French American Indian Married-Couple Family Poverty
It is essential to understand that the correlation between the percentage of French American Indians and poverty level among married-couple families does not imply a direct cause-and-effect relationship. It remains uncertain whether the presence of French American Indians influences an upward or downward trend in the level of poverty level among married-couple families within an area, or if French American Indians simply ended up residing in those areas with higher or lower levels of poverty level among married-couple families due to other factors.

Demographics Similar to French American Indians by Married-Couple Family Poverty

In terms of married-couple family poverty, the demographic groups most similar to French American Indians are Immigrants from Syria (5.5%, a difference of 0.14%), Immigrants from Africa (5.5%, a difference of 0.32%), Immigrants from Micronesia (5.5%, a difference of 0.35%), Nigerian (5.5%, a difference of 0.37%), and Immigrants from Thailand (5.5%, a difference of 0.44%).
DemographicsRating | RankMarried-Couple Family Poverty
Lebanese
24.1
/100
|
#201
Fair
5.4%
Immigrants from Middle Africa
23.8
/100
|
#202
Fair
5.4%
Immigrants from Peru
21.8
/100
|
#203
Fair
5.4%
Immigrants from Costa Rica
19.4
/100
|
#204
Poor
5.4%
Chippewa
18.9
/100
|
#205
Poor
5.4%
Osage
18.4
/100
|
#206
Poor
5.4%
Immigrants from Africa
17.6
/100
|
#207
Poor
5.5%
French American Indians
16.1
/100
|
#208
Poor
5.5%
Immigrants from Syria
15.4
/100
|
#209
Poor
5.5%
Immigrants from Micronesia
14.4
/100
|
#210
Poor
5.5%
Nigerians
14.3
/100
|
#211
Poor
5.5%
Immigrants from Thailand
14.0
/100
|
#212
Poor
5.5%
Immigrants from Liberia
13.3
/100
|
#213
Poor
5.5%
Iroquois
13.1
/100
|
#214
Poor
5.5%
Armenians
12.8
/100
|
#215
Poor
5.5%

French American Indian Married-Couple Family Poverty Correlation Summary

MeasurementFrench American Indian DataMarried-Couple Family Poverty Data
Minimum0.024%2.1%
Maximum17.8%23.6%
Range17.8%21.5%
Mean3.6%7.7%
Median2.6%6.6%
Interquartile 25% (IQ1)1.2%4.8%
Interquartile 75% (IQ3)5.0%8.3%
Interquartile Range (IQR)3.8%3.5%
Standard Deviation (Sample)3.7%5.0%
Standard Deviation (Population)3.6%4.9%

Correlation Details

French American Indian PercentileSample SizeMarried-Couple Family Poverty
[
0.0%
-
0.5%
]
0.024%
124,773,3165.4%
[
0.0%
-
0.5%
]
0.24%
4,727,7664.8%
[
0.0%
-
0.5%
]
0.43%
1,143,4305.7%
[
0.5%
-
1.0%
]
0.63%
347,1105.1%
[
0.5%
-
1.0%
]
0.78%
140,8517.5%
[
0.5%
-
1.0%
]
0.96%
72,9904.7%
[
1.0%
-
1.5%
]
1.09%
137,7787.2%
[
1.0%
-
1.5%
]
1.30%
42,2785.7%
[
1.0%
-
1.5%
]
1.48%
20,67511.1%
[
1.5%
-
2.0%
]
1.60%
12,6407.1%
[
1.5%
-
2.0%
]
1.81%
22,1044.1%
[
2.0%
-
2.5%
]
2.02%
2,9236.6%
[
2.0%
-
2.5%
]
2.14%
10,5918.0%
[
2.0%
-
2.5%
]
2.35%
11,9407.0%
[
2.5%
-
3.0%
]
2.56%
4,4508.5%
[
2.5%
-
3.0%
]
2.76%
43519.7%
[
2.5%
-
3.0%
]
2.89%
6,0622.5%
[
3.0%
-
3.5%
]
3.22%
2,3312.7%
[
3.5%
-
4.0%
]
3.63%
1,68111.8%
[
3.5%
-
4.0%
]
3.87%
1,0854.7%
[
4.5%
-
5.0%
]
4.55%
6825.7%
[
4.5%
-
5.0%
]
4.89%
3684.8%
[
5.0%
-
5.5%
]
5.18%
1,2367.7%
[
5.5%
-
6.0%
]
5.68%
38723.6%
[
6.0%
-
6.5%
]
6.04%
3,3467.7%
[
7.5%
-
8.0%
]
7.85%
1,55417.6%
[
8.0%
-
8.5%
]
8.22%
1,5938.9%
[
9.0%
-
9.5%
]
9.23%
7582.1%
[
17.5%
-
18.0%
]
17.82%
5785.5%