European Married-Couple Family Poverty
COMPARE
European
Select to Compare
Married-Couple Family Poverty
European Married-Couple Family Poverty
4.2%
POVERTY | MARRIED-COUPLE FAMILIES
99.9/ 100
METRIC RATING
35th/ 347
METRIC RANK
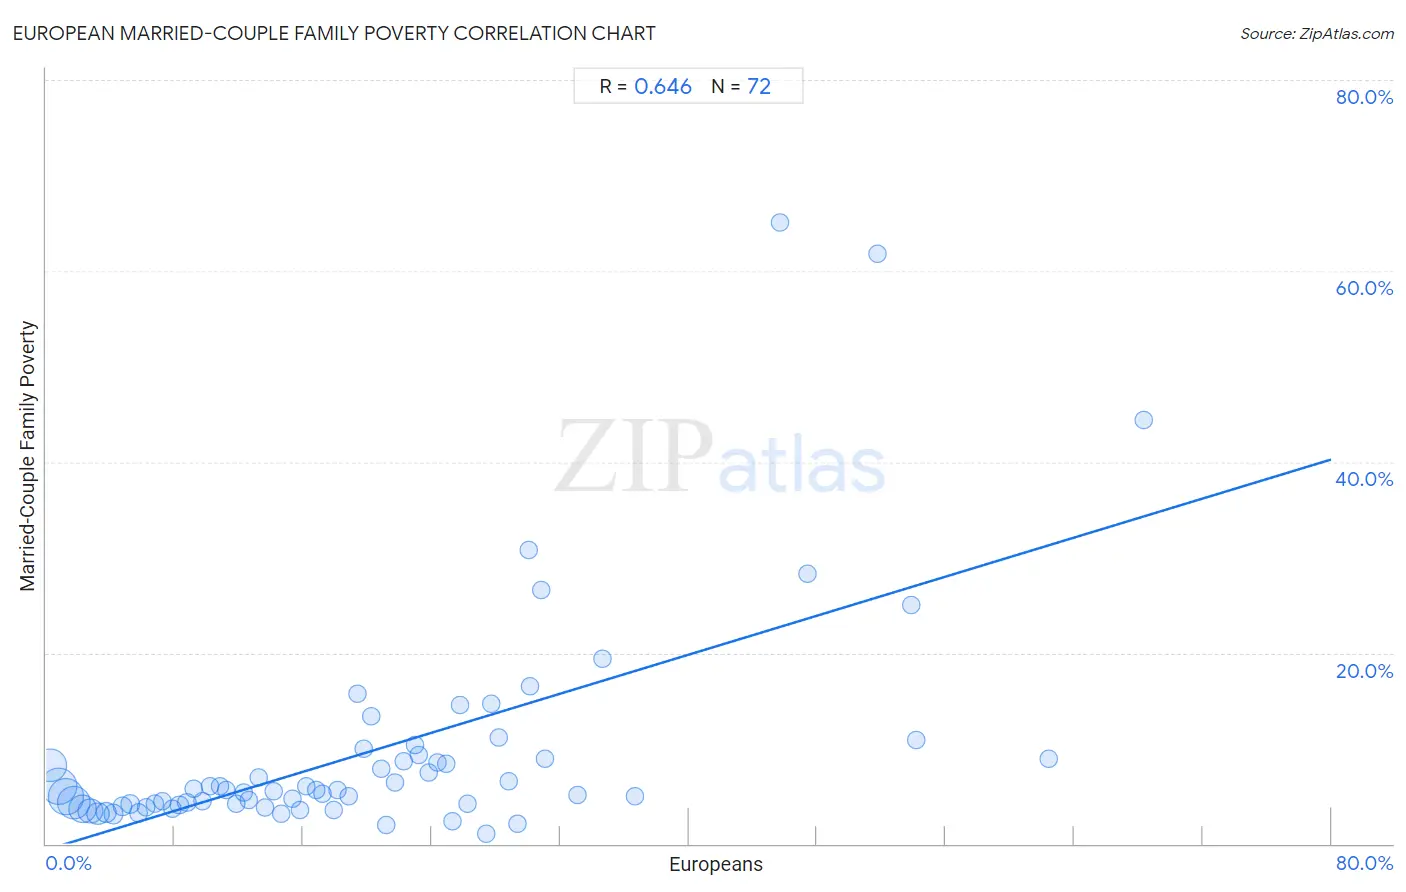
European Married-Couple Family Poverty Correlation Chart
The statistical analysis conducted on geographies consisting of 548,741,154 people shows a significant positive correlation between the proportion of Europeans and poverty level among married-couple families in the United States with a correlation coefficient (R) of 0.646 and weighted average of 4.2%. On average, for every 1% (one percent) increase in Europeans within a typical geography, there is an increase of 0.51% in poverty level among married-couple families.
It is essential to understand that the correlation between the percentage of Europeans and poverty level among married-couple families does not imply a direct cause-and-effect relationship. It remains uncertain whether the presence of Europeans influences an upward or downward trend in the level of poverty level among married-couple families within an area, or if Europeans simply ended up residing in those areas with higher or lower levels of poverty level among married-couple families due to other factors.
Demographics Similar to Europeans by Married-Couple Family Poverty
In terms of married-couple family poverty, the demographic groups most similar to Europeans are English (4.2%, a difference of 0.030%), Iranian (4.2%, a difference of 0.10%), Belgian (4.2%, a difference of 0.22%), Immigrants from Northern Europe (4.2%, a difference of 0.35%), and Dutch (4.2%, a difference of 0.57%).
| Demographics | Rating | Rank | Married-Couple Family Poverty |
| Scandinavians | 99.9 /100 | #28 | Exceptional 4.1% |
| Immigrants from Scotland | 99.9 /100 | #29 | Exceptional 4.2% |
| Finns | 99.9 /100 | #30 | Exceptional 4.2% |
| Estonians | 99.9 /100 | #31 | Exceptional 4.2% |
| Greeks | 99.9 /100 | #32 | Exceptional 4.2% |
| Irish | 99.9 /100 | #33 | Exceptional 4.2% |
| Dutch | 99.9 /100 | #34 | Exceptional 4.2% |
| Europeans | 99.9 /100 | #35 | Exceptional 4.2% |
| English | 99.9 /100 | #36 | Exceptional 4.2% |
| Iranians | 99.9 /100 | #37 | Exceptional 4.2% |
| Belgians | 99.9 /100 | #38 | Exceptional 4.2% |
| Immigrants from Northern Europe | 99.8 /100 | #39 | Exceptional 4.2% |
| French Canadians | 99.8 /100 | #40 | Exceptional 4.2% |
| Northern Europeans | 99.8 /100 | #41 | Exceptional 4.3% |
| Scottish | 99.8 /100 | #42 | Exceptional 4.3% |
European Married-Couple Family Poverty Correlation Summary
| Measurement | European Data | Married-Couple Family Poverty Data |
| Minimum | 0.27% | 1.0% |
| Maximum | 68.3% | 65.0% |
| Range | 68.1% | 64.0% |
| Mean | 20.2% | 9.7% |
| Median | 18.0% | 5.6% |
| Interquartile 25% (IQ1) | 9.0% | 4.1% |
| Interquartile 75% (IQ3) | 27.6% | 9.1% |
| Interquartile Range (IQR) | 18.6% | 5.0% |
| Standard Deviation (Sample) | 14.9% | 11.8% |
| Standard Deviation (Population) | 14.8% | 11.7% |
Correlation Details
| European Percentile | Sample Size | Married-Couple Family Poverty |
[ 0.0% - 0.5% ] 0.27% | 83,176,451 | 8.2% |
[ 0.5% - 1.0% ] 0.77% | 108,326,148 | 6.1% |
[ 1.0% - 1.5% ] 1.25% | 104,363,993 | 4.9% |
[ 1.5% - 2.0% ] 1.73% | 85,611,349 | 4.3% |
[ 2.0% - 2.5% ] 2.23% | 57,527,182 | 3.7% |
[ 2.5% - 3.0% ] 2.73% | 38,862,498 | 3.4% |
[ 3.0% - 3.5% ] 3.22% | 22,899,701 | 3.1% |
[ 3.5% - 4.0% ] 3.74% | 15,105,588 | 3.2% |
[ 4.0% - 4.5% ] 4.20% | 11,079,607 | 3.1% |
[ 4.5% - 5.0% ] 4.73% | 6,516,166 | 3.9% |
[ 5.0% - 5.5% ] 5.23% | 4,773,074 | 4.2% |
[ 5.5% - 6.0% ] 5.75% | 2,342,813 | 3.2% |
[ 6.0% - 6.5% ] 6.24% | 1,861,141 | 3.8% |
[ 6.5% - 7.0% ] 6.74% | 1,632,580 | 4.2% |
[ 7.0% - 7.5% ] 7.26% | 756,617 | 4.5% |
[ 7.5% - 8.0% ] 7.83% | 774,023 | 3.7% |
[ 8.0% - 8.5% ] 8.29% | 524,945 | 4.1% |
[ 8.5% - 9.0% ] 8.75% | 373,737 | 4.3% |
[ 9.0% - 9.5% ] 9.20% | 364,576 | 5.8% |
[ 9.5% - 10.0% ] 9.72% | 467,091 | 4.4% |
[ 10.0% - 10.5% ] 10.19% | 216,238 | 6.0% |
[ 10.5% - 11.0% ] 10.79% | 119,173 | 6.0% |
[ 11.0% - 11.5% ] 11.22% | 114,766 | 5.7% |
[ 11.5% - 12.0% ] 11.81% | 102,751 | 4.2% |
[ 12.0% - 12.5% ] 12.28% | 96,684 | 5.3% |
[ 12.5% - 13.0% ] 12.63% | 130,209 | 4.6% |
[ 13.0% - 13.5% ] 13.26% | 40,833 | 6.9% |
[ 13.5% - 14.0% ] 13.61% | 134,740 | 3.8% |
[ 14.0% - 14.5% ] 14.18% | 27,622 | 5.5% |
[ 14.5% - 15.0% ] 14.65% | 86,430 | 3.1% |
[ 15.0% - 15.5% ] 15.31% | 36,467 | 4.7% |
[ 15.5% - 16.0% ] 15.82% | 70,918 | 3.6% |
[ 16.0% - 16.5% ] 16.19% | 5,712 | 6.0% |
[ 16.5% - 17.0% ] 16.84% | 39,124 | 5.6% |
[ 17.0% - 17.5% ] 17.23% | 33,501 | 5.2% |
[ 17.5% - 18.0% ] 17.88% | 33,659 | 3.5% |
[ 18.0% - 18.5% ] 18.11% | 20,971 | 5.7% |
[ 18.5% - 19.0% ] 18.82% | 11,463 | 5.0% |
[ 19.0% - 19.5% ] 19.41% | 11,897 | 15.7% |
[ 19.5% - 20.0% ] 19.80% | 5,277 | 10.0% |
[ 20.0% - 20.5% ] 20.27% | 1,870 | 13.4% |
[ 20.5% - 21.0% ] 20.83% | 3,965 | 7.8% |
[ 21.0% - 21.5% ] 21.19% | 13,278 | 2.0% |
[ 21.5% - 22.0% ] 21.73% | 10,877 | 6.4% |
[ 22.0% - 22.5% ] 22.27% | 2,097 | 8.6% |
[ 22.5% - 23.0% ] 22.93% | 663 | 10.3% |
[ 23.0% - 23.5% ] 23.21% | 1,379 | 9.3% |
[ 23.5% - 24.0% ] 23.85% | 1,778 | 7.4% |
[ 24.0% - 24.5% ] 24.34% | 3,012 | 8.5% |
[ 24.5% - 25.0% ] 24.91% | 867 | 8.4% |
[ 25.0% - 25.5% ] 25.27% | 4,345 | 2.4% |
[ 25.5% - 26.0% ] 25.74% | 4,172 | 14.5% |
[ 26.0% - 26.5% ] 26.22% | 347 | 4.2% |
[ 27.0% - 27.5% ] 27.43% | 689 | 1.0% |
[ 27.5% - 28.0% ] 27.70% | 870 | 14.7% |
[ 28.0% - 28.5% ] 28.14% | 2,864 | 11.1% |
[ 28.5% - 29.0% ] 28.78% | 1,143 | 6.6% |
[ 29.0% - 29.5% ] 29.31% | 447 | 2.1% |
[ 30.0% - 30.5% ] 30.00% | 140 | 30.8% |
[ 30.0% - 30.5% ] 30.14% | 511 | 16.5% |
[ 30.5% - 31.0% ] 30.84% | 2,072 | 26.6% |
[ 31.0% - 31.5% ] 31.02% | 777 | 8.9% |
[ 33.0% - 33.5% ] 33.05% | 118 | 5.1% |
[ 34.5% - 35.0% ] 34.65% | 3,469 | 19.3% |
[ 36.5% - 37.0% ] 36.62% | 71 | 5.0% |
[ 45.5% - 46.0% ] 45.66% | 611 | 65.0% |
[ 47.0% - 47.5% ] 47.42% | 310 | 28.3% |
[ 51.5% - 52.0% ] 51.72% | 203 | 61.8% |
[ 53.5% - 54.0% ] 53.85% | 13 | 25.0% |
[ 54.0% - 54.5% ] 54.19% | 179 | 10.8% |
[ 62.0% - 62.5% ] 62.41% | 141 | 8.9% |
[ 68.0% - 68.5% ] 68.32% | 161 | 44.4% |