Kenyan 4 or more Vehicles in Household

COMPARE

Kenyan
Race
Ancestry
AfghanAfricanAlaska NativeAlaskan AthabascanAlbanianAleutAlsatianAmericanApacheArabArapahoArgentineanArmenianAssyrian/Chaldean/SyriacAustralianAustrianBahamianBangladeshiBarbadianBasqueBelgianBelizeanBermudanBhutaneseBlackfeetBolivianBrazilianBritishBritish West IndianBulgarianBurmeseCajunCambodianCanadianCape VerdeanCarpatho RusynCelticCentral AmericanCentral American IndianCherokeeCheyenneChickasawChileanChineseChippewaChoctawColombianColvilleComancheCosta RicanCreeCreekCroatianCrowCubanCypriotCzechCzechoslovakianDanishDelawareDominicanDutchDutch West IndianEastern EuropeanEcuadorianEgyptianEnglishEstonianEthiopianEuropeanFijianFilipinoFinnishFrenchFrench American IndianFrench CanadianGermanGerman RussianGhanaianGreekGuamanian/ChamorroGuatemalanGuyaneseHaitianHmongHonduranHopiHoumaHungarianIcelanderIndian (Asian)IndonesianInupiatIranianIraqiIrishIroquoisIsraeliItalianJamaicanJapaneseJordanianKenyanKiowaKoreanLaotianLatvianLebaneseLiberianLithuanianLumbeeLuxembourgerMacedonianMalaysianMalteseMarshalleseMenomineeMexicanMexican American IndianMongolianMoroccanNative HawaiianNavajoNepaleseNew ZealanderNicaraguanNigerianNorthern EuropeanNorwegianOkinawanOsageOttawaPaiutePakistaniPalestinianPanamanianParaguayanPennsylvania GermanPeruvianPimaPolishPortuguesePotawatomiPuebloPuerto RicanPuget Sound SalishRomanianRussianSalvadoranSamoanScandinavianScotch-IrishScottishSeminoleSenegaleseSerbianShoshoneSierra LeoneanSiouxSlavicSlovakSloveneSomaliSouth AfricanSouth AmericanSouth American IndianSoviet UnionSpaniardSpanishSpanish AmericanSpanish American IndianSri LankanSubsaharan AfricanSudaneseSwedishSwissSyrianTaiwaneseThaiTlingit-HaidaTohono O'OdhamTonganTrinidadian and TobagonianTsimshianTurkishU.S. Virgin IslanderUgandanUkrainianUruguayanUteVenezuelanVietnameseWelshWest IndianYakamaYaquiYugoslavianYumanYup'ikZimbabwean
Immigration
NonimmigrantsImmigrantsAfghanistanAfricaAlbaniaArgentinaArmeniaAsiaAustraliaAustriaBahamasBangladeshBarbadosBelarusBelgiumBelizeBoliviaBosnia and HerzegovinaBrazilBulgariaBurma/MyanmarCabo VerdeCambodiaCameroonCanadaCaribbeanCentral AmericaChileChinaColombiaCongoCosta RicaCroatiaCubaCzechoslovakiaDenmarkDominicaDominican RepublicEastern AfricaEastern AsiaEastern EuropeEcuadorEgyptEl SalvadorEnglandEritreaEthiopiaEuropeFijiFranceGermanyGhanaGreeceGrenadaGuatemalaGuyanaHaitiHondurasHong KongHungaryIndiaIndonesiaIranIraqIrelandIsraelItalyJamaicaJapanJordanKazakhstanKenyaKoreaKuwaitLaosLatin AmericaLatviaLebanonLiberiaLithuaniaMalaysiaMexicoMicronesiaMiddle AfricaMoldovaMoroccoNepalNetherlandsNicaraguaNigeriaNorth AmericaNorth MacedoniaNorthern AfricaNorthern EuropeNorwayOceaniaPakistanPanamaPeruPhilippinesPolandPortugalRomaniaRussiaSaudi ArabiaScotlandSenegalSerbiaSierra LeoneSingaporeSomaliaSouth AfricaSouth AmericaSouth Central AsiaSouth Eastern AsiaSouthern EuropeSpainSri LankaSt. Vincent and the GrenadinesSudanSwedenSwitzerlandSyriaTaiwanThailandTrinidad and TobagoTurkeyUgandaUkraineUruguayUzbekistanVenezuelaVietnamWest IndiesWestern AfricaWestern AsiaWestern EuropeYemenZaireZimbabweAzores
Select to Compare
Race
Ancestry
AfghanAfricanAlaska NativeAlaskan AthabascanAlbanianAleutAlsatianAmericanApacheArabArapahoArgentineanArmenianAssyrian/Chaldean/SyriacAustralianAustrianBahamianBangladeshiBarbadianBasqueBelgianBelizeanBermudanBhutaneseBlackfeetBolivianBrazilianBritishBritish West IndianBulgarianBurmeseCajunCambodianCanadianCape VerdeanCarpatho RusynCelticCentral AmericanCentral American IndianCherokeeCheyenneChickasawChileanChineseChippewaChoctawColombianColvilleComancheCosta RicanCreeCreekCroatianCrowCubanCypriotCzechCzechoslovakianDanishDelawareDominicanDutchDutch West IndianEastern EuropeanEcuadorianEgyptianEnglishEstonianEthiopianEuropeanFijianFilipinoFinnishFrenchFrench American IndianFrench CanadianGermanGerman RussianGhanaianGreekGuamanian/ChamorroGuatemalanGuyaneseHaitianHmongHonduranHopiHoumaHungarianIcelanderIndian (Asian)IndonesianInupiatIranianIraqiIrishIroquoisIsraeliItalianJamaicanJapaneseJordanianKiowaKoreanLaotianLatvianLebaneseLiberianLithuanianLumbeeLuxembourgerMacedonianMalaysianMalteseMarshalleseMenomineeMexicanMexican American IndianMongolianMoroccanNative HawaiianNavajoNepaleseNew ZealanderNicaraguanNigerianNorthern EuropeanNorwegianOkinawanOsageOttawaPaiutePakistaniPalestinianPanamanianParaguayanPennsylvania GermanPeruvianPimaPolishPortuguesePotawatomiPuebloPuerto RicanPuget Sound SalishRomanianRussianSalvadoranSamoanScandinavianScotch-IrishScottishSeminoleSenegaleseSerbianShoshoneSierra LeoneanSiouxSlavicSlovakSloveneSomaliSouth AfricanSouth AmericanSouth American IndianSoviet UnionSpaniardSpanishSpanish AmericanSpanish American IndianSri LankanSubsaharan AfricanSudaneseSwedishSwissSyrianTaiwaneseThaiTlingit-HaidaTohono O'OdhamTonganTrinidadian and TobagonianTsimshianTurkishU.S. Virgin IslanderUgandanUkrainianUruguayanUteVenezuelanVietnameseWelshWest IndianYakamaYaquiYugoslavianYumanYup'ikZimbabwean
Immigration
NonimmigrantsImmigrantsAfghanistanAfricaAlbaniaArgentinaArmeniaAsiaAustraliaAustriaBahamasBangladeshBarbadosBelarusBelgiumBelizeBoliviaBosnia and HerzegovinaBrazilBulgariaBurma/MyanmarCabo VerdeCambodiaCameroonCanadaCaribbeanCentral AmericaChileChinaColombiaCongoCosta RicaCroatiaCubaCzechoslovakiaDenmarkDominicaDominican RepublicEastern AfricaEastern AsiaEastern EuropeEcuadorEgyptEl SalvadorEnglandEritreaEthiopiaEuropeFijiFranceGermanyGhanaGreeceGrenadaGuatemalaGuyanaHaitiHondurasHong KongHungaryIndiaIndonesiaIranIraqIrelandIsraelItalyJamaicaJapanJordanKazakhstanKenyaKoreaKuwaitLaosLatin AmericaLatviaLebanonLiberiaLithuaniaMalaysiaMexicoMicronesiaMiddle AfricaMoldovaMoroccoNepalNetherlandsNicaraguaNigeriaNorth AmericaNorth MacedoniaNorthern AfricaNorthern EuropeNorwayOceaniaPakistanPanamaPeruPhilippinesPolandPortugalRomaniaRussiaSaudi ArabiaScotlandSenegalSerbiaSierra LeoneSingaporeSomaliaSouth AfricaSouth AmericaSouth Central AsiaSouth Eastern AsiaSouthern EuropeSpainSri LankaSt. Vincent and the GrenadinesSudanSwedenSwitzerlandSyriaTaiwanThailandTrinidad and TobagoTurkeyUgandaUkraineUruguayUzbekistanVenezuelaVietnamWest IndiesWestern AfricaWestern AsiaWestern EuropeYemenZaireZimbabweAzores
4 or more Vehicles in Household
Income
Poverty
Unemployment
Labor Participation
Family Structure
Vehicle Availability
Education Level
Disability

Kenyan 4 or more Vehicles in Household
Poor

6.1%
4+ VEHICLES AVAILABLE
18.5/ 100
METRIC RATING
206th/ 347
METRIC RANK

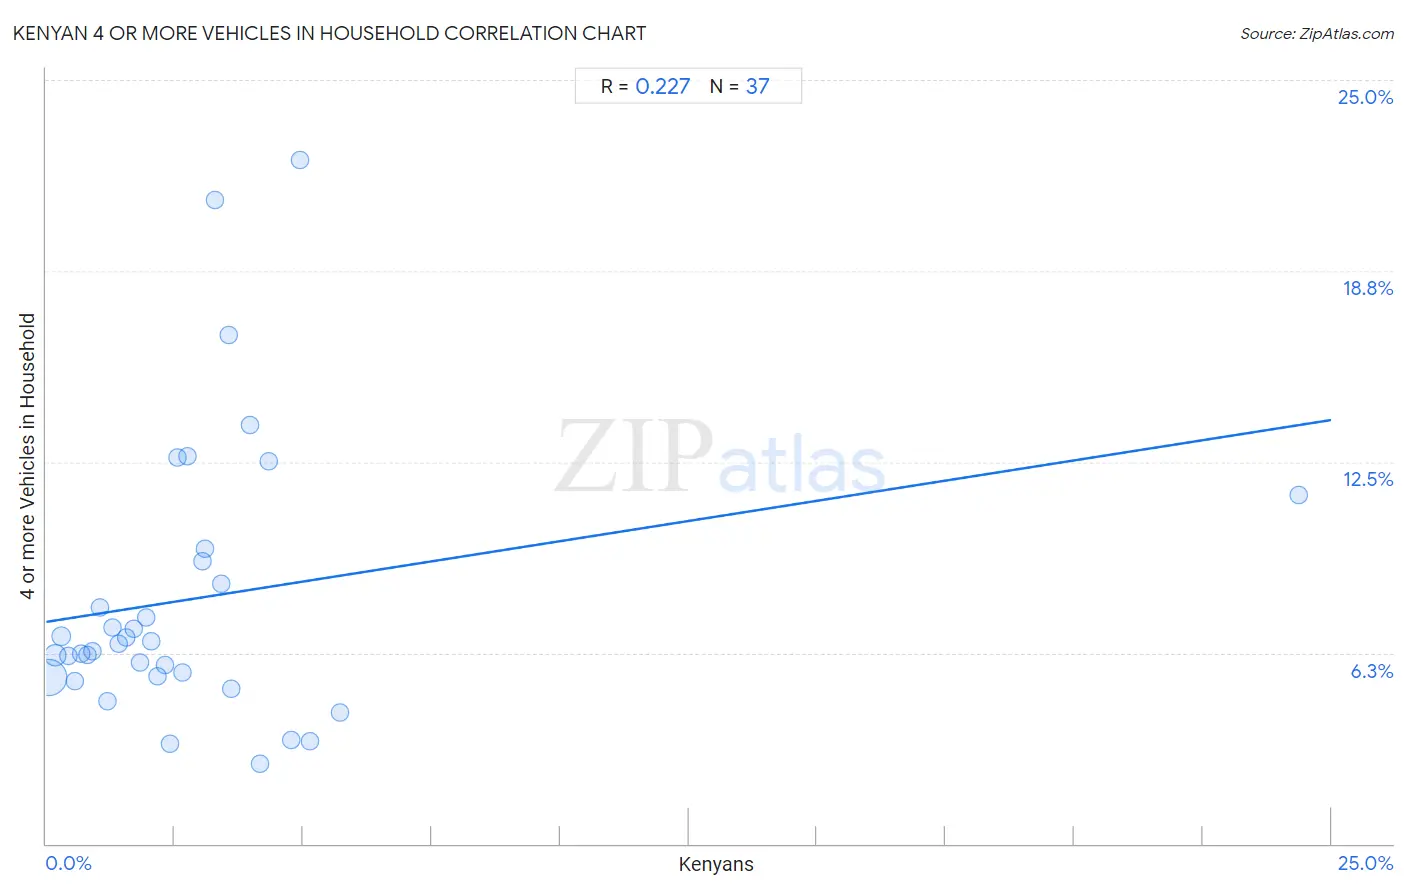
Kenyan 4 or more Vehicles in Household Correlation Chart

The statistical analysis conducted on geographies consisting of 167,746,674 people shows a weak positive correlation between the proportion of Kenyans and percentage of households with 4 or more vehicles available in the United States with a correlation coefficient (R) of 0.227 and weighted average of 6.1%. On average, for every 1% (one percent) increase in Kenyans within a typical geography, there is an increase of 0.26% in percentage of households with 4 or more vehicles available.
Kenyan 4 or more Vehicles in Household
It is essential to understand that the correlation between the percentage of Kenyans and percentage of households with 4 or more vehicles available does not imply a direct cause-and-effect relationship. It remains uncertain whether the presence of Kenyans influences an upward or downward trend in the level of percentage of households with 4 or more vehicles available within an area, or if Kenyans simply ended up residing in those areas with higher or lower levels of percentage of households with 4 or more vehicles available due to other factors.

Demographics Similar to Kenyans by 4 or more Vehicles in Household

In terms of 4 or more vehicles in household, the demographic groups most similar to Kenyans are Honduran (6.1%, a difference of 0.14%), Immigrants from Belize (6.1%, a difference of 0.23%), Immigrants from Chile (6.1%, a difference of 0.28%), Immigrants from Sierra Leone (6.1%, a difference of 0.33%), and Immigrants from South Central Asia (6.1%, a difference of 0.47%).
DemographicsRating | Rank4 or more Vehicles in Household
Immigrants from Norway
21.8
/100
|
#199
Fair
6.1%
Latvians
21.7
/100
|
#200
Fair
6.1%
Egyptians
21.4
/100
|
#201
Fair
6.1%
Immigrants from South Central Asia
21.3
/100
|
#202
Fair
6.1%
Immigrants from Sierra Leone
20.5
/100
|
#203
Fair
6.1%
Immigrants from Belize
19.8
/100
|
#204
Poor
6.1%
Hondurans
19.3
/100
|
#205
Poor
6.1%
Kenyans
18.5
/100
|
#206
Poor
6.1%
Immigrants from Chile
16.9
/100
|
#207
Poor
6.1%
Immigrants from Nigeria
15.6
/100
|
#208
Poor
6.1%
Immigrants from Honduras
15.4
/100
|
#209
Poor
6.1%
Immigrants from Zimbabwe
15.1
/100
|
#210
Poor
6.0%
Panamanians
14.8
/100
|
#211
Poor
6.0%
Immigrants from Egypt
14.7
/100
|
#212
Poor
6.0%
Arabs
14.4
/100
|
#213
Poor
6.0%

Kenyan 4 or more Vehicles in Household Correlation Summary

MeasurementKenyan Data4 or more Vehicles in Household Data
Minimum0.039%2.6%
Maximum24.4%22.4%
Range24.3%19.8%
Mean3.0%8.1%
Median2.3%6.5%
Interquartile 25% (IQ1)1.1%5.5%
Interquartile 75% (IQ3)3.6%9.5%
Interquartile Range (IQR)2.5%4.0%
Standard Deviation (Sample)3.9%4.6%
Standard Deviation (Population)3.9%4.5%

Correlation Details

Kenyan PercentileSample Size4 or more Vehicles in Household
[
0.0%
-
0.5%
]
0.039%
126,311,6265.4%
[
0.0%
-
0.5%
]
0.17%
21,755,2706.2%
[
0.0%
-
0.5%
]
0.30%
8,305,0426.8%
[
0.0%
-
0.5%
]
0.43%
4,706,5286.1%
[
0.5%
-
1.0%
]
0.55%
2,122,8205.3%
[
0.5%
-
1.0%
]
0.67%
1,164,3326.2%
[
0.5%
-
1.0%
]
0.80%
964,8076.2%
[
0.5%
-
1.0%
]
0.90%
443,9196.3%
[
1.0%
-
1.5%
]
1.05%
433,1617.7%
[
1.0%
-
1.5%
]
1.19%
327,7404.7%
[
1.0%
-
1.5%
]
1.30%
231,5947.1%
[
1.0%
-
1.5%
]
1.41%
210,3336.5%
[
1.5%
-
2.0%
]
1.56%
192,2526.8%
[
1.5%
-
2.0%
]
1.69%
100,8387.0%
[
1.5%
-
2.0%
]
1.82%
29,8295.9%
[
1.5%
-
2.0%
]
1.95%
131,0697.4%
[
2.0%
-
2.5%
]
2.05%
69,6126.6%
[
2.0%
-
2.5%
]
2.17%
85,0595.5%
[
2.0%
-
2.5%
]
2.31%
51,6395.8%
[
2.0%
-
2.5%
]
2.40%
2,2893.3%
[
2.5%
-
3.0%
]
2.56%
58612.6%
[
2.5%
-
3.0%
]
2.65%
32,1865.6%
[
2.5%
-
3.0%
]
2.75%
8,23012.7%
[
3.0%
-
3.5%
]
3.03%
14,1279.2%
[
3.0%
-
3.5%
]
3.10%
8,3899.7%
[
3.0%
-
3.5%
]
3.29%
2,03421.1%
[
3.0%
-
3.5%
]
3.40%
2,7648.5%
[
3.5%
-
4.0%
]
3.56%
2,47316.7%
[
3.5%
-
4.0%
]
3.59%
3,7855.1%
[
3.5%
-
4.0%
]
3.96%
22713.7%
[
4.0%
-
4.5%
]
4.15%
9,8222.6%
[
4.0%
-
4.5%
]
4.32%
2,47412.5%
[
4.5%
-
5.0%
]
4.77%
9,3323.4%
[
4.5%
-
5.0%
]
4.94%
32422.4%
[
5.0%
-
5.5%
]
5.13%
4,9953.3%
[
5.5%
-
6.0%
]
5.71%
4,7284.3%
[
24.0%
-
24.5%
]
24.37%
43911.4%