Yugoslavian Married-Couple Family Poverty
COMPARE
Yugoslavian
Select to Compare
Married-Couple Family Poverty
Yugoslavian Married-Couple Family Poverty
4.6%
POVERTY | MARRIED-COUPLE FAMILIES
97.8/ 100
METRIC RATING
101st/ 347
METRIC RANK
Yugoslavian Married-Couple Family Poverty Correlation Chart
The statistical analysis conducted on geographies consisting of 284,040,939 people shows a slight positive correlation between the proportion of Yugoslavians and poverty level among married-couple families in the United States with a correlation coefficient (R) of 0.061 and weighted average of 4.6%. On average, for every 1% (one percent) increase in Yugoslavians within a typical geography, there is an increase of 0.045% in poverty level among married-couple families.
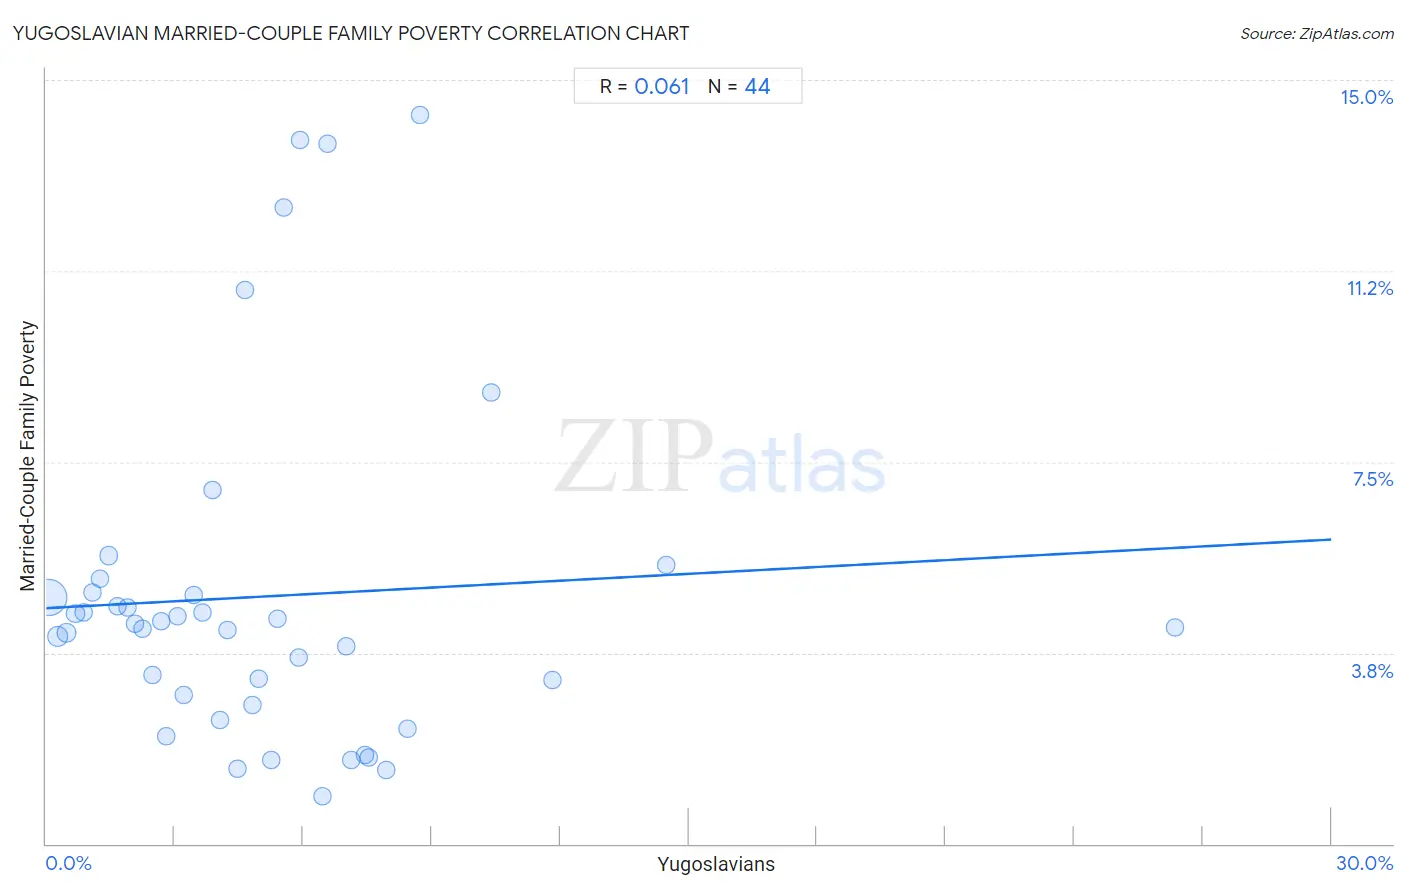
It is essential to understand that the correlation between the percentage of Yugoslavians and poverty level among married-couple families does not imply a direct cause-and-effect relationship. It remains uncertain whether the presence of Yugoslavians influences an upward or downward trend in the level of poverty level among married-couple families within an area, or if Yugoslavians simply ended up residing in those areas with higher or lower levels of poverty level among married-couple families due to other factors.
Demographics Similar to Yugoslavians by Married-Couple Family Poverty
In terms of married-couple family poverty, the demographic groups most similar to Yugoslavians are Immigrants from Western Europe (4.6%, a difference of 0.020%), Immigrants from Europe (4.6%, a difference of 0.13%), Native Hawaiian (4.6%, a difference of 0.24%), Asian (4.7%, a difference of 0.40%), and Immigrants from Belgium (4.6%, a difference of 0.67%).
| Demographics | Rating | Rank | Married-Couple Family Poverty |
| Immigrants from Italy | 98.3 /100 | #94 | Exceptional 4.6% |
| Portuguese | 98.3 /100 | #95 | Exceptional 4.6% |
| Immigrants from Poland | 98.3 /100 | #96 | Exceptional 4.6% |
| Immigrants from Belgium | 98.2 /100 | #97 | Exceptional 4.6% |
| Native Hawaiians | 98.0 /100 | #98 | Exceptional 4.6% |
| Immigrants from Europe | 97.9 /100 | #99 | Exceptional 4.6% |
| Immigrants from Western Europe | 97.9 /100 | #100 | Exceptional 4.6% |
| Yugoslavians | 97.8 /100 | #101 | Exceptional 4.6% |
| Asians | 97.6 /100 | #102 | Exceptional 4.7% |
| Immigrants from Romania | 97.3 /100 | #103 | Exceptional 4.7% |
| Immigrants from Moldova | 97.1 /100 | #104 | Exceptional 4.7% |
| Aleuts | 97.0 /100 | #105 | Exceptional 4.7% |
| Immigrants from France | 96.9 /100 | #106 | Exceptional 4.7% |
| Immigrants from Germany | 96.8 /100 | #107 | Exceptional 4.7% |
| Laotians | 96.6 /100 | #108 | Exceptional 4.7% |
Yugoslavian Married-Couple Family Poverty Correlation Summary
| Measurement | Yugoslavian Data | Married-Couple Family Poverty Data |
| Minimum | 0.060% | 0.92% |
| Maximum | 26.3% | 14.3% |
| Range | 26.3% | 13.4% |
| Mean | 5.1% | 4.9% |
| Median | 4.3% | 4.3% |
| Interquartile 25% (IQ1) | 2.2% | 2.8% |
| Interquartile 75% (IQ3) | 6.8% | 4.9% |
| Interquartile Range (IQR) | 4.6% | 2.1% |
| Standard Deviation (Sample) | 4.6% | 3.4% |
| Standard Deviation (Population) | 4.5% | 3.3% |
Correlation Details
| Yugoslavian Percentile | Sample Size | Married-Couple Family Poverty |
[ 0.0% - 0.5% ] 0.060% | 238,369,875 | 4.8% |
[ 0.0% - 0.5% ] 0.28% | 27,490,688 | 4.1% |
[ 0.0% - 0.5% ] 0.48% | 8,465,194 | 4.1% |
[ 0.5% - 1.0% ] 0.68% | 3,430,432 | 4.5% |
[ 0.5% - 1.0% ] 0.87% | 2,120,496 | 4.5% |
[ 1.0% - 1.5% ] 1.08% | 1,033,997 | 4.9% |
[ 1.0% - 1.5% ] 1.26% | 703,078 | 5.2% |
[ 1.0% - 1.5% ] 1.47% | 385,571 | 5.7% |
[ 1.5% - 2.0% ] 1.65% | 383,014 | 4.7% |
[ 1.5% - 2.0% ] 1.89% | 363,910 | 4.7% |
[ 2.0% - 2.5% ] 2.09% | 255,042 | 4.3% |
[ 2.0% - 2.5% ] 2.24% | 184,796 | 4.2% |
[ 2.0% - 2.5% ] 2.47% | 112,562 | 3.3% |
[ 2.5% - 3.0% ] 2.68% | 154,112 | 4.4% |
[ 2.5% - 3.0% ] 2.79% | 43,981 | 2.1% |
[ 3.0% - 3.5% ] 3.06% | 27,261 | 4.5% |
[ 3.0% - 3.5% ] 3.22% | 46,336 | 2.9% |
[ 3.0% - 3.5% ] 3.45% | 82,248 | 4.9% |
[ 3.5% - 4.0% ] 3.65% | 3,922 | 4.5% |
[ 3.5% - 4.0% ] 3.88% | 7,502 | 6.9% |
[ 4.0% - 4.5% ] 4.05% | 11,563 | 2.4% |
[ 4.0% - 4.5% ] 4.22% | 31,337 | 4.2% |
[ 4.0% - 4.5% ] 4.47% | 5,095 | 1.5% |
[ 4.5% - 5.0% ] 4.64% | 1,100 | 10.9% |
[ 4.5% - 5.0% ] 4.82% | 9,735 | 2.7% |
[ 4.5% - 5.0% ] 4.97% | 71,165 | 3.2% |
[ 5.0% - 5.5% ] 5.26% | 22,286 | 1.6% |
[ 5.0% - 5.5% ] 5.39% | 947 | 4.4% |
[ 5.5% - 6.0% ] 5.56% | 72 | 12.5% |
[ 5.5% - 6.0% ] 5.89% | 950 | 3.7% |
[ 5.5% - 6.0% ] 5.92% | 64,994 | 13.8% |
[ 6.0% - 6.5% ] 6.46% | 19,922 | 0.92% |
[ 6.5% - 7.0% ] 6.58% | 3,665 | 13.7% |
[ 7.0% - 7.5% ] 7.01% | 16,211 | 3.9% |
[ 7.0% - 7.5% ] 7.12% | 4,947 | 1.7% |
[ 7.0% - 7.5% ] 7.45% | 282 | 1.8% |
[ 7.5% - 8.0% ] 7.53% | 332 | 1.7% |
[ 7.5% - 8.0% ] 7.93% | 29,089 | 1.5% |
[ 8.0% - 8.5% ] 8.43% | 36,359 | 2.3% |
[ 8.5% - 9.0% ] 8.74% | 40,152 | 14.3% |
[ 10.0% - 10.5% ] 10.40% | 846 | 8.9% |
[ 11.5% - 12.0% ] 11.83% | 186 | 3.2% |
[ 14.0% - 14.5% ] 14.48% | 3,812 | 5.5% |
[ 26.0% - 26.5% ] 26.35% | 1,875 | 4.2% |