Colville Married-Couple Family Poverty

COMPARE

Colville
Race
Ancestry
AfghanAfricanAlaska NativeAlaskan AthabascanAlbanianAleutAlsatianAmericanApacheArabArapahoArgentineanArmenianAssyrian/Chaldean/SyriacAustralianAustrianBahamianBangladeshiBarbadianBasqueBelgianBelizeanBermudanBhutaneseBlackfeetBolivianBrazilianBritishBritish West IndianBulgarianBurmeseCajunCambodianCanadianCape VerdeanCarpatho RusynCelticCentral AmericanCentral American IndianCherokeeCheyenneChickasawChileanChineseChippewaChoctawColombianColvilleComancheCosta RicanCreeCreekCroatianCrowCubanCypriotCzechCzechoslovakianDanishDelawareDominicanDutchDutch West IndianEastern EuropeanEcuadorianEgyptianEnglishEstonianEthiopianEuropeanFijianFilipinoFinnishFrenchFrench American IndianFrench CanadianGermanGerman RussianGhanaianGreekGuamanian/ChamorroGuatemalanGuyaneseHaitianHmongHonduranHopiHoumaHungarianIcelanderIndian (Asian)IndonesianInupiatIranianIraqiIrishIroquoisIsraeliItalianJamaicanJapaneseJordanianKenyanKiowaKoreanLaotianLatvianLebaneseLiberianLithuanianLumbeeLuxembourgerMacedonianMalaysianMalteseMarshalleseMenomineeMexicanMexican American IndianMongolianMoroccanNative HawaiianNavajoNepaleseNew ZealanderNicaraguanNigerianNorthern EuropeanNorwegianOkinawanOsageOttawaPaiutePakistaniPalestinianPanamanianParaguayanPennsylvania GermanPeruvianPimaPolishPortuguesePotawatomiPuebloPuerto RicanPuget Sound SalishRomanianRussianSalvadoranSamoanScandinavianScotch-IrishScottishSeminoleSenegaleseSerbianShoshoneSierra LeoneanSiouxSlavicSlovakSloveneSomaliSouth AfricanSouth AmericanSouth American IndianSoviet UnionSpaniardSpanishSpanish AmericanSpanish American IndianSri LankanSubsaharan AfricanSudaneseSwedishSwissSyrianTaiwaneseThaiTlingit-HaidaTohono O'OdhamTonganTrinidadian and TobagonianTsimshianTurkishU.S. Virgin IslanderUgandanUkrainianUruguayanUteVenezuelanVietnameseWelshWest IndianYakamaYaquiYugoslavianYumanYup'ikZimbabwean
Immigration
NonimmigrantsImmigrantsAfghanistanAfricaAlbaniaArgentinaArmeniaAsiaAustraliaAustriaBahamasBangladeshBarbadosBelarusBelgiumBelizeBoliviaBosnia and HerzegovinaBrazilBulgariaBurma/MyanmarCabo VerdeCambodiaCameroonCanadaCaribbeanCentral AmericaChileChinaColombiaCongoCosta RicaCroatiaCubaCzechoslovakiaDenmarkDominicaDominican RepublicEastern AfricaEastern AsiaEastern EuropeEcuadorEgyptEl SalvadorEnglandEritreaEthiopiaEuropeFijiFranceGermanyGhanaGreeceGrenadaGuatemalaGuyanaHaitiHondurasHong KongHungaryIndiaIndonesiaIranIraqIrelandIsraelItalyJamaicaJapanJordanKazakhstanKenyaKoreaKuwaitLaosLatin AmericaLatviaLebanonLiberiaLithuaniaMalaysiaMexicoMicronesiaMiddle AfricaMoldovaMoroccoNepalNetherlandsNicaraguaNigeriaNorth AmericaNorth MacedoniaNorthern AfricaNorthern EuropeNorwayOceaniaPakistanPanamaPeruPhilippinesPolandPortugalRomaniaRussiaSaudi ArabiaScotlandSenegalSerbiaSierra LeoneSingaporeSomaliaSouth AfricaSouth AmericaSouth Central AsiaSouth Eastern AsiaSouthern EuropeSpainSri LankaSt. Vincent and the GrenadinesSudanSwedenSwitzerlandSyriaTaiwanThailandTrinidad and TobagoTurkeyUgandaUkraineUruguayUzbekistanVenezuelaVietnamWest IndiesWestern AfricaWestern AsiaWestern EuropeYemenZaireZimbabweAzores
Select to Compare
Race
Ancestry
AfghanAfricanAlaska NativeAlaskan AthabascanAlbanianAleutAlsatianAmericanApacheArabArapahoArgentineanArmenianAssyrian/Chaldean/SyriacAustralianAustrianBahamianBangladeshiBarbadianBasqueBelgianBelizeanBermudanBhutaneseBlackfeetBolivianBrazilianBritishBritish West IndianBulgarianBurmeseCajunCambodianCanadianCape VerdeanCarpatho RusynCelticCentral AmericanCentral American IndianCherokeeCheyenneChickasawChileanChineseChippewaChoctawColombianComancheCosta RicanCreeCreekCroatianCrowCubanCypriotCzechCzechoslovakianDanishDelawareDominicanDutchDutch West IndianEastern EuropeanEcuadorianEgyptianEnglishEstonianEthiopianEuropeanFijianFilipinoFinnishFrenchFrench American IndianFrench CanadianGermanGerman RussianGhanaianGreekGuamanian/ChamorroGuatemalanGuyaneseHaitianHmongHonduranHopiHoumaHungarianIcelanderIndian (Asian)IndonesianInupiatIranianIraqiIrishIroquoisIsraeliItalianJamaicanJapaneseJordanianKenyanKiowaKoreanLaotianLatvianLebaneseLiberianLithuanianLumbeeLuxembourgerMacedonianMalaysianMalteseMarshalleseMenomineeMexicanMexican American IndianMongolianMoroccanNative HawaiianNavajoNepaleseNew ZealanderNicaraguanNigerianNorthern EuropeanNorwegianOkinawanOsageOttawaPaiutePakistaniPalestinianPanamanianParaguayanPennsylvania GermanPeruvianPimaPolishPortuguesePotawatomiPuebloPuerto RicanPuget Sound SalishRomanianRussianSalvadoranSamoanScandinavianScotch-IrishScottishSeminoleSenegaleseSerbianShoshoneSierra LeoneanSiouxSlavicSlovakSloveneSomaliSouth AfricanSouth AmericanSouth American IndianSoviet UnionSpaniardSpanishSpanish AmericanSpanish American IndianSri LankanSubsaharan AfricanSudaneseSwedishSwissSyrianTaiwaneseThaiTlingit-HaidaTohono O'OdhamTonganTrinidadian and TobagonianTsimshianTurkishU.S. Virgin IslanderUgandanUkrainianUruguayanUteVenezuelanVietnameseWelshWest IndianYakamaYaquiYugoslavianYumanYup'ikZimbabwean
Immigration
NonimmigrantsImmigrantsAfghanistanAfricaAlbaniaArgentinaArmeniaAsiaAustraliaAustriaBahamasBangladeshBarbadosBelarusBelgiumBelizeBoliviaBosnia and HerzegovinaBrazilBulgariaBurma/MyanmarCabo VerdeCambodiaCameroonCanadaCaribbeanCentral AmericaChileChinaColombiaCongoCosta RicaCroatiaCubaCzechoslovakiaDenmarkDominicaDominican RepublicEastern AfricaEastern AsiaEastern EuropeEcuadorEgyptEl SalvadorEnglandEritreaEthiopiaEuropeFijiFranceGermanyGhanaGreeceGrenadaGuatemalaGuyanaHaitiHondurasHong KongHungaryIndiaIndonesiaIranIraqIrelandIsraelItalyJamaicaJapanJordanKazakhstanKenyaKoreaKuwaitLaosLatin AmericaLatviaLebanonLiberiaLithuaniaMalaysiaMexicoMicronesiaMiddle AfricaMoldovaMoroccoNepalNetherlandsNicaraguaNigeriaNorth AmericaNorth MacedoniaNorthern AfricaNorthern EuropeNorwayOceaniaPakistanPanamaPeruPhilippinesPolandPortugalRomaniaRussiaSaudi ArabiaScotlandSenegalSerbiaSierra LeoneSingaporeSomaliaSouth AfricaSouth AmericaSouth Central AsiaSouth Eastern AsiaSouthern EuropeSpainSri LankaSt. Vincent and the GrenadinesSudanSwedenSwitzerlandSyriaTaiwanThailandTrinidad and TobagoTurkeyUgandaUkraineUruguayUzbekistanVenezuelaVietnamWest IndiesWestern AfricaWestern AsiaWestern EuropeYemenZaireZimbabweAzores
Married-Couple Family Poverty
Income
Poverty
Unemployment
Labor Participation
Family Structure
Vehicle Availability
Education Level
Disability

Colville Married-Couple Family Poverty
Tragic

6.3%
POVERTY | MARRIED-COUPLE FAMILIES
0.1/ 100
METRIC RATING
273rd/ 347
METRIC RANK

Colville Married-Couple Family Poverty Correlation Chart

The statistical analysis conducted on geographies consisting of 34,633,773 people shows a poor negative correlation between the proportion of Colville and poverty level among married-couple families in the United States with a correlation coefficient (R) of -0.124 and weighted average of 6.3%. On average, for every 1% (one percent) increase in Colville within a typical geography, there is a decrease of 0.050% in poverty level among married-couple families.
Colville Married-Couple Family Poverty
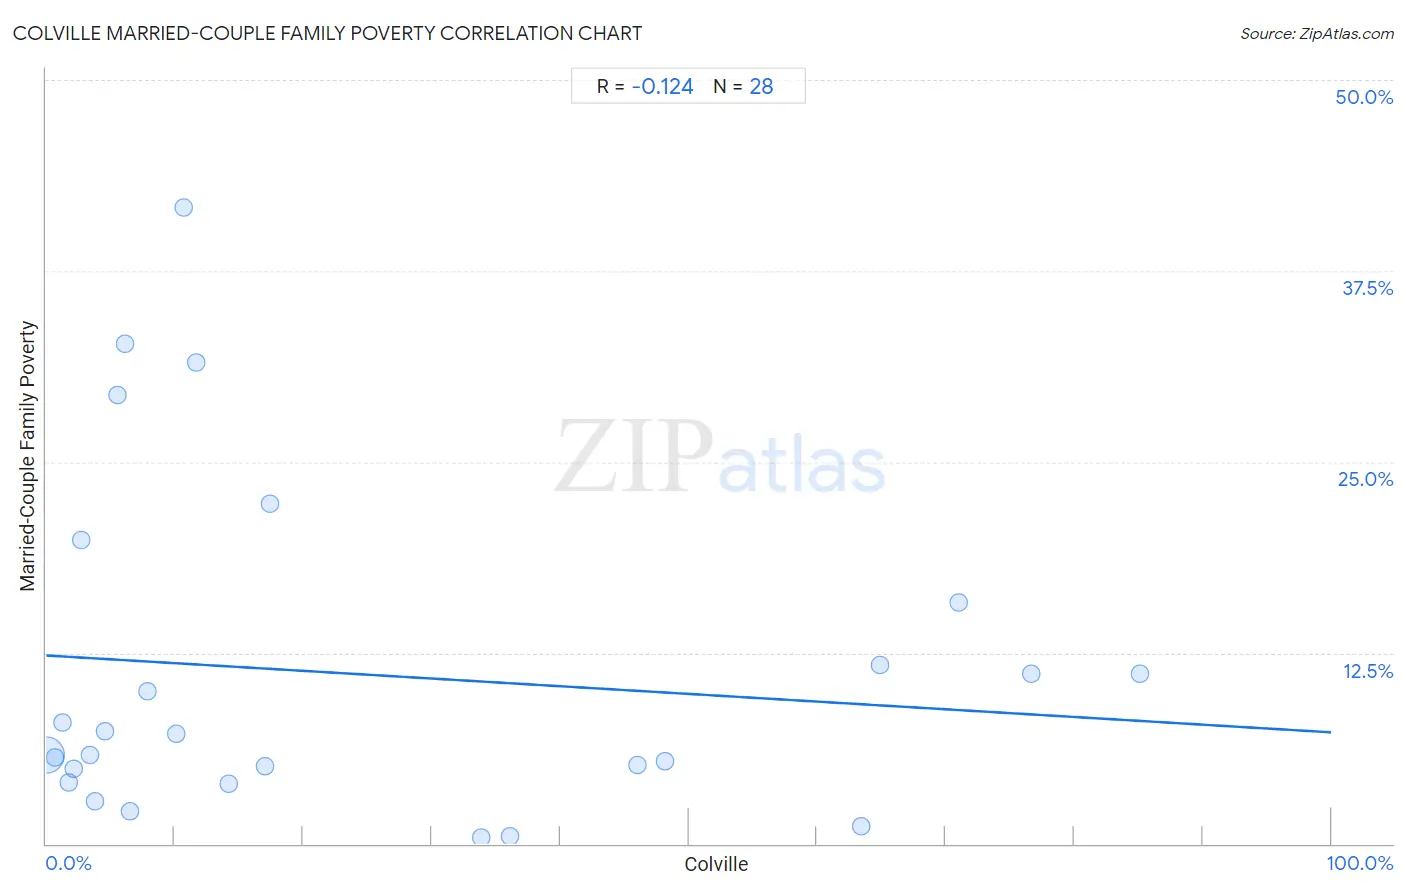
It is essential to understand that the correlation between the percentage of Colville and poverty level among married-couple families does not imply a direct cause-and-effect relationship. It remains uncertain whether the presence of Colville influences an upward or downward trend in the level of poverty level among married-couple families within an area, or if Colville simply ended up residing in those areas with higher or lower levels of poverty level among married-couple families due to other factors.

Demographics Similar to Colville by Married-Couple Family Poverty

In terms of married-couple family poverty, the demographic groups most similar to Colville are Barbadian (6.3%, a difference of 0.050%), Choctaw (6.3%, a difference of 0.21%), Yaqui (6.3%, a difference of 0.66%), Trinidadian and Tobagonian (6.2%, a difference of 0.78%), and Indonesian (6.3%, a difference of 0.80%).
DemographicsRating | RankMarried-Couple Family Poverty
Creek
0.2
/100
|
#266
Tragic
6.2%
Spanish Americans
0.2
/100
|
#267
Tragic
6.2%
Alaska Natives
0.2
/100
|
#268
Tragic
6.2%
Immigrants from West Indies
0.1
/100
|
#269
Tragic
6.2%
Immigrants from Jamaica
0.1
/100
|
#270
Tragic
6.2%
Immigrants from Bahamas
0.1
/100
|
#271
Tragic
6.2%
Trinidadians and Tobagonians
0.1
/100
|
#272
Tragic
6.2%
Colville
0.1
/100
|
#273
Tragic
6.3%
Barbadians
0.1
/100
|
#274
Tragic
6.3%
Choctaw
0.1
/100
|
#275
Tragic
6.3%
Yaqui
0.1
/100
|
#276
Tragic
6.3%
Indonesians
0.1
/100
|
#277
Tragic
6.3%
Immigrants from Trinidad and Tobago
0.1
/100
|
#278
Tragic
6.4%
Houma
0.0
/100
|
#279
Tragic
6.4%
West Indians
0.0
/100
|
#280
Tragic
6.4%

Colville Married-Couple Family Poverty Correlation Summary

MeasurementColville DataMarried-Couple Family Poverty Data
Minimum0.026%0.42%
Maximum85.1%41.7%
Range85.1%41.2%
Mean23.3%11.2%
Median10.4%6.5%
Interquartile 25% (IQ1)3.6%4.4%
Interquartile 75% (IQ3)41.0%13.7%
Interquartile Range (IQR)37.5%9.3%
Standard Deviation (Sample)26.8%10.9%
Standard Deviation (Population)26.4%10.7%

Correlation Details

Colville PercentileSample SizeMarried-Couple Family Poverty
[
0.0%
-
0.5%
]
0.026%
34,401,4235.8%
[
0.5%
-
1.0%
]
0.65%
121,9445.7%
[
1.0%
-
1.5%
]
1.28%
32,8807.9%
[
1.5%
-
2.0%
]
1.70%
13,6194.0%
[
2.0%
-
2.5%
]
2.11%
17,9534.9%
[
2.5%
-
3.0%
]
2.74%
5,86719.9%
[
3.0%
-
3.5%
]
3.37%
5,4045.8%
[
3.5%
-
4.0%
]
3.80%
3,1052.8%
[
4.5%
-
5.0%
]
4.53%
5,0337.4%
[
5.5%
-
6.0%
]
5.53%
56129.4%
[
6.0%
-
6.5%
]
6.15%
43932.7%
[
6.5%
-
7.0%
]
6.54%
4,8772.1%
[
7.5%
-
8.0%
]
7.92%
1,0989.9%
[
10.0%
-
10.5%
]
10.15%
1,0347.2%
[
10.5%
-
11.0%
]
10.66%
12241.7%
[
11.5%
-
12.0%
]
11.68%
86531.5%
[
14.0%
-
14.5%
]
14.22%
9,2183.9%
[
16.5%
-
17.0%
]
16.99%
1,3775.1%
[
17.0%
-
17.5%
]
17.45%
42422.2%
[
33.5%
-
34.0%
]
33.81%
1,5380.42%
[
36.0%
-
36.5%
]
36.06%
1,3340.50%
[
46.0%
-
46.5%
]
46.01%
2765.1%
[
48.0%
-
48.5%
]
48.15%
2705.4%
[
63.0%
-
63.5%
]
63.38%
5681.2%
[
64.5%
-
65.0%
]
64.91%
1,10311.7%
[
70.5%
-
71.0%
]
70.97%
15515.8%
[
76.5%
-
77.0%
]
76.66%
97711.1%
[
85.0%
-
85.5%
]
85.11%
30911.1%