Puerto Rican Married-Couple Family Poverty
COMPARE
Puerto Rican
Select to Compare
Married-Couple Family Poverty
Puerto Rican Married-Couple Family Poverty
12.6%
POVERTY | MARRIED-COUPLE FAMILIES
0.0/ 100
METRIC RATING
345th/ 347
METRIC RANK
Puerto Rican Married-Couple Family Poverty Correlation Chart
The statistical analysis conducted on geographies consisting of 519,143,813 people shows a significant positive correlation between the proportion of Puerto Ricans and poverty level among married-couple families in the United States with a correlation coefficient (R) of 0.660 and weighted average of 12.6%. On average, for every 1% (one percent) increase in Puerto Ricans within a typical geography, there is an increase of 0.24% in poverty level among married-couple families.
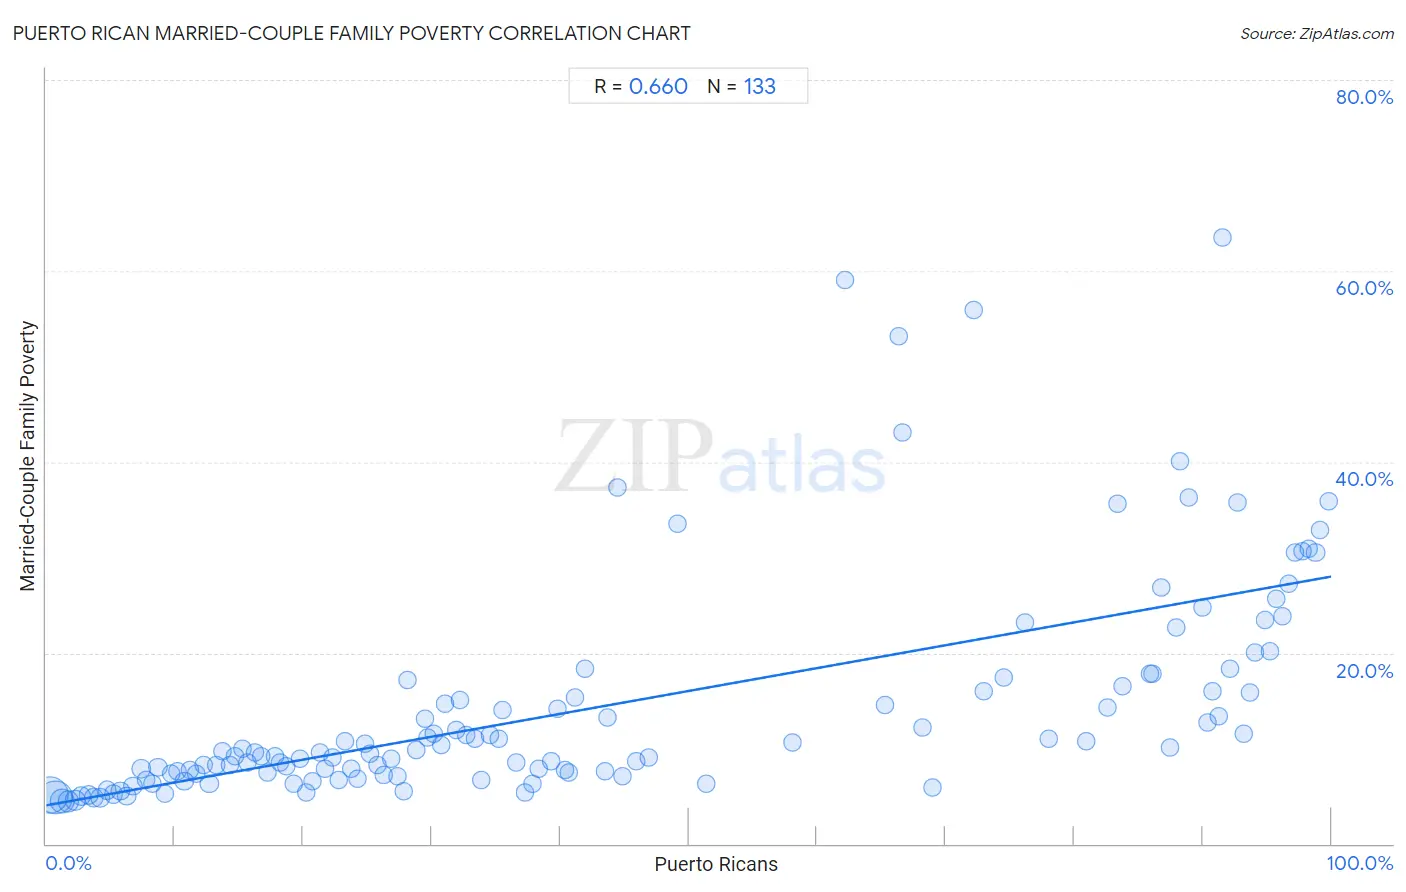
It is essential to understand that the correlation between the percentage of Puerto Ricans and poverty level among married-couple families does not imply a direct cause-and-effect relationship. It remains uncertain whether the presence of Puerto Ricans influences an upward or downward trend in the level of poverty level among married-couple families within an area, or if Puerto Ricans simply ended up residing in those areas with higher or lower levels of poverty level among married-couple families due to other factors.
Demographics Similar to Puerto Ricans by Married-Couple Family Poverty
In terms of married-couple family poverty, the demographic groups most similar to Puerto Ricans are Immigrants from Yemen (12.8%, a difference of 1.3%), Yup'ik (13.4%, a difference of 6.0%), Navajo (11.9%, a difference of 6.6%), Pima (11.4%, a difference of 10.8%), and Tohono O'odham (11.2%, a difference of 12.6%).
| Demographics | Rating | Rank | Married-Couple Family Poverty |
| Lumbee | 0.0 /100 | #333 | Tragic 8.3% |
| Immigrants from Dominican Republic | 0.0 /100 | #334 | Tragic 8.4% |
| Sioux | 0.0 /100 | #335 | Tragic 8.7% |
| Apache | 0.0 /100 | #336 | Tragic 9.0% |
| Yakama | 0.0 /100 | #337 | Tragic 9.0% |
| Cheyenne | 0.0 /100 | #338 | Tragic 9.4% |
| Crow | 0.0 /100 | #339 | Tragic 9.6% |
| Yuman | 0.0 /100 | #340 | Tragic 9.7% |
| Pueblo | 0.0 /100 | #341 | Tragic 11.1% |
| Tohono O'odham | 0.0 /100 | #342 | Tragic 11.2% |
| Pima | 0.0 /100 | #343 | Tragic 11.4% |
| Navajo | 0.0 /100 | #344 | Tragic 11.9% |
| Puerto Ricans | 0.0 /100 | #345 | Tragic 12.6% |
| Immigrants from Yemen | 0.0 /100 | #346 | Tragic 12.8% |
| Yup'ik | 0.0 /100 | #347 | Tragic 13.4% |
Puerto Rican Married-Couple Family Poverty Correlation Summary
| Measurement | Puerto Rican Data | Married-Couple Family Poverty Data |
| Minimum | 0.28% | 4.4% |
| Maximum | 99.8% | 63.5% |
| Range | 99.5% | 59.1% |
| Mean | 43.5% | 14.4% |
| Median | 33.3% | 9.7% |
| Interquartile 25% (IQ1) | 16.5% | 7.2% |
| Interquartile 75% (IQ3) | 77.1% | 16.9% |
| Interquartile Range (IQR) | 60.6% | 9.6% |
| Standard Deviation (Sample) | 32.3% | 11.7% |
| Standard Deviation (Population) | 32.2% | 11.7% |
Correlation Details
| Puerto Rican Percentile | Sample Size | Married-Couple Family Poverty |
[ 0.0% - 0.5% ] 0.28% | 166,507,506 | 5.1% |
[ 0.5% - 1.0% ] 0.72% | 134,978,272 | 4.8% |
[ 1.0% - 1.5% ] 1.22% | 59,747,668 | 4.5% |
[ 1.5% - 2.0% ] 1.73% | 29,550,655 | 4.4% |
[ 2.0% - 2.5% ] 2.23% | 17,351,722 | 4.5% |
[ 2.5% - 3.0% ] 2.74% | 13,624,846 | 5.0% |
[ 3.0% - 3.5% ] 3.29% | 12,638,025 | 5.1% |
[ 3.5% - 4.0% ] 3.72% | 9,899,237 | 4.9% |
[ 4.0% - 4.5% ] 4.23% | 7,099,701 | 4.8% |
[ 4.5% - 5.0% ] 4.75% | 6,801,080 | 5.6% |
[ 5.0% - 5.5% ] 5.22% | 4,597,765 | 5.2% |
[ 5.5% - 6.0% ] 5.75% | 4,670,658 | 5.5% |
[ 6.0% - 6.5% ] 6.26% | 3,459,695 | 5.0% |
[ 6.5% - 7.0% ] 6.75% | 3,390,195 | 6.0% |
[ 7.0% - 7.5% ] 7.43% | 11,111,508 | 7.9% |
[ 7.5% - 8.0% ] 7.78% | 2,221,250 | 6.7% |
[ 8.0% - 8.5% ] 8.24% | 2,078,695 | 6.3% |
[ 8.5% - 9.0% ] 8.68% | 3,938,729 | 8.0% |
[ 9.0% - 9.5% ] 9.25% | 2,080,993 | 5.3% |
[ 9.5% - 10.0% ] 9.71% | 1,953,997 | 7.4% |
[ 10.0% - 10.5% ] 10.24% | 830,966 | 7.6% |
[ 10.5% - 11.0% ] 10.75% | 1,490,229 | 6.5% |
[ 11.0% - 11.5% ] 11.21% | 874,056 | 7.8% |
[ 11.5% - 12.0% ] 11.72% | 797,387 | 7.3% |
[ 12.0% - 12.5% ] 12.21% | 628,234 | 8.3% |
[ 12.5% - 13.0% ] 12.69% | 754,794 | 6.3% |
[ 13.0% - 13.5% ] 13.21% | 574,340 | 8.2% |
[ 13.5% - 14.0% ] 13.69% | 413,876 | 9.7% |
[ 14.0% - 14.5% ] 14.31% | 763,441 | 8.3% |
[ 14.5% - 15.0% ] 14.70% | 810,623 | 9.1% |
[ 15.0% - 15.5% ] 15.31% | 153,844 | 9.9% |
[ 15.5% - 16.0% ] 15.70% | 877,693 | 8.5% |
[ 16.0% - 16.5% ] 16.26% | 432,230 | 9.6% |
[ 16.5% - 17.0% ] 16.77% | 530,543 | 9.2% |
[ 17.0% - 17.5% ] 17.25% | 241,560 | 7.4% |
[ 17.5% - 18.0% ] 17.82% | 304,076 | 9.2% |
[ 18.0% - 18.5% ] 18.15% | 361,635 | 8.6% |
[ 18.5% - 19.0% ] 18.64% | 185,706 | 8.2% |
[ 19.0% - 19.5% ] 19.27% | 200,266 | 6.3% |
[ 19.5% - 20.0% ] 19.76% | 217,840 | 8.9% |
[ 20.0% - 20.5% ] 20.23% | 93,241 | 5.4% |
[ 20.5% - 21.0% ] 20.69% | 354,632 | 6.6% |
[ 21.0% - 21.5% ] 21.28% | 318,580 | 9.6% |
[ 21.5% - 22.0% ] 21.70% | 146,453 | 7.8% |
[ 22.0% - 22.5% ] 22.26% | 69,958 | 9.0% |
[ 22.5% - 23.0% ] 22.78% | 158,510 | 6.6% |
[ 23.0% - 23.5% ] 23.26% | 259,390 | 10.7% |
[ 23.5% - 24.0% ] 23.76% | 53,772 | 7.9% |
[ 24.0% - 24.5% ] 24.21% | 189,403 | 6.9% |
[ 24.5% - 25.0% ] 24.79% | 39,261 | 10.5% |
[ 25.0% - 25.5% ] 25.17% | 74,666 | 9.5% |
[ 25.5% - 26.0% ] 25.78% | 294,946 | 8.3% |
[ 26.0% - 26.5% ] 26.24% | 109,922 | 7.2% |
[ 26.5% - 27.0% ] 26.82% | 210,328 | 8.9% |
[ 27.0% - 27.5% ] 27.29% | 115,635 | 7.0% |
[ 27.5% - 28.0% ] 27.85% | 84,562 | 5.5% |
[ 28.0% - 28.5% ] 28.10% | 207,807 | 17.2% |
[ 28.5% - 29.0% ] 28.75% | 138,085 | 9.9% |
[ 29.0% - 29.5% ] 29.43% | 88,180 | 13.1% |
[ 29.5% - 30.0% ] 29.70% | 120,128 | 11.2% |
[ 30.0% - 30.5% ] 30.13% | 50,636 | 11.6% |
[ 30.5% - 31.0% ] 30.78% | 29,086 | 10.3% |
[ 31.0% - 31.5% ] 31.05% | 50,450 | 14.6% |
[ 31.5% - 32.0% ] 31.94% | 127,342 | 12.0% |
[ 32.0% - 32.5% ] 32.18% | 64,284 | 15.1% |
[ 32.5% - 33.0% ] 32.66% | 154,688 | 11.4% |
[ 33.0% - 33.5% ] 33.32% | 121,057 | 11.1% |
[ 33.5% - 34.0% ] 33.83% | 74,212 | 6.7% |
[ 34.5% - 35.0% ] 34.57% | 71,241 | 11.4% |
[ 35.0% - 35.5% ] 35.17% | 39,166 | 11.1% |
[ 35.5% - 36.0% ] 35.53% | 13,479 | 14.0% |
[ 36.5% - 37.0% ] 36.60% | 68,321 | 8.5% |
[ 37.0% - 37.5% ] 37.23% | 19,353 | 5.3% |
[ 37.5% - 38.0% ] 37.86% | 9,467 | 6.3% |
[ 38.0% - 38.5% ] 38.35% | 16,024 | 7.8% |
[ 39.0% - 39.5% ] 39.30% | 194,833 | 8.7% |
[ 39.5% - 40.0% ] 39.75% | 51,640 | 14.2% |
[ 40.0% - 40.5% ] 40.34% | 76,094 | 7.7% |
[ 40.5% - 41.0% ] 40.69% | 69,311 | 7.5% |
[ 41.0% - 41.5% ] 41.13% | 44,030 | 15.3% |
[ 41.5% - 42.0% ] 41.93% | 62,474 | 18.3% |
[ 43.0% - 43.5% ] 43.47% | 8,418 | 7.6% |
[ 43.5% - 44.0% ] 43.72% | 70,222 | 13.3% |
[ 44.0% - 44.5% ] 44.43% | 25,642 | 37.4% |
[ 44.5% - 45.0% ] 44.86% | 43,330 | 7.1% |
[ 45.5% - 46.0% ] 45.93% | 34,257 | 8.6% |
[ 46.5% - 47.0% ] 46.89% | 77,830 | 9.1% |
[ 49.0% - 49.5% ] 49.13% | 633 | 33.5% |
[ 51.0% - 51.5% ] 51.41% | 22,606 | 6.2% |
[ 58.0% - 58.5% ] 58.07% | 12,443 | 10.6% |
[ 62.0% - 62.5% ] 62.20% | 246 | 59.1% |
[ 65.0% - 65.5% ] 65.24% | 12,045 | 14.5% |
[ 66.0% - 66.5% ] 66.33% | 781 | 53.1% |
[ 66.5% - 67.0% ] 66.65% | 17,941 | 43.0% |
[ 68.0% - 68.5% ] 68.15% | 7,087 | 12.2% |
[ 68.5% - 69.0% ] 68.99% | 8,220 | 6.0% |
[ 72.0% - 72.5% ] 72.22% | 24,713 | 55.9% |
[ 72.5% - 73.0% ] 72.96% | 5,955 | 15.9% |
[ 74.5% - 75.0% ] 74.52% | 5,260 | 17.4% |
[ 76.0% - 76.5% ] 76.20% | 17,293 | 23.2% |
[ 77.5% - 78.0% ] 77.98% | 16,890 | 11.1% |
[ 80.5% - 81.0% ] 80.95% | 16,607 | 10.8% |
[ 82.5% - 83.0% ] 82.54% | 590 | 14.3% |
[ 83.0% - 83.5% ] 83.33% | 3,233 | 35.6% |
[ 83.5% - 84.0% ] 83.71% | 2,492 | 16.5% |
[ 85.5% - 86.0% ] 85.92% | 38,239 | 17.8% |
[ 86.0% - 86.5% ] 86.12% | 342,297 | 17.8% |
[ 86.5% - 87.0% ] 86.74% | 40,064 | 26.9% |
[ 87.0% - 87.5% ] 87.45% | 17,323 | 10.0% |
[ 87.5% - 88.0% ] 87.90% | 4,562 | 22.6% |
[ 88.0% - 88.5% ] 88.19% | 40,300 | 40.1% |
[ 88.5% - 89.0% ] 88.88% | 7,068 | 36.3% |
[ 89.5% - 90.0% ] 89.97% | 13,876 | 24.8% |
[ 90.0% - 90.5% ] 90.35% | 146,989 | 12.7% |
[ 90.5% - 91.0% ] 90.80% | 32,781 | 15.9% |
[ 91.0% - 91.5% ] 91.25% | 189,184 | 13.4% |
[ 91.5% - 92.0% ] 91.58% | 606 | 63.5% |
[ 92.0% - 92.5% ] 92.08% | 51,852 | 18.3% |
[ 92.5% - 93.0% ] 92.66% | 25,965 | 35.7% |
[ 93.0% - 93.5% ] 93.15% | 110,548 | 11.5% |
[ 93.5% - 94.0% ] 93.63% | 30,160 | 15.9% |
[ 94.0% - 94.5% ] 94.10% | 281,717 | 20.1% |
[ 94.5% - 95.0% ] 94.81% | 235,271 | 23.5% |
[ 95.0% - 95.5% ] 95.25% | 311,824 | 20.2% |
[ 95.5% - 96.0% ] 95.73% | 149,189 | 25.6% |
[ 96.0% - 96.5% ] 96.18% | 329,088 | 23.8% |
[ 96.5% - 97.0% ] 96.73% | 351,649 | 27.3% |
[ 97.0% - 97.5% ] 97.19% | 196,560 | 30.5% |
[ 97.5% - 98.0% ] 97.73% | 521,312 | 30.6% |
[ 98.0% - 98.5% ] 98.27% | 376,077 | 30.9% |
[ 98.5% - 99.0% ] 98.78% | 506,811 | 30.6% |
[ 99.0% - 99.5% ] 99.17% | 450,589 | 32.9% |
[ 99.5% - 100.0% ] 99.82% | 226,995 | 35.8% |