Ecuadorian Married-Couple Family Poverty
COMPARE
Ecuadorian
Select to Compare
Married-Couple Family Poverty
Ecuadorian Married-Couple Family Poverty
6.5%
POVERTY | MARRIED-COUPLE FAMILIES
0.0/ 100
METRIC RATING
287th/ 347
METRIC RANK
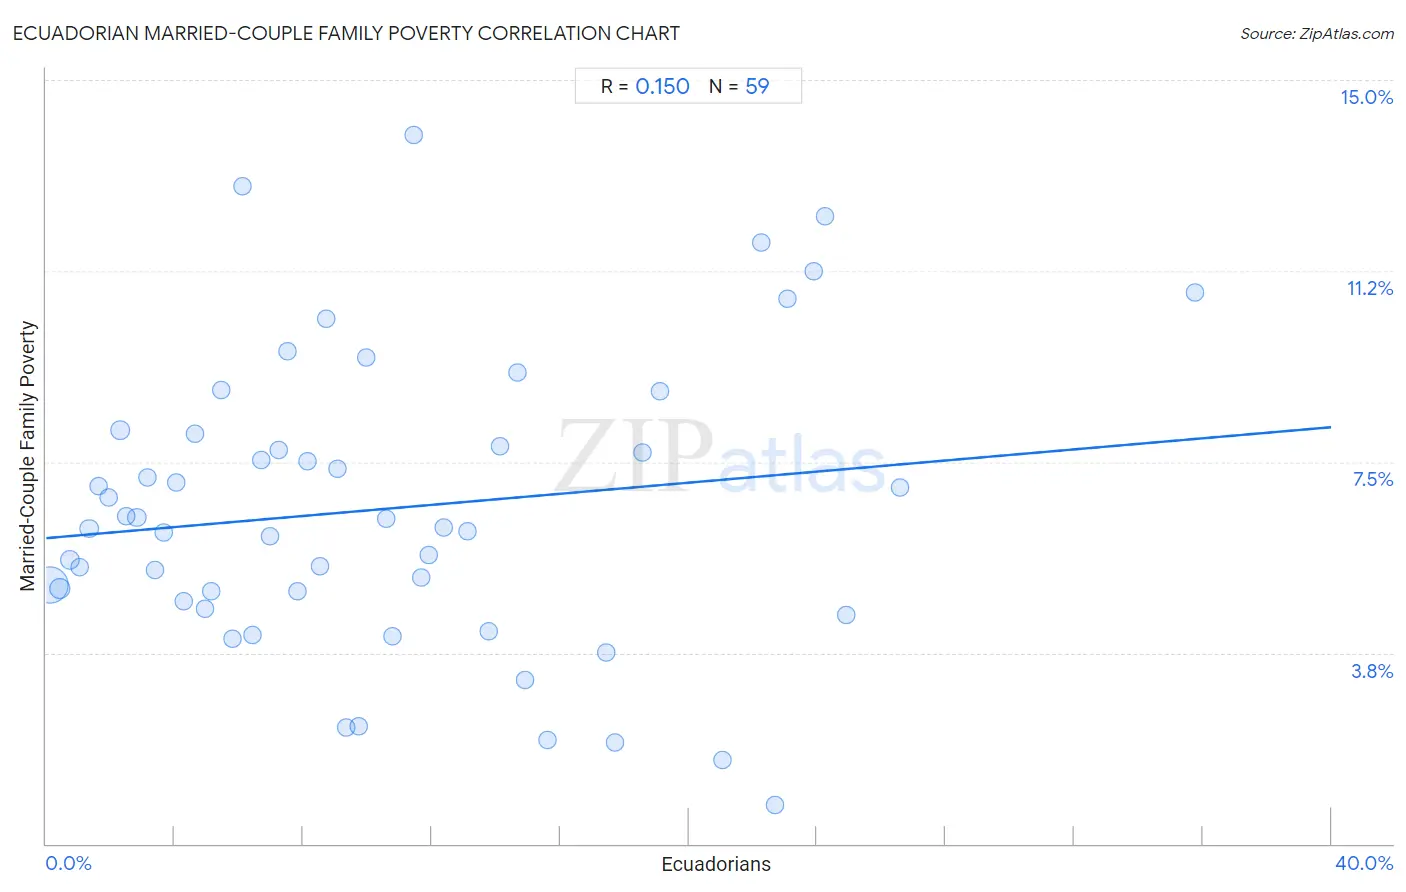
Ecuadorian Married-Couple Family Poverty Correlation Chart
The statistical analysis conducted on geographies consisting of 315,566,767 people shows a poor positive correlation between the proportion of Ecuadorians and poverty level among married-couple families in the United States with a correlation coefficient (R) of 0.150 and weighted average of 6.5%. On average, for every 1% (one percent) increase in Ecuadorians within a typical geography, there is an increase of 0.054% in poverty level among married-couple families.
It is essential to understand that the correlation between the percentage of Ecuadorians and poverty level among married-couple families does not imply a direct cause-and-effect relationship. It remains uncertain whether the presence of Ecuadorians influences an upward or downward trend in the level of poverty level among married-couple families within an area, or if Ecuadorians simply ended up residing in those areas with higher or lower levels of poverty level among married-couple families due to other factors.
Demographics Similar to Ecuadorians by Married-Couple Family Poverty
In terms of married-couple family poverty, the demographic groups most similar to Ecuadorians are Salvadoran (6.5%, a difference of 0.19%), Nepalese (6.5%, a difference of 0.36%), Guyanese (6.5%, a difference of 0.37%), Black/African American (6.5%, a difference of 0.47%), and Immigrants from Barbados (6.5%, a difference of 0.59%).
| Demographics | Rating | Rank | Married-Couple Family Poverty |
| West Indians | 0.0 /100 | #280 | Tragic 6.4% |
| Mexican American Indians | 0.0 /100 | #281 | Tragic 6.4% |
| Seminole | 0.0 /100 | #282 | Tragic 6.4% |
| Ute | 0.0 /100 | #283 | Tragic 6.4% |
| Dutch West Indians | 0.0 /100 | #284 | Tragic 6.4% |
| Blacks/African Americans | 0.0 /100 | #285 | Tragic 6.5% |
| Guyanese | 0.0 /100 | #286 | Tragic 6.5% |
| Ecuadorians | 0.0 /100 | #287 | Tragic 6.5% |
| Salvadorans | 0.0 /100 | #288 | Tragic 6.5% |
| Nepalese | 0.0 /100 | #289 | Tragic 6.5% |
| Immigrants from Barbados | 0.0 /100 | #290 | Tragic 6.5% |
| Belizeans | 0.0 /100 | #291 | Tragic 6.5% |
| Immigrants from Lebanon | 0.0 /100 | #292 | Tragic 6.6% |
| Arapaho | 0.0 /100 | #293 | Tragic 6.6% |
| Bahamians | 0.0 /100 | #294 | Tragic 6.6% |
Ecuadorian Married-Couple Family Poverty Correlation Summary
| Measurement | Ecuadorian Data | Married-Couple Family Poverty Data |
| Minimum | 0.10% | 0.76% |
| Maximum | 35.8% | 13.9% |
| Range | 35.7% | 13.2% |
| Mean | 10.6% | 6.6% |
| Median | 8.7% | 6.2% |
| Interquartile 25% (IQ1) | 4.3% | 4.8% |
| Interquartile 75% (IQ3) | 14.9% | 8.1% |
| Interquartile Range (IQR) | 10.6% | 3.3% |
| Standard Deviation (Sample) | 8.0% | 2.9% |
| Standard Deviation (Population) | 7.9% | 2.9% |
Correlation Details
| Ecuadorian Percentile | Sample Size | Married-Couple Family Poverty |
[ 0.0% - 0.5% ] 0.10% | 225,071,973 | 5.1% |
[ 0.0% - 0.5% ] 0.42% | 34,977,492 | 5.0% |
[ 0.5% - 1.0% ] 0.74% | 17,960,856 | 5.6% |
[ 1.0% - 1.5% ] 1.03% | 7,794,210 | 5.4% |
[ 1.0% - 1.5% ] 1.33% | 4,741,653 | 6.2% |
[ 1.5% - 2.0% ] 1.64% | 3,777,396 | 7.0% |
[ 1.5% - 2.0% ] 1.93% | 1,860,819 | 6.8% |
[ 2.0% - 2.5% ] 2.29% | 10,105,446 | 8.1% |
[ 2.0% - 2.5% ] 2.49% | 1,866,010 | 6.4% |
[ 2.5% - 3.0% ] 2.82% | 1,041,132 | 6.4% |
[ 3.0% - 3.5% ] 3.16% | 1,009,161 | 7.2% |
[ 3.0% - 3.5% ] 3.39% | 677,273 | 5.4% |
[ 3.5% - 4.0% ] 3.68% | 261,615 | 6.1% |
[ 4.0% - 4.5% ] 4.04% | 204,291 | 7.1% |
[ 4.0% - 4.5% ] 4.28% | 364,583 | 4.8% |
[ 4.5% - 5.0% ] 4.63% | 293,734 | 8.1% |
[ 4.5% - 5.0% ] 4.94% | 74,462 | 4.6% |
[ 5.0% - 5.5% ] 5.12% | 295,399 | 5.0% |
[ 5.0% - 5.5% ] 5.44% | 78,320 | 8.9% |
[ 5.5% - 6.0% ] 5.79% | 70,312 | 4.0% |
[ 6.0% - 6.5% ] 6.10% | 158,793 | 12.9% |
[ 6.0% - 6.5% ] 6.41% | 105,683 | 4.1% |
[ 6.5% - 7.0% ] 6.71% | 195,744 | 7.5% |
[ 6.5% - 7.0% ] 6.96% | 100,875 | 6.0% |
[ 7.0% - 7.5% ] 7.25% | 222,817 | 7.7% |
[ 7.5% - 8.0% ] 7.52% | 181,924 | 9.7% |
[ 7.5% - 8.0% ] 7.83% | 148,572 | 5.0% |
[ 8.0% - 8.5% ] 8.12% | 104,421 | 7.5% |
[ 8.5% - 9.0% ] 8.53% | 142,599 | 5.4% |
[ 8.5% - 9.0% ] 8.72% | 331,552 | 10.3% |
[ 9.0% - 9.5% ] 9.07% | 31,554 | 7.4% |
[ 9.0% - 9.5% ] 9.34% | 12,343 | 2.3% |
[ 9.5% - 10.0% ] 9.74% | 51,505 | 2.3% |
[ 9.5% - 10.0% ] 9.96% | 224,421 | 9.6% |
[ 10.5% - 11.0% ] 10.58% | 91,516 | 6.4% |
[ 10.5% - 11.0% ] 10.78% | 86,456 | 4.1% |
[ 11.0% - 11.5% ] 11.43% | 22,800 | 13.9% |
[ 11.5% - 12.0% ] 11.65% | 127,356 | 5.2% |
[ 11.5% - 12.0% ] 11.89% | 105,521 | 5.7% |
[ 12.0% - 12.5% ] 12.37% | 100,539 | 6.2% |
[ 13.0% - 13.5% ] 13.11% | 9,606 | 6.1% |
[ 13.5% - 14.0% ] 13.78% | 108,046 | 4.2% |
[ 14.0% - 14.5% ] 14.12% | 70,070 | 7.8% |
[ 14.5% - 15.0% ] 14.65% | 41,907 | 9.3% |
[ 14.5% - 15.0% ] 14.88% | 27,076 | 3.2% |
[ 15.5% - 16.0% ] 15.60% | 3,262 | 2.0% |
[ 17.0% - 17.5% ] 17.43% | 11,777 | 3.7% |
[ 17.5% - 18.0% ] 17.72% | 1,078 | 2.0% |
[ 18.5% - 19.0% ] 18.55% | 275 | 7.7% |
[ 19.0% - 19.5% ] 19.11% | 21,040 | 8.9% |
[ 21.0% - 21.5% ] 21.04% | 1,231 | 1.6% |
[ 22.0% - 22.5% ] 22.25% | 5,946 | 11.8% |
[ 22.5% - 23.0% ] 22.68% | 5,587 | 0.76% |
[ 23.0% - 23.5% ] 23.08% | 1,005 | 10.7% |
[ 23.5% - 24.0% ] 23.90% | 112,750 | 11.2% |
[ 24.0% - 24.5% ] 24.24% | 56,696 | 12.3% |
[ 24.5% - 25.0% ] 24.90% | 9,162 | 4.5% |
[ 26.5% - 27.0% ] 26.59% | 4,407 | 7.0% |
[ 35.5% - 36.0% ] 35.76% | 2,718 | 10.8% |