Immigrants from Yemen Married-Couple Family Poverty

COMPARE

Immigrants from Yemen
Race
Ancestry
AfghanAfricanAlaska NativeAlaskan AthabascanAlbanianAleutAlsatianAmericanApacheArabArapahoArgentineanArmenianAssyrian/Chaldean/SyriacAustralianAustrianBahamianBangladeshiBarbadianBasqueBelgianBelizeanBermudanBhutaneseBlackfeetBolivianBrazilianBritishBritish West IndianBulgarianBurmeseCajunCambodianCanadianCape VerdeanCarpatho RusynCelticCentral AmericanCentral American IndianCherokeeCheyenneChickasawChileanChineseChippewaChoctawColombianColvilleComancheCosta RicanCreeCreekCroatianCrowCubanCypriotCzechCzechoslovakianDanishDelawareDominicanDutchDutch West IndianEastern EuropeanEcuadorianEgyptianEnglishEstonianEthiopianEuropeanFijianFilipinoFinnishFrenchFrench American IndianFrench CanadianGermanGerman RussianGhanaianGreekGuamanian/ChamorroGuatemalanGuyaneseHaitianHmongHonduranHopiHoumaHungarianIcelanderIndian (Asian)IndonesianInupiatIranianIraqiIrishIroquoisIsraeliItalianJamaicanJapaneseJordanianKenyanKiowaKoreanLaotianLatvianLebaneseLiberianLithuanianLumbeeLuxembourgerMacedonianMalaysianMalteseMarshalleseMenomineeMexicanMexican American IndianMongolianMoroccanNative HawaiianNavajoNepaleseNew ZealanderNicaraguanNigerianNorthern EuropeanNorwegianOkinawanOsageOttawaPaiutePakistaniPalestinianPanamanianParaguayanPennsylvania GermanPeruvianPimaPolishPortuguesePotawatomiPuebloPuerto RicanPuget Sound SalishRomanianRussianSalvadoranSamoanScandinavianScotch-IrishScottishSeminoleSenegaleseSerbianShoshoneSierra LeoneanSiouxSlavicSlovakSloveneSomaliSouth AfricanSouth AmericanSouth American IndianSoviet UnionSpaniardSpanishSpanish AmericanSpanish American IndianSri LankanSubsaharan AfricanSudaneseSwedishSwissSyrianTaiwaneseThaiTlingit-HaidaTohono O'OdhamTonganTrinidadian and TobagonianTsimshianTurkishU.S. Virgin IslanderUgandanUkrainianUruguayanUteVenezuelanVietnameseWelshWest IndianYakamaYaquiYugoslavianYumanYup'ikZimbabwean
Immigration
NonimmigrantsImmigrantsAfghanistanAfricaAlbaniaArgentinaArmeniaAsiaAustraliaAustriaBahamasBangladeshBarbadosBelarusBelgiumBelizeBoliviaBosnia and HerzegovinaBrazilBulgariaBurma/MyanmarCabo VerdeCambodiaCameroonCanadaCaribbeanCentral AmericaChileChinaColombiaCongoCosta RicaCroatiaCubaCzechoslovakiaDenmarkDominicaDominican RepublicEastern AfricaEastern AsiaEastern EuropeEcuadorEgyptEl SalvadorEnglandEritreaEthiopiaEuropeFijiFranceGermanyGhanaGreeceGrenadaGuatemalaGuyanaHaitiHondurasHong KongHungaryIndiaIndonesiaIranIraqIrelandIsraelItalyJamaicaJapanJordanKazakhstanKenyaKoreaKuwaitLaosLatin AmericaLatviaLebanonLiberiaLithuaniaMalaysiaMexicoMicronesiaMiddle AfricaMoldovaMoroccoNepalNetherlandsNicaraguaNigeriaNorth AmericaNorth MacedoniaNorthern AfricaNorthern EuropeNorwayOceaniaPakistanPanamaPeruPhilippinesPolandPortugalRomaniaRussiaSaudi ArabiaScotlandSenegalSerbiaSierra LeoneSingaporeSomaliaSouth AfricaSouth AmericaSouth Central AsiaSouth Eastern AsiaSouthern EuropeSpainSri LankaSt. Vincent and the GrenadinesSudanSwedenSwitzerlandSyriaTaiwanThailandTrinidad and TobagoTurkeyUgandaUkraineUruguayUzbekistanVenezuelaVietnamWest IndiesWestern AfricaWestern AsiaWestern EuropeYemenZaireZimbabweAzores
Select to Compare
Race
Ancestry
AfghanAfricanAlaska NativeAlaskan AthabascanAlbanianAleutAlsatianAmericanApacheArabArapahoArgentineanArmenianAssyrian/Chaldean/SyriacAustralianAustrianBahamianBangladeshiBarbadianBasqueBelgianBelizeanBermudanBhutaneseBlackfeetBolivianBrazilianBritishBritish West IndianBulgarianBurmeseCajunCambodianCanadianCape VerdeanCarpatho RusynCelticCentral AmericanCentral American IndianCherokeeCheyenneChickasawChileanChineseChippewaChoctawColombianColvilleComancheCosta RicanCreeCreekCroatianCrowCubanCypriotCzechCzechoslovakianDanishDelawareDominicanDutchDutch West IndianEastern EuropeanEcuadorianEgyptianEnglishEstonianEthiopianEuropeanFijianFilipinoFinnishFrenchFrench American IndianFrench CanadianGermanGerman RussianGhanaianGreekGuamanian/ChamorroGuatemalanGuyaneseHaitianHmongHonduranHopiHoumaHungarianIcelanderIndian (Asian)IndonesianInupiatIranianIraqiIrishIroquoisIsraeliItalianJamaicanJapaneseJordanianKenyanKiowaKoreanLaotianLatvianLebaneseLiberianLithuanianLumbeeLuxembourgerMacedonianMalaysianMalteseMarshalleseMenomineeMexicanMexican American IndianMongolianMoroccanNative HawaiianNavajoNepaleseNew ZealanderNicaraguanNigerianNorthern EuropeanNorwegianOkinawanOsageOttawaPaiutePakistaniPalestinianPanamanianParaguayanPennsylvania GermanPeruvianPimaPolishPortuguesePotawatomiPuebloPuerto RicanPuget Sound SalishRomanianRussianSalvadoranSamoanScandinavianScotch-IrishScottishSeminoleSenegaleseSerbianShoshoneSierra LeoneanSiouxSlavicSlovakSloveneSomaliSouth AfricanSouth AmericanSouth American IndianSoviet UnionSpaniardSpanishSpanish AmericanSpanish American IndianSri LankanSubsaharan AfricanSudaneseSwedishSwissSyrianTaiwaneseThaiTlingit-HaidaTohono O'OdhamTonganTrinidadian and TobagonianTsimshianTurkishU.S. Virgin IslanderUgandanUkrainianUruguayanUteVenezuelanVietnameseWelshWest IndianYakamaYaquiYugoslavianYumanYup'ikZimbabwean
Immigration
NonimmigrantsImmigrantsAfghanistanAfricaAlbaniaArgentinaArmeniaAsiaAustraliaAustriaBahamasBangladeshBarbadosBelarusBelgiumBelizeBoliviaBosnia and HerzegovinaBrazilBulgariaBurma/MyanmarCabo VerdeCambodiaCameroonCanadaCaribbeanCentral AmericaChileChinaColombiaCongoCosta RicaCroatiaCubaCzechoslovakiaDenmarkDominicaDominican RepublicEastern AfricaEastern AsiaEastern EuropeEcuadorEgyptEl SalvadorEnglandEritreaEthiopiaEuropeFijiFranceGermanyGhanaGreeceGrenadaGuatemalaGuyanaHaitiHondurasHong KongHungaryIndiaIndonesiaIranIraqIrelandIsraelItalyJamaicaJapanJordanKazakhstanKenyaKoreaKuwaitLaosLatin AmericaLatviaLebanonLiberiaLithuaniaMalaysiaMexicoMicronesiaMiddle AfricaMoldovaMoroccoNepalNetherlandsNicaraguaNigeriaNorth AmericaNorth MacedoniaNorthern AfricaNorthern EuropeNorwayOceaniaPakistanPanamaPeruPhilippinesPolandPortugalRomaniaRussiaSaudi ArabiaScotlandSenegalSerbiaSierra LeoneSingaporeSomaliaSouth AfricaSouth AmericaSouth Central AsiaSouth Eastern AsiaSouthern EuropeSpainSri LankaSt. Vincent and the GrenadinesSudanSwedenSwitzerlandSyriaTaiwanThailandTrinidad and TobagoTurkeyUgandaUkraineUruguayUzbekistanVenezuelaVietnamWest IndiesWestern AfricaWestern AsiaWestern EuropeZaireZimbabweAzores
Married-Couple Family Poverty
Income
Poverty
Unemployment
Labor Participation
Family Structure
Vehicle Availability
Education Level
Disability

Immigrants from Yemen Married-Couple Family Poverty
Tragic

12.8%
POVERTY | MARRIED-COUPLE FAMILIES
0.0/ 100
METRIC RATING
346th/ 347
METRIC RANK

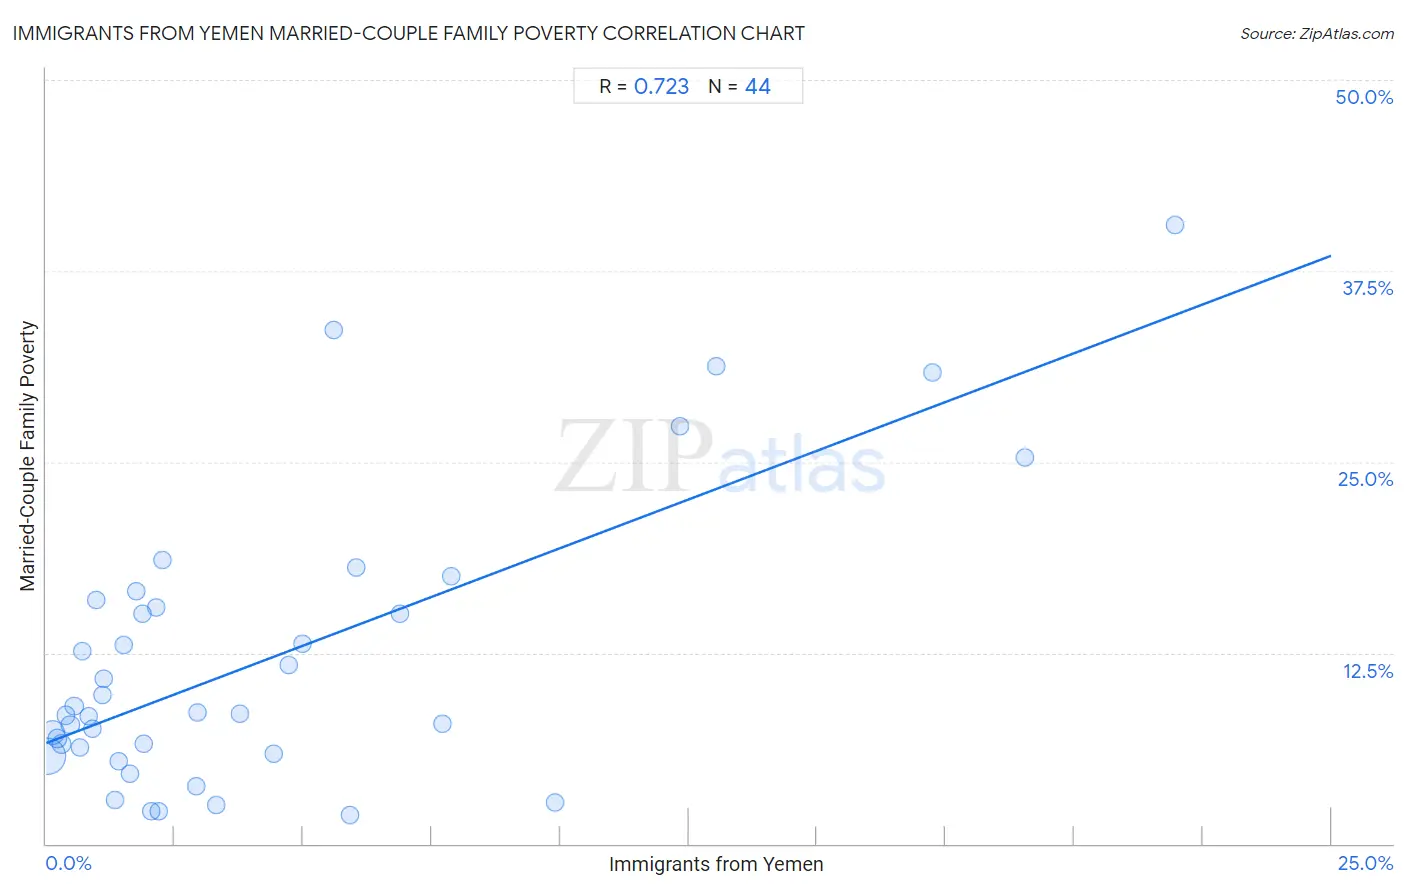
Immigrants from Yemen Married-Couple Family Poverty Correlation Chart

The statistical analysis conducted on geographies consisting of 82,374,937 people shows a strong positive correlation between the proportion of Immigrants from Yemen and poverty level among married-couple families in the United States with a correlation coefficient (R) of 0.723 and weighted average of 12.8%. On average, for every 1% (one percent) increase in Immigrants from Yemen within a typical geography, there is an increase of 1.3% in poverty level among married-couple families.
Immigrants from Yemen Married-Couple Family Poverty
It is essential to understand that the correlation between the percentage of Immigrants from Yemen and poverty level among married-couple families does not imply a direct cause-and-effect relationship. It remains uncertain whether the presence of Immigrants from Yemen influences an upward or downward trend in the level of poverty level among married-couple families within an area, or if Immigrants from Yemen simply ended up residing in those areas with higher or lower levels of poverty level among married-couple families due to other factors.

Demographics Similar to Immigrants from Yemen by Married-Couple Family Poverty

In terms of married-couple family poverty, the demographic groups most similar to Immigrants from Yemen are Puerto Rican (12.6%, a difference of 1.3%), Yup'ik (13.4%, a difference of 4.6%), Navajo (11.9%, a difference of 8.0%), Pima (11.4%, a difference of 12.2%), and Tohono O'odham (11.2%, a difference of 14.1%).
DemographicsRating | RankMarried-Couple Family Poverty
Lumbee
0.0
/100
|
#333
Tragic
8.3%
Immigrants from Dominican Republic
0.0
/100
|
#334
Tragic
8.4%
Sioux
0.0
/100
|
#335
Tragic
8.7%
Apache
0.0
/100
|
#336
Tragic
9.0%
Yakama
0.0
/100
|
#337
Tragic
9.0%
Cheyenne
0.0
/100
|
#338
Tragic
9.4%
Crow
0.0
/100
|
#339
Tragic
9.6%
Yuman
0.0
/100
|
#340
Tragic
9.7%
Pueblo
0.0
/100
|
#341
Tragic
11.1%
Tohono O'odham
0.0
/100
|
#342
Tragic
11.2%
Pima
0.0
/100
|
#343
Tragic
11.4%
Navajo
0.0
/100
|
#344
Tragic
11.9%
Puerto Ricans
0.0
/100
|
#345
Tragic
12.6%
Immigrants from Yemen
0.0
/100
|
#346
Tragic
12.8%
Yup'ik
0.0
/100
|
#347
Tragic
13.4%

Immigrants from Yemen Married-Couple Family Poverty Correlation Summary

MeasurementImmigrants from Yemen DataMarried-Couple Family Poverty Data
Minimum0.021%1.9%
Maximum22.0%40.5%
Range21.9%38.6%
Mean4.3%12.1%
Median2.1%8.6%
Interquartile 25% (IQ1)0.93%6.1%
Interquartile 75% (IQ3)5.8%15.7%
Interquartile Range (IQR)4.8%9.6%
Standard Deviation (Sample)5.2%9.2%
Standard Deviation (Population)5.2%9.1%

Correlation Details

Immigrants from Yemen PercentileSample SizeMarried-Couple Family Poverty
[
0.0%
-
0.5%
]
0.021%
52,178,5845.7%
[
0.0%
-
0.5%
]
0.12%
17,192,4627.3%
[
0.0%
-
0.5%
]
0.21%
4,576,4016.9%
[
0.0%
-
0.5%
]
0.29%
2,103,0106.5%
[
0.0%
-
0.5%
]
0.38%
1,743,7188.4%
[
0.0%
-
0.5%
]
0.46%
1,570,0057.8%
[
0.5%
-
1.0%
]
0.55%
507,7129.0%
[
0.5%
-
1.0%
]
0.66%
280,3646.3%
[
0.5%
-
1.0%
]
0.70%
897,06912.6%
[
0.5%
-
1.0%
]
0.82%
228,6548.4%
[
0.5%
-
1.0%
]
0.89%
77,8097.5%
[
0.5%
-
1.0%
]
0.97%
127,78715.9%
[
1.0%
-
1.5%
]
1.09%
49,1419.7%
[
1.0%
-
1.5%
]
1.13%
64,19910.8%
[
1.0%
-
1.5%
]
1.33%
17,9922.9%
[
1.0%
-
1.5%
]
1.42%
78,7505.4%
[
1.5%
-
2.0%
]
1.50%
76,55413.0%
[
1.5%
-
2.0%
]
1.62%
8,7654.6%
[
1.5%
-
2.0%
]
1.76%
20,50316.5%
[
1.5%
-
2.0%
]
1.88%
78,16315.1%
[
1.5%
-
2.0%
]
1.90%
12,7716.5%
[
2.0%
-
2.5%
]
2.03%
23,5652.1%
[
2.0%
-
2.5%
]
2.14%
16,89615.5%
[
2.0%
-
2.5%
]
2.20%
42,5482.1%
[
2.0%
-
2.5%
]
2.26%
1,59618.6%
[
2.5%
-
3.0%
]
2.93%
4,7163.8%
[
2.5%
-
3.0%
]
2.93%
8,2848.6%
[
3.0%
-
3.5%
]
3.31%
2,6302.6%
[
3.5%
-
4.0%
]
3.77%
24,9908.6%
[
4.0%
-
4.5%
]
4.42%
2,4875.9%
[
4.5%
-
5.0%
]
4.71%
20,93611.7%
[
4.5%
-
5.0%
]
4.99%
19,76213.1%
[
5.5%
-
6.0%
]
5.60%
26,54733.6%
[
5.5%
-
6.0%
]
5.91%
1,3031.9%
[
6.0%
-
6.5%
]
6.02%
25,27818.1%
[
6.5%
-
7.0%
]
6.88%
13,70415.1%
[
7.5%
-
8.0%
]
7.71%
7787.9%
[
7.5%
-
8.0%
]
7.89%
108,41417.6%
[
9.5%
-
10.0%
]
9.90%
1,5462.7%
[
12.0%
-
12.5%
]
12.32%
53,04427.3%
[
13.0%
-
13.5%
]
13.03%
43,21331.2%
[
17.0%
-
17.5%
]
17.25%
27,84230.9%
[
19.0%
-
19.5%
]
19.05%
8,91925.3%
[
21.5%
-
22.0%
]
21.97%
5,52640.5%