Immigrants from Romania Married-Couple Family Poverty
COMPARE
Immigrants from Romania
Select to Compare
Married-Couple Family Poverty
Immigrants from Romania Married-Couple Family Poverty
4.7%
POVERTY | MARRIED-COUPLE FAMILIES
97.3/ 100
METRIC RATING
103rd/ 347
METRIC RANK
Immigrants from Romania Married-Couple Family Poverty Correlation Chart
The statistical analysis conducted on geographies consisting of 255,676,243 people shows a significant positive correlation between the proportion of Immigrants from Romania and poverty level among married-couple families in the United States with a correlation coefficient (R) of 0.632 and weighted average of 4.7%. On average, for every 1% (one percent) increase in Immigrants from Romania within a typical geography, there is an increase of 2.3% in poverty level among married-couple families.
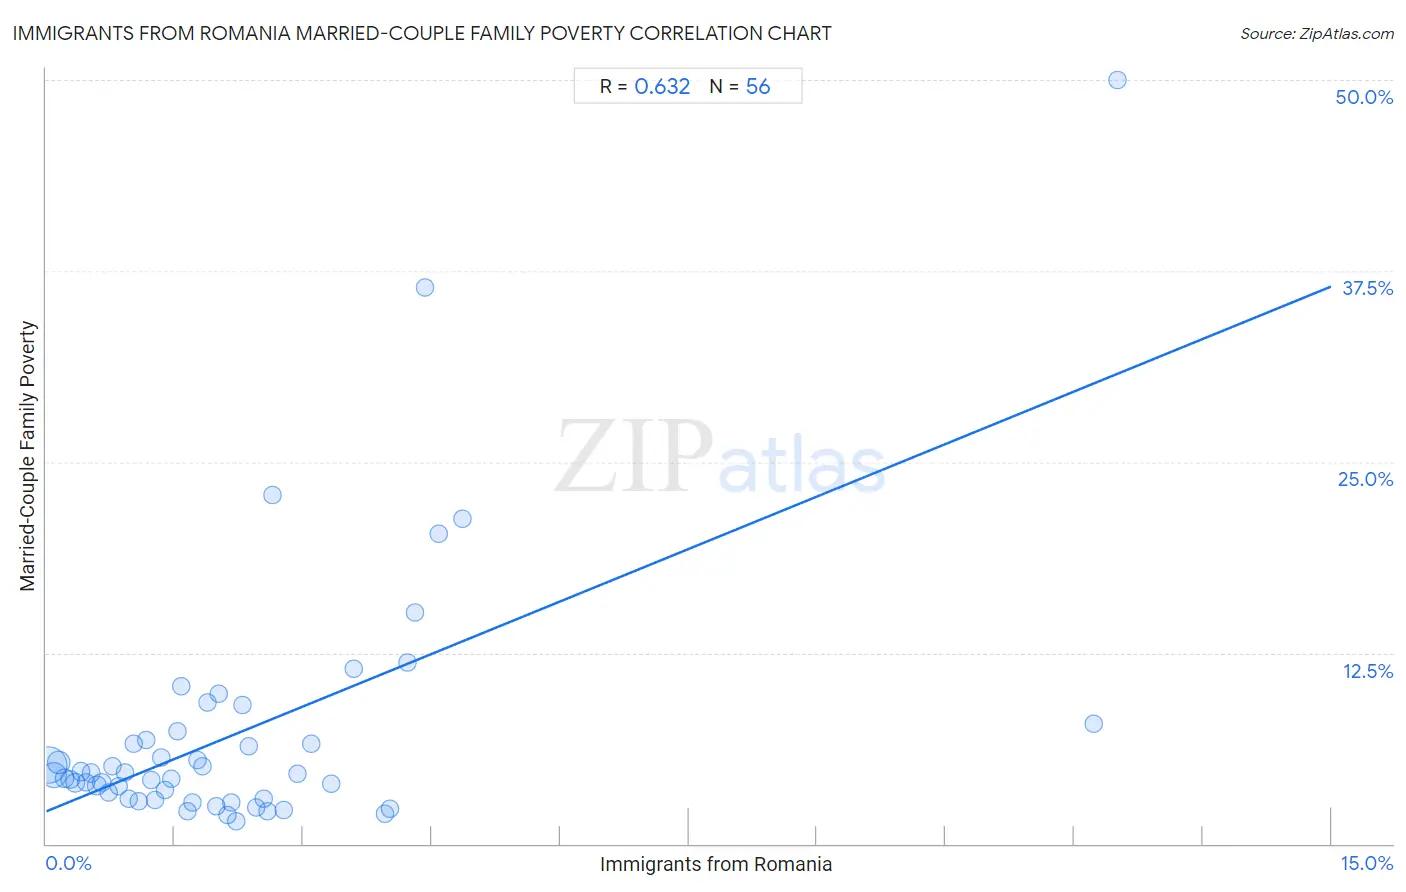
It is essential to understand that the correlation between the percentage of Immigrants from Romania and poverty level among married-couple families does not imply a direct cause-and-effect relationship. It remains uncertain whether the presence of Immigrants from Romania influences an upward or downward trend in the level of poverty level among married-couple families within an area, or if Immigrants from Romania simply ended up residing in those areas with higher or lower levels of poverty level among married-couple families due to other factors.
Demographics Similar to Immigrants from Romania by Married-Couple Family Poverty
In terms of married-couple family poverty, the demographic groups most similar to Immigrants from Romania are Asian (4.7%, a difference of 0.29%), Immigrants from Moldova (4.7%, a difference of 0.34%), Aleut (4.7%, a difference of 0.41%), Immigrants from France (4.7%, a difference of 0.57%), and Immigrants from Germany (4.7%, a difference of 0.58%).
| Demographics | Rating | Rank | Married-Couple Family Poverty |
| Immigrants from Poland | 98.3 /100 | #96 | Exceptional 4.6% |
| Immigrants from Belgium | 98.2 /100 | #97 | Exceptional 4.6% |
| Native Hawaiians | 98.0 /100 | #98 | Exceptional 4.6% |
| Immigrants from Europe | 97.9 /100 | #99 | Exceptional 4.6% |
| Immigrants from Western Europe | 97.9 /100 | #100 | Exceptional 4.6% |
| Yugoslavians | 97.8 /100 | #101 | Exceptional 4.6% |
| Asians | 97.6 /100 | #102 | Exceptional 4.7% |
| Immigrants from Romania | 97.3 /100 | #103 | Exceptional 4.7% |
| Immigrants from Moldova | 97.1 /100 | #104 | Exceptional 4.7% |
| Aleuts | 97.0 /100 | #105 | Exceptional 4.7% |
| Immigrants from France | 96.9 /100 | #106 | Exceptional 4.7% |
| Immigrants from Germany | 96.8 /100 | #107 | Exceptional 4.7% |
| Laotians | 96.6 /100 | #108 | Exceptional 4.7% |
| Immigrants from Hong Kong | 96.4 /100 | #109 | Exceptional 4.7% |
| Immigrants from Bolivia | 96.2 /100 | #110 | Exceptional 4.7% |
Immigrants from Romania Married-Couple Family Poverty Correlation Summary
| Measurement | Immigrants from Romania Data | Married-Couple Family Poverty Data |
| Minimum | 0.030% | 1.5% |
| Maximum | 12.5% | 50.0% |
| Range | 12.5% | 48.5% |
| Mean | 2.3% | 7.3% |
| Median | 1.7% | 4.5% |
| Interquartile 25% (IQ1) | 0.88% | 2.9% |
| Interquartile 75% (IQ3) | 2.7% | 7.1% |
| Interquartile Range (IQR) | 1.8% | 4.2% |
| Standard Deviation (Sample) | 2.3% | 8.5% |
| Standard Deviation (Population) | 2.3% | 8.4% |
Correlation Details
| Immigrants from Romania Percentile | Sample Size | Married-Couple Family Poverty |
[ 0.0% - 0.5% ] 0.030% | 129,686,870 | 5.1% |
[ 0.0% - 0.5% ] 0.089% | 50,647,406 | 4.5% |
[ 0.0% - 0.5% ] 0.15% | 34,968,526 | 5.3% |
[ 0.0% - 0.5% ] 0.21% | 15,030,447 | 4.3% |
[ 0.0% - 0.5% ] 0.28% | 7,116,246 | 4.2% |
[ 0.0% - 0.5% ] 0.34% | 4,991,905 | 4.0% |
[ 0.0% - 0.5% ] 0.40% | 3,541,627 | 4.7% |
[ 0.0% - 0.5% ] 0.46% | 2,180,408 | 4.0% |
[ 0.5% - 1.0% ] 0.52% | 1,739,067 | 4.6% |
[ 0.5% - 1.0% ] 0.59% | 1,443,185 | 3.8% |
[ 0.5% - 1.0% ] 0.65% | 753,931 | 4.0% |
[ 0.5% - 1.0% ] 0.72% | 602,363 | 3.4% |
[ 0.5% - 1.0% ] 0.78% | 670,610 | 5.1% |
[ 0.5% - 1.0% ] 0.85% | 281,979 | 3.8% |
[ 0.5% - 1.0% ] 0.91% | 505,969 | 4.6% |
[ 0.5% - 1.0% ] 0.97% | 232,818 | 2.9% |
[ 1.0% - 1.5% ] 1.02% | 100,826 | 6.6% |
[ 1.0% - 1.5% ] 1.09% | 128,764 | 2.8% |
[ 1.0% - 1.5% ] 1.17% | 77,042 | 6.8% |
[ 1.0% - 1.5% ] 1.23% | 187,064 | 4.2% |
[ 1.0% - 1.5% ] 1.27% | 43,258 | 2.9% |
[ 1.0% - 1.5% ] 1.34% | 179,109 | 5.6% |
[ 1.0% - 1.5% ] 1.39% | 44,652 | 3.5% |
[ 1.0% - 1.5% ] 1.46% | 51,732 | 4.2% |
[ 1.5% - 2.0% ] 1.54% | 31,109 | 7.4% |
[ 1.5% - 2.0% ] 1.58% | 1,897 | 10.3% |
[ 1.5% - 2.0% ] 1.65% | 11,390 | 2.2% |
[ 1.5% - 2.0% ] 1.70% | 6,169 | 2.7% |
[ 1.5% - 2.0% ] 1.76% | 61,494 | 5.4% |
[ 1.5% - 2.0% ] 1.83% | 3,008 | 5.1% |
[ 1.5% - 2.0% ] 1.89% | 93,713 | 9.2% |
[ 1.5% - 2.0% ] 1.98% | 53,989 | 2.4% |
[ 2.0% - 2.5% ] 2.02% | 64,671 | 9.8% |
[ 2.0% - 2.5% ] 2.12% | 2,405 | 1.8% |
[ 2.0% - 2.5% ] 2.15% | 41,134 | 2.7% |
[ 2.0% - 2.5% ] 2.21% | 11,062 | 1.5% |
[ 2.0% - 2.5% ] 2.29% | 523 | 9.1% |
[ 2.0% - 2.5% ] 2.37% | 2,027 | 6.4% |
[ 2.0% - 2.5% ] 2.46% | 27,378 | 2.4% |
[ 2.5% - 3.0% ] 2.53% | 12,150 | 2.9% |
[ 2.5% - 3.0% ] 2.58% | 1,125 | 2.1% |
[ 2.5% - 3.0% ] 2.65% | 1,814 | 22.9% |
[ 2.5% - 3.0% ] 2.77% | 1,048 | 2.2% |
[ 2.5% - 3.0% ] 2.94% | 26,939 | 4.6% |
[ 3.0% - 3.5% ] 3.10% | 1,194 | 6.6% |
[ 3.0% - 3.5% ] 3.32% | 1,807 | 3.9% |
[ 3.5% - 4.0% ] 3.59% | 390 | 11.5% |
[ 3.5% - 4.0% ] 3.95% | 1,899 | 2.0% |
[ 4.0% - 4.5% ] 4.01% | 673 | 2.3% |
[ 4.0% - 4.5% ] 4.21% | 5,555 | 11.9% |
[ 4.0% - 4.5% ] 4.31% | 116 | 15.2% |
[ 4.0% - 4.5% ] 4.42% | 1,153 | 36.4% |
[ 4.5% - 5.0% ] 4.59% | 676 | 20.3% |
[ 4.5% - 5.0% ] 4.86% | 247 | 21.3% |
[ 12.0% - 12.5% ] 12.23% | 1,668 | 7.8% |
[ 12.0% - 12.5% ] 12.50% | 16 | 50.0% |