Kenyan Self-Care Disability
COMPARE
Kenyan
Select to Compare
Self-Care Disability
Kenyan Self-Care Disability
2.3%
SELF-CARE DISABILITY
99.7/ 100
METRIC RATING
51st/ 347
METRIC RANK
Kenyan Self-Care Disability Correlation Chart
The statistical analysis conducted on geographies consisting of 168,082,411 people shows a weak negative correlation between the proportion of Kenyans and percentage of population with self-care disability in the United States with a correlation coefficient (R) of -0.258 and weighted average of 2.3%. On average, for every 1% (one percent) increase in Kenyans within a typical geography, there is a decrease of 0.11% in percentage of population with self-care disability.
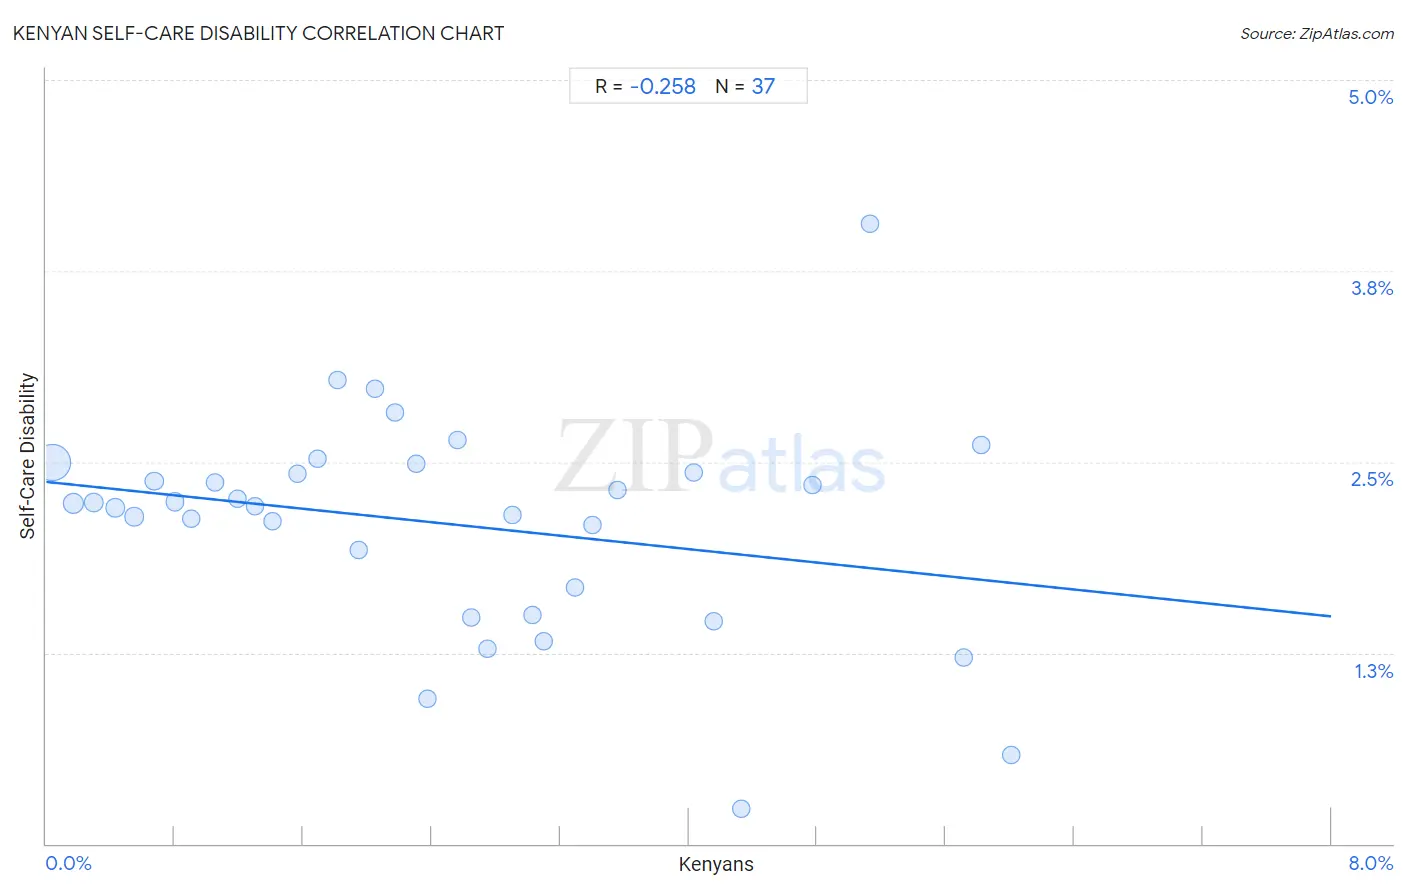
It is essential to understand that the correlation between the percentage of Kenyans and percentage of population with self-care disability does not imply a direct cause-and-effect relationship. It remains uncertain whether the presence of Kenyans influences an upward or downward trend in the level of percentage of population with self-care disability within an area, or if Kenyans simply ended up residing in those areas with higher or lower levels of percentage of population with self-care disability due to other factors.
Demographics Similar to Kenyans by Self-Care Disability
In terms of self-care disability, the demographic groups most similar to Kenyans are Immigrants from Serbia (2.3%, a difference of 0.020%), Australian (2.3%, a difference of 0.060%), Argentinean (2.3%, a difference of 0.10%), Immigrants from Brazil (2.3%, a difference of 0.15%), and Latvian (2.3%, a difference of 0.17%).
| Demographics | Rating | Rank | Self-Care Disability |
| Immigrants from South Africa | 99.8 /100 | #44 | Exceptional 2.3% |
| Norwegians | 99.8 /100 | #45 | Exceptional 2.3% |
| Czechs | 99.8 /100 | #46 | Exceptional 2.3% |
| Jordanians | 99.7 /100 | #47 | Exceptional 2.3% |
| Immigrants from Malaysia | 99.7 /100 | #48 | Exceptional 2.3% |
| Latvians | 99.7 /100 | #49 | Exceptional 2.3% |
| Immigrants from Brazil | 99.7 /100 | #50 | Exceptional 2.3% |
| Kenyans | 99.7 /100 | #51 | Exceptional 2.3% |
| Immigrants from Serbia | 99.6 /100 | #52 | Exceptional 2.3% |
| Australians | 99.6 /100 | #53 | Exceptional 2.3% |
| Argentineans | 99.6 /100 | #54 | Exceptional 2.3% |
| Immigrants from France | 99.6 /100 | #55 | Exceptional 2.3% |
| Immigrants from Eastern Asia | 99.6 /100 | #56 | Exceptional 2.3% |
| Immigrants from Belgium | 99.6 /100 | #57 | Exceptional 2.3% |
| Immigrants from Cameroon | 99.6 /100 | #58 | Exceptional 2.3% |
Kenyan Self-Care Disability Correlation Summary
| Measurement | Kenyan Data | Self-Care Disability Data |
| Minimum | 0.039% | 0.23% |
| Maximum | 6.0% | 4.1% |
| Range | 6.0% | 3.8% |
| Mean | 2.5% | 2.1% |
| Median | 2.3% | 2.2% |
| Interquartile 25% (IQ1) | 1.1% | 1.6% |
| Interquartile 75% (IQ3) | 3.5% | 2.5% |
| Interquartile Range (IQR) | 2.4% | 0.87% |
| Standard Deviation (Sample) | 1.7% | 0.71% |
| Standard Deviation (Population) | 1.6% | 0.70% |
Correlation Details
| Kenyan Percentile | Sample Size | Self-Care Disability |
[ 0.0% - 0.5% ] 0.039% | 126,504,359 | 2.5% |
[ 0.0% - 0.5% ] 0.17% | 21,766,069 | 2.2% |
[ 0.0% - 0.5% ] 0.30% | 8,410,539 | 2.2% |
[ 0.0% - 0.5% ] 0.43% | 4,704,998 | 2.2% |
[ 0.5% - 1.0% ] 0.55% | 2,134,155 | 2.1% |
[ 0.5% - 1.0% ] 0.67% | 1,166,959 | 2.4% |
[ 0.5% - 1.0% ] 0.80% | 967,148 | 2.2% |
[ 0.5% - 1.0% ] 0.90% | 443,919 | 2.1% |
[ 1.0% - 1.5% ] 1.05% | 433,161 | 2.4% |
[ 1.0% - 1.5% ] 1.19% | 327,740 | 2.3% |
[ 1.0% - 1.5% ] 1.30% | 231,594 | 2.2% |
[ 1.0% - 1.5% ] 1.41% | 210,333 | 2.1% |
[ 1.5% - 2.0% ] 1.56% | 192,252 | 2.4% |
[ 1.5% - 2.0% ] 1.69% | 100,838 | 2.5% |
[ 1.5% - 2.0% ] 1.82% | 29,829 | 3.0% |
[ 1.5% - 2.0% ] 1.95% | 131,069 | 1.9% |
[ 2.0% - 2.5% ] 2.05% | 69,612 | 3.0% |
[ 2.0% - 2.5% ] 2.17% | 85,059 | 2.8% |
[ 2.0% - 2.5% ] 2.31% | 51,639 | 2.5% |
[ 2.0% - 2.5% ] 2.38% | 6,863 | 0.95% |
[ 2.5% - 3.0% ] 2.56% | 586 | 2.6% |
[ 2.5% - 3.0% ] 2.65% | 32,186 | 1.5% |
[ 2.5% - 3.0% ] 2.75% | 8,230 | 1.3% |
[ 2.5% - 3.0% ] 2.90% | 3,966 | 2.1% |
[ 3.0% - 3.5% ] 3.03% | 14,756 | 1.5% |
[ 3.0% - 3.5% ] 3.10% | 8,389 | 1.3% |
[ 3.0% - 3.5% ] 3.29% | 2,034 | 1.7% |
[ 3.0% - 3.5% ] 3.40% | 2,764 | 2.1% |
[ 3.5% - 4.0% ] 3.56% | 2,473 | 2.3% |
[ 4.0% - 4.5% ] 4.03% | 4,144 | 2.4% |
[ 4.0% - 4.5% ] 4.15% | 9,822 | 1.5% |
[ 4.0% - 4.5% ] 4.32% | 2,474 | 0.23% |
[ 4.5% - 5.0% ] 4.77% | 9,332 | 2.4% |
[ 5.0% - 5.5% ] 5.13% | 4,995 | 4.1% |
[ 5.5% - 6.0% ] 5.71% | 4,728 | 1.2% |
[ 5.5% - 6.0% ] 5.82% | 3,214 | 2.6% |
[ 6.0% - 6.5% ] 6.01% | 183 | 0.58% |