Indonesian Married-Couple Family Poverty
COMPARE
Indonesian
Select to Compare
Married-Couple Family Poverty
Indonesian Married-Couple Family Poverty
6.3%
POVERTY | MARRIED-COUPLE FAMILIES
0.1/ 100
METRIC RATING
277th/ 347
METRIC RANK
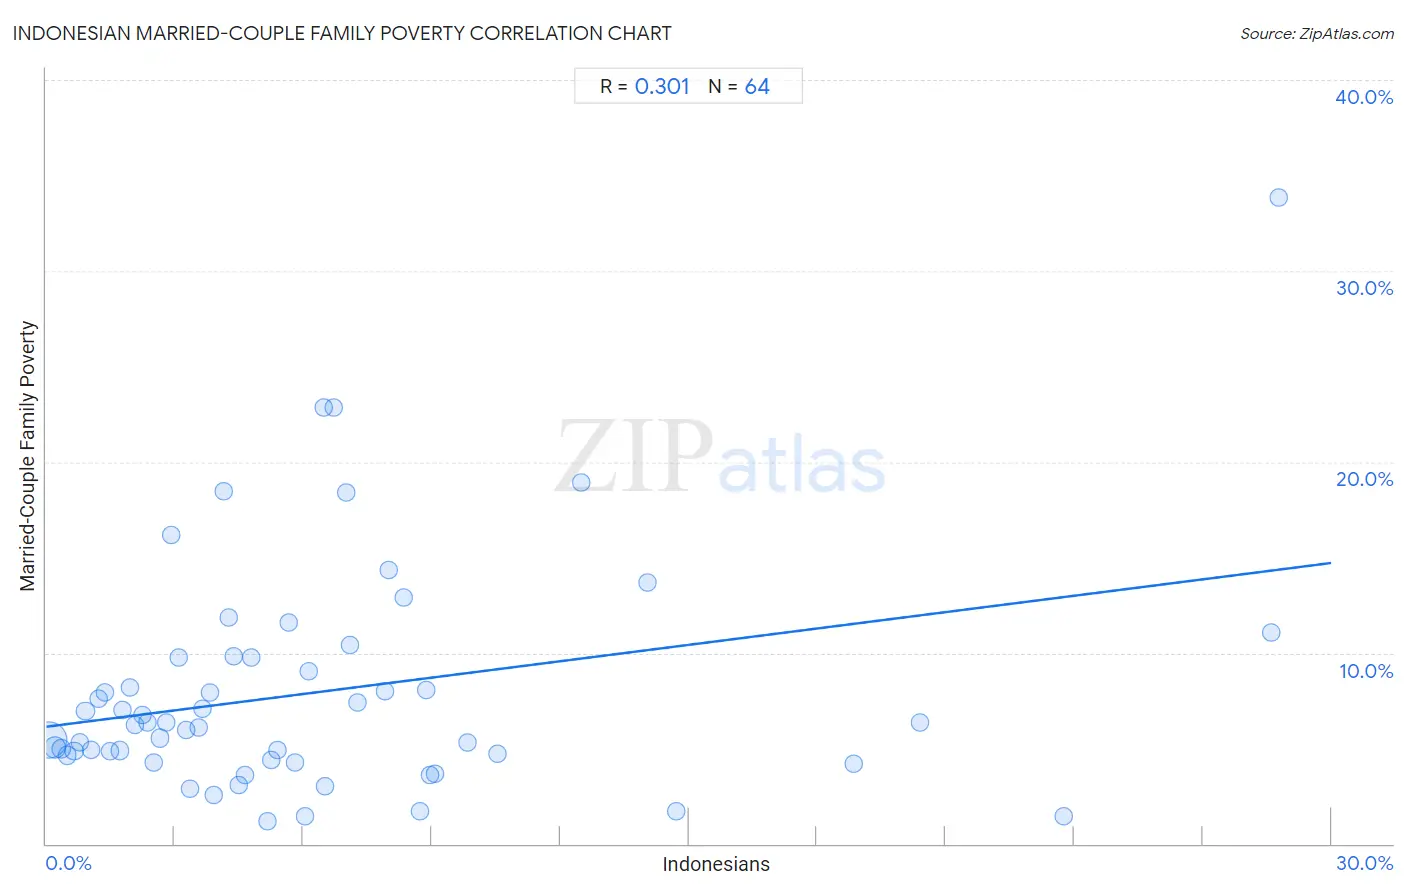
Indonesian Married-Couple Family Poverty Correlation Chart
The statistical analysis conducted on geographies consisting of 162,334,988 people shows a mild positive correlation between the proportion of Indonesians and poverty level among married-couple families in the United States with a correlation coefficient (R) of 0.301 and weighted average of 6.3%. On average, for every 1% (one percent) increase in Indonesians within a typical geography, there is an increase of 0.29% in poverty level among married-couple families.
It is essential to understand that the correlation between the percentage of Indonesians and poverty level among married-couple families does not imply a direct cause-and-effect relationship. It remains uncertain whether the presence of Indonesians influences an upward or downward trend in the level of poverty level among married-couple families within an area, or if Indonesians simply ended up residing in those areas with higher or lower levels of poverty level among married-couple families due to other factors.
Demographics Similar to Indonesians by Married-Couple Family Poverty
In terms of married-couple family poverty, the demographic groups most similar to Indonesians are Yaqui (6.3%, a difference of 0.14%), Immigrants from Trinidad and Tobago (6.4%, a difference of 0.48%), Choctaw (6.3%, a difference of 0.59%), Houma (6.4%, a difference of 0.73%), and Barbadian (6.3%, a difference of 0.75%).
| Demographics | Rating | Rank | Married-Couple Family Poverty |
| Immigrants from Jamaica | 0.1 /100 | #270 | Tragic 6.2% |
| Immigrants from Bahamas | 0.1 /100 | #271 | Tragic 6.2% |
| Trinidadians and Tobagonians | 0.1 /100 | #272 | Tragic 6.2% |
| Colville | 0.1 /100 | #273 | Tragic 6.3% |
| Barbadians | 0.1 /100 | #274 | Tragic 6.3% |
| Choctaw | 0.1 /100 | #275 | Tragic 6.3% |
| Yaqui | 0.1 /100 | #276 | Tragic 6.3% |
| Indonesians | 0.1 /100 | #277 | Tragic 6.3% |
| Immigrants from Trinidad and Tobago | 0.1 /100 | #278 | Tragic 6.4% |
| Houma | 0.0 /100 | #279 | Tragic 6.4% |
| West Indians | 0.0 /100 | #280 | Tragic 6.4% |
| Mexican American Indians | 0.0 /100 | #281 | Tragic 6.4% |
| Seminole | 0.0 /100 | #282 | Tragic 6.4% |
| Ute | 0.0 /100 | #283 | Tragic 6.4% |
| Dutch West Indians | 0.0 /100 | #284 | Tragic 6.4% |
Indonesian Married-Couple Family Poverty Correlation Summary
| Measurement | Indonesian Data | Married-Couple Family Poverty Data |
| Minimum | 0.052% | 1.2% |
| Maximum | 28.8% | 33.8% |
| Range | 28.7% | 32.6% |
| Mean | 6.3% | 7.9% |
| Median | 4.6% | 6.3% |
| Interquartile 25% (IQ1) | 2.3% | 4.5% |
| Interquartile 75% (IQ3) | 8.0% | 9.8% |
| Interquartile Range (IQR) | 5.6% | 5.2% |
| Standard Deviation (Sample) | 6.3% | 6.0% |
| Standard Deviation (Population) | 6.2% | 5.9% |
Correlation Details
| Indonesian Percentile | Sample Size | Married-Couple Family Poverty |
[ 0.0% - 0.5% ] 0.052% | 112,307,569 | 5.5% |
[ 0.0% - 0.5% ] 0.20% | 22,994,057 | 5.1% |
[ 0.0% - 0.5% ] 0.35% | 7,687,473 | 5.0% |
[ 0.0% - 0.5% ] 0.49% | 3,574,424 | 4.6% |
[ 0.5% - 1.0% ] 0.65% | 2,597,840 | 4.8% |
[ 0.5% - 1.0% ] 0.79% | 2,004,488 | 5.3% |
[ 0.5% - 1.0% ] 0.92% | 2,195,819 | 6.9% |
[ 1.0% - 1.5% ] 1.06% | 1,345,214 | 4.9% |
[ 1.0% - 1.5% ] 1.23% | 604,453 | 7.6% |
[ 1.0% - 1.5% ] 1.38% | 1,126,154 | 7.9% |
[ 1.0% - 1.5% ] 1.48% | 511,682 | 4.9% |
[ 1.5% - 2.0% ] 1.71% | 1,143,835 | 4.9% |
[ 1.5% - 2.0% ] 1.79% | 335,478 | 7.0% |
[ 1.5% - 2.0% ] 1.95% | 587,847 | 8.2% |
[ 2.0% - 2.5% ] 2.09% | 252,350 | 6.2% |
[ 2.0% - 2.5% ] 2.24% | 202,451 | 6.8% |
[ 2.0% - 2.5% ] 2.37% | 174,730 | 6.4% |
[ 2.5% - 3.0% ] 2.51% | 107,823 | 4.2% |
[ 2.5% - 3.0% ] 2.66% | 335,856 | 5.5% |
[ 2.5% - 3.0% ] 2.79% | 88,669 | 6.3% |
[ 2.5% - 3.0% ] 2.92% | 27,709 | 16.2% |
[ 3.0% - 3.5% ] 3.09% | 100,868 | 9.7% |
[ 3.0% - 3.5% ] 3.27% | 636,516 | 6.0% |
[ 3.0% - 3.5% ] 3.34% | 46,923 | 2.9% |
[ 3.5% - 4.0% ] 3.55% | 80,356 | 6.1% |
[ 3.5% - 4.0% ] 3.66% | 124,609 | 7.1% |
[ 3.5% - 4.0% ] 3.82% | 74,686 | 7.9% |
[ 3.5% - 4.0% ] 3.91% | 32,995 | 2.5% |
[ 4.0% - 4.5% ] 4.14% | 41,235 | 18.5% |
[ 4.0% - 4.5% ] 4.25% | 72,385 | 11.8% |
[ 4.0% - 4.5% ] 4.38% | 87,012 | 9.8% |
[ 4.0% - 4.5% ] 4.50% | 36,532 | 3.1% |
[ 4.5% - 5.0% ] 4.64% | 25,872 | 3.6% |
[ 4.5% - 5.0% ] 4.79% | 47,355 | 9.8% |
[ 5.0% - 5.5% ] 5.17% | 2,321 | 1.2% |
[ 5.0% - 5.5% ] 5.25% | 52,384 | 4.4% |
[ 5.0% - 5.5% ] 5.40% | 32,443 | 4.9% |
[ 5.5% - 6.0% ] 5.66% | 125,697 | 11.6% |
[ 5.5% - 6.0% ] 5.82% | 50,035 | 4.2% |
[ 6.0% - 6.5% ] 6.03% | 879 | 1.4% |
[ 6.0% - 6.5% ] 6.14% | 79,880 | 9.1% |
[ 6.0% - 6.5% ] 6.47% | 14,553 | 22.9% |
[ 6.0% - 6.5% ] 6.50% | 15,899 | 3.0% |
[ 6.5% - 7.0% ] 6.70% | 26,684 | 22.9% |
[ 6.5% - 7.0% ] 6.99% | 25,699 | 18.4% |
[ 7.0% - 7.5% ] 7.11% | 23,980 | 10.4% |
[ 7.0% - 7.5% ] 7.28% | 19,447 | 7.4% |
[ 7.5% - 8.0% ] 7.91% | 139 | 8.0% |
[ 7.5% - 8.0% ] 8.00% | 40,152 | 14.3% |
[ 8.0% - 8.5% ] 8.35% | 24,684 | 12.9% |
[ 8.5% - 9.0% ] 8.71% | 1,377 | 1.7% |
[ 8.5% - 9.0% ] 8.87% | 2,029 | 8.0% |
[ 8.5% - 9.0% ] 8.97% | 3,055 | 3.6% |
[ 9.0% - 9.5% ] 9.08% | 3,019 | 3.7% |
[ 9.5% - 10.0% ] 9.84% | 37,834 | 5.3% |
[ 10.5% - 11.0% ] 10.54% | 56,794 | 4.7% |
[ 12.0% - 12.5% ] 12.48% | 19,701 | 18.9% |
[ 14.0% - 14.5% ] 14.02% | 19,501 | 13.7% |
[ 14.5% - 15.0% ] 14.70% | 39,082 | 1.7% |
[ 18.5% - 19.0% ] 18.85% | 191 | 4.2% |
[ 20.0% - 20.5% ] 20.39% | 1,035 | 6.3% |
[ 23.5% - 24.0% ] 23.75% | 2,088 | 1.4% |
[ 28.5% - 29.0% ] 28.59% | 738 | 11.0% |
[ 28.5% - 29.0% ] 28.78% | 403 | 33.8% |