Immigrants from West Indies Married-Couple Family Poverty

COMPARE

Immigrants from West Indies
Race
Ancestry
AfghanAfricanAlaska NativeAlaskan AthabascanAlbanianAleutAlsatianAmericanApacheArabArapahoArgentineanArmenianAssyrian/Chaldean/SyriacAustralianAustrianBahamianBangladeshiBarbadianBasqueBelgianBelizeanBermudanBhutaneseBlackfeetBolivianBrazilianBritishBritish West IndianBulgarianBurmeseCajunCambodianCanadianCape VerdeanCarpatho RusynCelticCentral AmericanCentral American IndianCherokeeCheyenneChickasawChileanChineseChippewaChoctawColombianColvilleComancheCosta RicanCreeCreekCroatianCrowCubanCypriotCzechCzechoslovakianDanishDelawareDominicanDutchDutch West IndianEastern EuropeanEcuadorianEgyptianEnglishEstonianEthiopianEuropeanFijianFilipinoFinnishFrenchFrench American IndianFrench CanadianGermanGerman RussianGhanaianGreekGuamanian/ChamorroGuatemalanGuyaneseHaitianHmongHonduranHopiHoumaHungarianIcelanderIndian (Asian)IndonesianInupiatIranianIraqiIrishIroquoisIsraeliItalianJamaicanJapaneseJordanianKenyanKiowaKoreanLaotianLatvianLebaneseLiberianLithuanianLumbeeLuxembourgerMacedonianMalaysianMalteseMarshalleseMenomineeMexicanMexican American IndianMongolianMoroccanNative HawaiianNavajoNepaleseNew ZealanderNicaraguanNigerianNorthern EuropeanNorwegianOkinawanOsageOttawaPaiutePakistaniPalestinianPanamanianParaguayanPennsylvania GermanPeruvianPimaPolishPortuguesePotawatomiPuebloPuerto RicanPuget Sound SalishRomanianRussianSalvadoranSamoanScandinavianScotch-IrishScottishSeminoleSenegaleseSerbianShoshoneSierra LeoneanSiouxSlavicSlovakSloveneSomaliSouth AfricanSouth AmericanSouth American IndianSoviet UnionSpaniardSpanishSpanish AmericanSpanish American IndianSri LankanSubsaharan AfricanSudaneseSwedishSwissSyrianTaiwaneseThaiTlingit-HaidaTohono O'OdhamTonganTrinidadian and TobagonianTsimshianTurkishU.S. Virgin IslanderUgandanUkrainianUruguayanUteVenezuelanVietnameseWelshWest IndianYakamaYaquiYugoslavianYumanYup'ikZimbabwean
Immigration
NonimmigrantsImmigrantsAfghanistanAfricaAlbaniaArgentinaArmeniaAsiaAustraliaAustriaBahamasBangladeshBarbadosBelarusBelgiumBelizeBoliviaBosnia and HerzegovinaBrazilBulgariaBurma/MyanmarCabo VerdeCambodiaCameroonCanadaCaribbeanCentral AmericaChileChinaColombiaCongoCosta RicaCroatiaCubaCzechoslovakiaDenmarkDominicaDominican RepublicEastern AfricaEastern AsiaEastern EuropeEcuadorEgyptEl SalvadorEnglandEritreaEthiopiaEuropeFijiFranceGermanyGhanaGreeceGrenadaGuatemalaGuyanaHaitiHondurasHong KongHungaryIndiaIndonesiaIranIraqIrelandIsraelItalyJamaicaJapanJordanKazakhstanKenyaKoreaKuwaitLaosLatin AmericaLatviaLebanonLiberiaLithuaniaMalaysiaMexicoMicronesiaMiddle AfricaMoldovaMoroccoNepalNetherlandsNicaraguaNigeriaNorth AmericaNorth MacedoniaNorthern AfricaNorthern EuropeNorwayOceaniaPakistanPanamaPeruPhilippinesPolandPortugalRomaniaRussiaSaudi ArabiaScotlandSenegalSerbiaSierra LeoneSingaporeSomaliaSouth AfricaSouth AmericaSouth Central AsiaSouth Eastern AsiaSouthern EuropeSpainSri LankaSt. Vincent and the GrenadinesSudanSwedenSwitzerlandSyriaTaiwanThailandTrinidad and TobagoTurkeyUgandaUkraineUruguayUzbekistanVenezuelaVietnamWest IndiesWestern AfricaWestern AsiaWestern EuropeYemenZaireZimbabweAzores
Select to Compare
Race
Ancestry
AfghanAfricanAlaska NativeAlaskan AthabascanAlbanianAleutAlsatianAmericanApacheArabArapahoArgentineanArmenianAssyrian/Chaldean/SyriacAustralianAustrianBahamianBangladeshiBarbadianBasqueBelgianBelizeanBermudanBhutaneseBlackfeetBolivianBrazilianBritishBritish West IndianBulgarianBurmeseCajunCambodianCanadianCape VerdeanCarpatho RusynCelticCentral AmericanCentral American IndianCherokeeCheyenneChickasawChileanChineseChippewaChoctawColombianColvilleComancheCosta RicanCreeCreekCroatianCrowCubanCypriotCzechCzechoslovakianDanishDelawareDominicanDutchDutch West IndianEastern EuropeanEcuadorianEgyptianEnglishEstonianEthiopianEuropeanFijianFilipinoFinnishFrenchFrench American IndianFrench CanadianGermanGerman RussianGhanaianGreekGuamanian/ChamorroGuatemalanGuyaneseHaitianHmongHonduranHopiHoumaHungarianIcelanderIndian (Asian)IndonesianInupiatIranianIraqiIrishIroquoisIsraeliItalianJamaicanJapaneseJordanianKenyanKiowaKoreanLaotianLatvianLebaneseLiberianLithuanianLumbeeLuxembourgerMacedonianMalaysianMalteseMarshalleseMenomineeMexicanMexican American IndianMongolianMoroccanNative HawaiianNavajoNepaleseNew ZealanderNicaraguanNigerianNorthern EuropeanNorwegianOkinawanOsageOttawaPaiutePakistaniPalestinianPanamanianParaguayanPennsylvania GermanPeruvianPimaPolishPortuguesePotawatomiPuebloPuerto RicanPuget Sound SalishRomanianRussianSalvadoranSamoanScandinavianScotch-IrishScottishSeminoleSenegaleseSerbianShoshoneSierra LeoneanSiouxSlavicSlovakSloveneSomaliSouth AfricanSouth AmericanSouth American IndianSoviet UnionSpaniardSpanishSpanish AmericanSpanish American IndianSri LankanSubsaharan AfricanSudaneseSwedishSwissSyrianTaiwaneseThaiTlingit-HaidaTohono O'OdhamTonganTrinidadian and TobagonianTsimshianTurkishU.S. Virgin IslanderUgandanUkrainianUruguayanUteVenezuelanVietnameseWelshWest IndianYakamaYaquiYugoslavianYumanYup'ikZimbabwean
Immigration
NonimmigrantsImmigrantsAfghanistanAfricaAlbaniaArgentinaArmeniaAsiaAustraliaAustriaBahamasBangladeshBarbadosBelarusBelgiumBelizeBoliviaBosnia and HerzegovinaBrazilBulgariaBurma/MyanmarCabo VerdeCambodiaCameroonCanadaCaribbeanCentral AmericaChileChinaColombiaCongoCosta RicaCroatiaCubaCzechoslovakiaDenmarkDominicaDominican RepublicEastern AfricaEastern AsiaEastern EuropeEcuadorEgyptEl SalvadorEnglandEritreaEthiopiaEuropeFijiFranceGermanyGhanaGreeceGrenadaGuatemalaGuyanaHaitiHondurasHong KongHungaryIndiaIndonesiaIranIraqIrelandIsraelItalyJamaicaJapanJordanKazakhstanKenyaKoreaKuwaitLaosLatin AmericaLatviaLebanonLiberiaLithuaniaMalaysiaMexicoMicronesiaMiddle AfricaMoldovaMoroccoNepalNetherlandsNicaraguaNigeriaNorth AmericaNorth MacedoniaNorthern AfricaNorthern EuropeNorwayOceaniaPakistanPanamaPeruPhilippinesPolandPortugalRomaniaRussiaSaudi ArabiaScotlandSenegalSerbiaSierra LeoneSingaporeSomaliaSouth AfricaSouth AmericaSouth Central AsiaSouth Eastern AsiaSouthern EuropeSpainSri LankaSt. Vincent and the GrenadinesSudanSwedenSwitzerlandSyriaTaiwanThailandTrinidad and TobagoTurkeyUgandaUkraineUruguayUzbekistanVenezuelaVietnamWestern AfricaWestern AsiaWestern EuropeYemenZaireZimbabweAzores
Married-Couple Family Poverty
Income
Poverty
Unemployment
Labor Participation
Family Structure
Vehicle Availability
Education Level
Disability

Immigrants from West Indies Married-Couple Family Poverty
Tragic

6.2%
POVERTY | MARRIED-COUPLE FAMILIES
0.1/ 100
METRIC RATING
269th/ 347
METRIC RANK

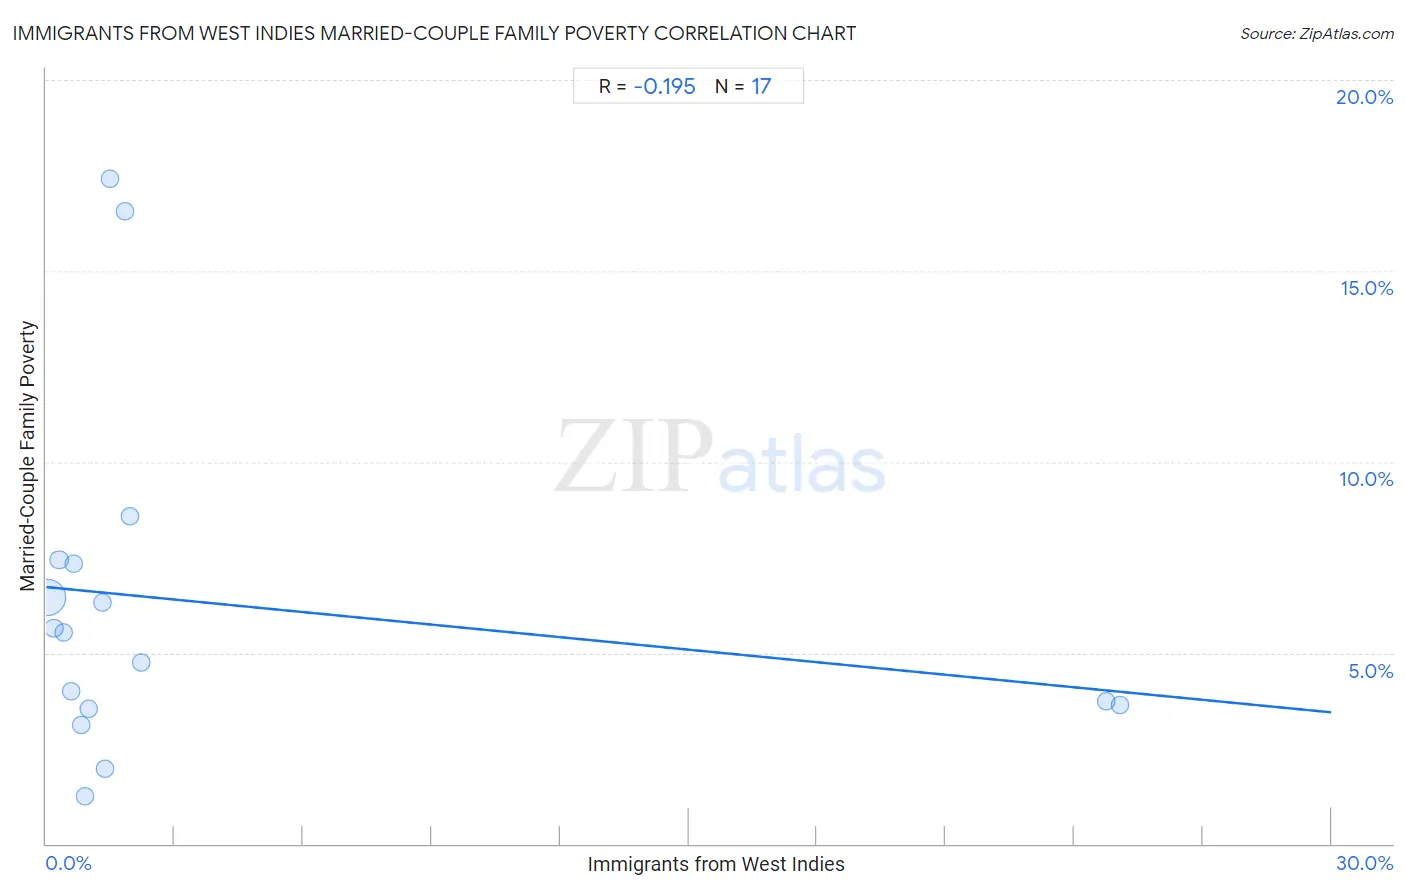
Immigrants from West Indies Married-Couple Family Poverty Correlation Chart

The statistical analysis conducted on geographies consisting of 72,419,228 people shows a poor negative correlation between the proportion of Immigrants from West Indies and poverty level among married-couple families in the United States with a correlation coefficient (R) of -0.195 and weighted average of 6.2%. On average, for every 1% (one percent) increase in Immigrants from West Indies within a typical geography, there is a decrease of 0.11% in poverty level among married-couple families.
Immigrants from West Indies Married-Couple Family Poverty
It is essential to understand that the correlation between the percentage of Immigrants from West Indies and poverty level among married-couple families does not imply a direct cause-and-effect relationship. It remains uncertain whether the presence of Immigrants from West Indies influences an upward or downward trend in the level of poverty level among married-couple families within an area, or if Immigrants from West Indies simply ended up residing in those areas with higher or lower levels of poverty level among married-couple families due to other factors.

Demographics Similar to Immigrants from West Indies by Married-Couple Family Poverty

In terms of married-couple family poverty, the demographic groups most similar to Immigrants from West Indies are Immigrants from Jamaica (6.2%, a difference of 0.040%), Alaska Native (6.2%, a difference of 0.17%), Immigrants from Bahamas (6.2%, a difference of 0.26%), Trinidadian and Tobagonian (6.2%, a difference of 0.29%), and Spanish American (6.2%, a difference of 0.65%).
DemographicsRating | RankMarried-Couple Family Poverty
Shoshone
0.3
/100
|
#262
Tragic
6.1%
Immigrants from Senegal
0.3
/100
|
#263
Tragic
6.1%
Immigrants from Congo
0.2
/100
|
#264
Tragic
6.1%
Blackfeet
0.2
/100
|
#265
Tragic
6.2%
Creek
0.2
/100
|
#266
Tragic
6.2%
Spanish Americans
0.2
/100
|
#267
Tragic
6.2%
Alaska Natives
0.2
/100
|
#268
Tragic
6.2%
Immigrants from West Indies
0.1
/100
|
#269
Tragic
6.2%
Immigrants from Jamaica
0.1
/100
|
#270
Tragic
6.2%
Immigrants from Bahamas
0.1
/100
|
#271
Tragic
6.2%
Trinidadians and Tobagonians
0.1
/100
|
#272
Tragic
6.2%
Colville
0.1
/100
|
#273
Tragic
6.3%
Barbadians
0.1
/100
|
#274
Tragic
6.3%
Choctaw
0.1
/100
|
#275
Tragic
6.3%
Yaqui
0.1
/100
|
#276
Tragic
6.3%

Immigrants from West Indies Married-Couple Family Poverty Correlation Summary

MeasurementImmigrants from West Indies DataMarried-Couple Family Poverty Data
Minimum0.030%1.2%
Maximum25.1%17.4%
Range25.0%16.2%
Mean3.8%6.3%
Median0.99%5.5%
Interquartile 25% (IQ1)0.50%3.6%
Interquartile 75% (IQ3)1.9%7.4%
Interquartile Range (IQR)1.4%3.8%
Standard Deviation (Sample)8.0%4.5%
Standard Deviation (Population)7.7%4.3%

Correlation Details

Immigrants from West Indies PercentileSample SizeMarried-Couple Family Poverty
[
0.0%
-
0.5%
]
0.030%
66,225,9916.5%
[
0.0%
-
0.5%
]
0.17%
3,558,5215.6%
[
0.0%
-
0.5%
]
0.30%
1,425,0277.4%
[
0.0%
-
0.5%
]
0.42%
547,8805.5%
[
0.5%
-
1.0%
]
0.59%
332,4254.0%
[
0.5%
-
1.0%
]
0.64%
116,2887.3%
[
0.5%
-
1.0%
]
0.82%
8,0953.1%
[
0.5%
-
1.0%
]
0.91%
37,0371.2%
[
0.5%
-
1.0%
]
0.99%
20,0783.5%
[
1.0%
-
1.5%
]
1.31%
104,5076.3%
[
1.0%
-
1.5%
]
1.38%
10,3352.0%
[
1.0%
-
1.5%
]
1.50%
16,80817.4%
[
1.5%
-
2.0%
]
1.84%
2,17216.6%
[
1.5%
-
2.0%
]
1.95%
9,9838.6%
[
2.0%
-
2.5%
]
2.23%
5394.8%
[
24.5%
-
25.0%
]
24.75%
1,7823.7%
[
25.0%
-
25.5%
]
25.06%
1,7603.6%