Kenyan vs Immigrants from Dominica Married-Couple Family Poverty

COMPARE

Kenyan
Race
Ancestry
AfghanAfricanAlaska NativeAlaskan AthabascanAlbanianAleutAlsatianAmericanApacheArabArapahoArgentineanArmenianAssyrian/Chaldean/SyriacAustralianAustrianBahamianBangladeshiBarbadianBasqueBelgianBelizeanBermudanBhutaneseBlackfeetBolivianBrazilianBritishBritish West IndianBulgarianBurmeseCajunCambodianCanadianCape VerdeanCarpatho RusynCelticCentral AmericanCentral American IndianCherokeeCheyenneChickasawChileanChineseChippewaChoctawColombianColvilleComancheCosta RicanCreeCreekCroatianCrowCubanCypriotCzechCzechoslovakianDanishDelawareDominicanDutchDutch West IndianEastern EuropeanEcuadorianEgyptianEnglishEstonianEthiopianEuropeanFijianFilipinoFinnishFrenchFrench American IndianFrench CanadianGermanGerman RussianGhanaianGreekGuamanian/ChamorroGuatemalanGuyaneseHaitianHmongHonduranHopiHoumaHungarianIcelanderIndian (Asian)IndonesianInupiatIranianIraqiIrishIroquoisIsraeliItalianJamaicanJapaneseJordanianKenyanKiowaKoreanLaotianLatvianLebaneseLiberianLithuanianLumbeeLuxembourgerMacedonianMalaysianMalteseMarshalleseMenomineeMexicanMexican American IndianMongolianMoroccanNative HawaiianNavajoNepaleseNew ZealanderNicaraguanNigerianNorthern EuropeanNorwegianOkinawanOsageOttawaPaiutePakistaniPalestinianPanamanianParaguayanPennsylvania GermanPeruvianPimaPolishPortuguesePotawatomiPuebloPuerto RicanPuget Sound SalishRomanianRussianSalvadoranSamoanScandinavianScotch-IrishScottishSeminoleSenegaleseSerbianShoshoneSierra LeoneanSiouxSlavicSlovakSloveneSomaliSouth AfricanSouth AmericanSouth American IndianSoviet UnionSpaniardSpanishSpanish AmericanSpanish American IndianSri LankanSubsaharan AfricanSudaneseSwedishSwissSyrianTaiwaneseThaiTlingit-HaidaTohono O'OdhamTonganTrinidadian and TobagonianTsimshianTurkishU.S. Virgin IslanderUgandanUkrainianUruguayanUteVenezuelanVietnameseWelshWest IndianYakamaYaquiYugoslavianYumanYup'ikZimbabwean
Immigration
NonimmigrantsImmigrantsAfghanistanAfricaAlbaniaArgentinaArmeniaAsiaAustraliaAustriaBahamasBangladeshBarbadosBelarusBelgiumBelizeBoliviaBosnia and HerzegovinaBrazilBulgariaBurma/MyanmarCabo VerdeCambodiaCameroonCanadaCaribbeanCentral AmericaChileChinaColombiaCongoCosta RicaCroatiaCubaCzechoslovakiaDenmarkDominican RepublicEastern AfricaEastern AsiaEastern EuropeEcuadorEgyptEl SalvadorEnglandEritreaEthiopiaEuropeFijiFranceGermanyGhanaGreeceGrenadaGuatemalaGuyanaHaitiHondurasHong KongHungaryIndiaIndonesiaIranIraqIrelandIsraelItalyJamaicaJapanJordanKazakhstanKenyaKoreaKuwaitLaosLatin AmericaLatviaLebanonLiberiaLithuaniaMalaysiaMexicoMicronesiaMiddle AfricaMoldovaMoroccoNepalNetherlandsNicaraguaNigeriaNorth AmericaNorth MacedoniaNorthern AfricaNorthern EuropeNorwayOceaniaPakistanPanamaPeruPhilippinesPolandPortugalRomaniaRussiaSaudi ArabiaScotlandSenegalSerbiaSierra LeoneSingaporeSomaliaSouth AfricaSouth AmericaSouth Central AsiaSouth Eastern AsiaSouthern EuropeSpainSri LankaSt. Vincent and the GrenadinesSudanSwedenSwitzerlandSyriaTaiwanThailandTrinidad and TobagoTurkeyUgandaUkraineUruguayUzbekistanVenezuelaVietnamWest IndiesWestern AfricaWestern AsiaWestern EuropeYemenZaireZimbabweAzores
Immigrants from Dominica
Race
Ancestry
AfghanAfricanAlaska NativeAlaskan AthabascanAlbanianAleutAlsatianAmericanApacheArabArapahoArgentineanArmenianAssyrian/Chaldean/SyriacAustralianAustrianBahamianBangladeshiBarbadianBasqueBelgianBelizeanBermudanBhutaneseBlackfeetBolivianBrazilianBritishBritish West IndianBulgarianBurmeseCajunCambodianCanadianCape VerdeanCarpatho RusynCelticCentral AmericanCentral American IndianCherokeeCheyenneChickasawChileanChineseChippewaChoctawColombianColvilleComancheCosta RicanCreeCreekCroatianCrowCubanCypriotCzechCzechoslovakianDanishDelawareDominicanDutchDutch West IndianEastern EuropeanEcuadorianEgyptianEnglishEstonianEthiopianEuropeanFijianFilipinoFinnishFrenchFrench American IndianFrench CanadianGermanGerman RussianGhanaianGreekGuamanian/ChamorroGuatemalanGuyaneseHaitianHmongHonduranHopiHoumaHungarianIcelanderIndian (Asian)IndonesianInupiatIranianIraqiIrishIroquoisIsraeliItalianJamaicanJapaneseJordanianKiowaKoreanLaotianLatvianLebaneseLiberianLithuanianLumbeeLuxembourgerMacedonianMalaysianMalteseMarshalleseMenomineeMexicanMexican American IndianMongolianMoroccanNative HawaiianNavajoNepaleseNew ZealanderNicaraguanNigerianNorthern EuropeanNorwegianOkinawanOsageOttawaPaiutePakistaniPalestinianPanamanianParaguayanPennsylvania GermanPeruvianPimaPolishPortuguesePotawatomiPuebloPuerto RicanPuget Sound SalishRomanianRussianSalvadoranSamoanScandinavianScotch-IrishScottishSeminoleSenegaleseSerbianShoshoneSierra LeoneanSiouxSlavicSlovakSloveneSomaliSouth AfricanSouth AmericanSouth American IndianSoviet UnionSpaniardSpanishSpanish AmericanSpanish American IndianSri LankanSubsaharan AfricanSudaneseSwedishSwissSyrianTaiwaneseThaiTlingit-HaidaTohono O'OdhamTonganTrinidadian and TobagonianTsimshianTurkishU.S. Virgin IslanderUgandanUkrainianUruguayanUteVenezuelanVietnameseWelshWest IndianYakamaYaquiYugoslavianYumanYup'ikZimbabwean
Immigration
NonimmigrantsImmigrantsAfghanistanAfricaAlbaniaArgentinaArmeniaAsiaAustraliaAustriaBahamasBangladeshBarbadosBelarusBelgiumBelizeBoliviaBosnia and HerzegovinaBrazilBulgariaBurma/MyanmarCabo VerdeCambodiaCameroonCanadaCaribbeanCentral AmericaChileChinaColombiaCongoCosta RicaCroatiaCubaCzechoslovakiaDenmarkDominicaDominican RepublicEastern AfricaEastern AsiaEastern EuropeEcuadorEgyptEl SalvadorEnglandEritreaEthiopiaEuropeFijiFranceGermanyGhanaGreeceGrenadaGuatemalaGuyanaHaitiHondurasHong KongHungaryIndiaIndonesiaIranIraqIrelandIsraelItalyJamaicaJapanJordanKazakhstanKenyaKoreaKuwaitLaosLatin AmericaLatviaLebanonLiberiaLithuaniaMalaysiaMexicoMicronesiaMiddle AfricaMoldovaMoroccoNepalNetherlandsNicaraguaNigeriaNorth AmericaNorth MacedoniaNorthern AfricaNorthern EuropeNorwayOceaniaPakistanPanamaPeruPhilippinesPolandPortugalRomaniaRussiaSaudi ArabiaScotlandSenegalSerbiaSierra LeoneSingaporeSomaliaSouth AfricaSouth AmericaSouth Central AsiaSouth Eastern AsiaSouthern EuropeSpainSri LankaSt. Vincent and the GrenadinesSudanSwedenSwitzerlandSyriaTaiwanThailandTrinidad and TobagoTurkeyUgandaUkraineUruguayUzbekistanVenezuelaVietnamWest IndiesWestern AfricaWestern AsiaWestern EuropeYemenZaireZimbabweAzores
Married-Couple Family Poverty
Income
Poverty
Unemployment
Labor Participation
Family Structure
Vehicle Availability
Education Level
Disability

Married-Couple Family Poverty Comparison

Kenyans

Immigrants from Dominica

Exceptional
Tragic
4.8%
MARRIED-COUPLE FAMILY POVERTY
94.7/ 100
METRIC RATING
117th/ 347
METRIC RANK
7.1%
MARRIED-COUPLE FAMILY POVERTY
0.0/ 100
METRIC RATING
311th/ 347
METRIC RANK

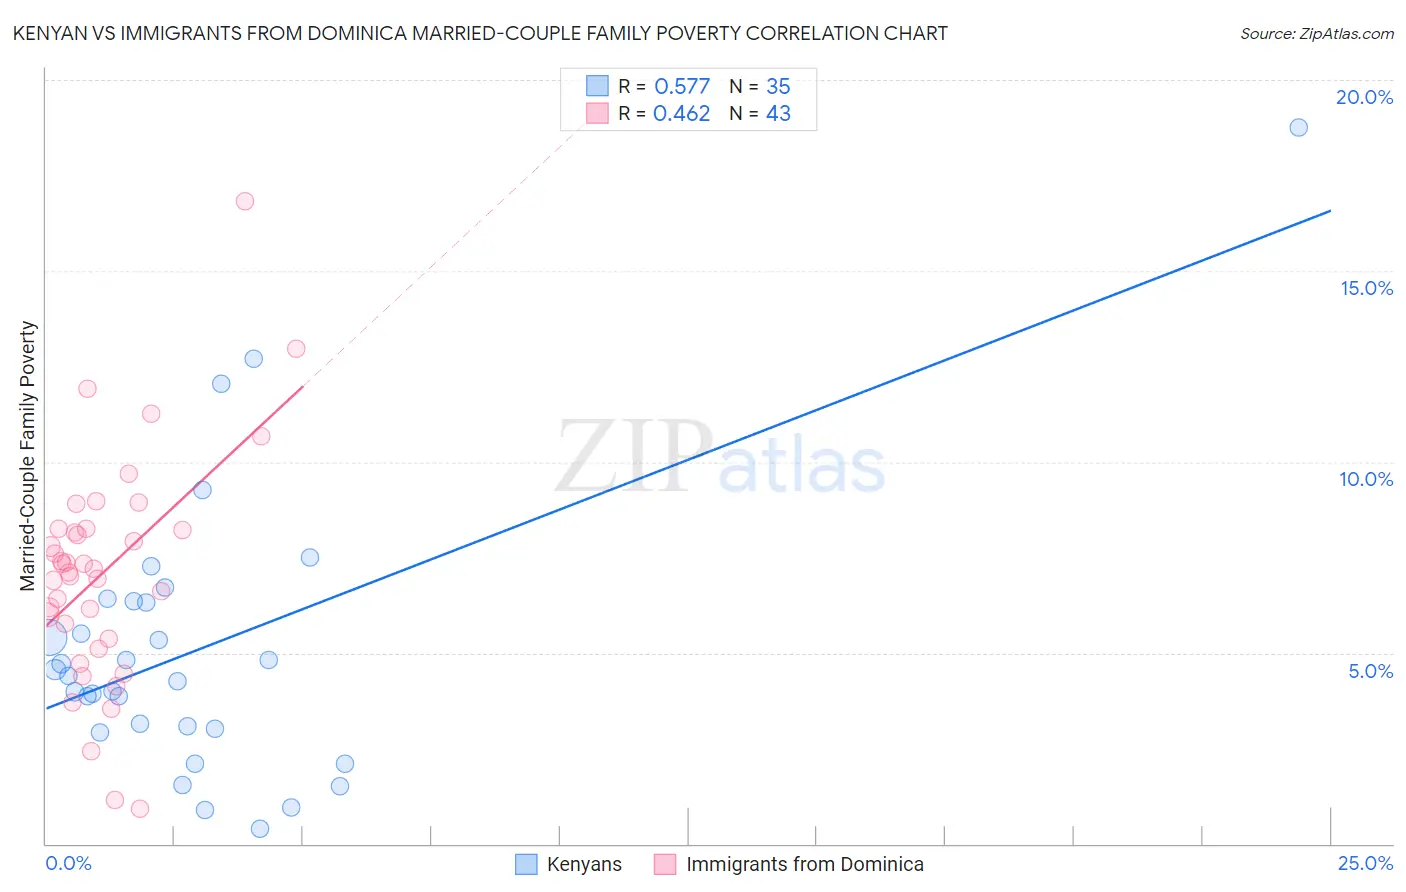
Kenyan vs Immigrants from Dominica Married-Couple Family Poverty Correlation Chart

The statistical analysis conducted on geographies consisting of 167,574,201 people shows a substantial positive correlation between the proportion of Kenyans and poverty level among married-couple families in the United States with a correlation coefficient (R) of 0.577 and weighted average of 4.8%. Similarly, the statistical analysis conducted on geographies consisting of 83,635,661 people shows a moderate positive correlation between the proportion of Immigrants from Dominica and poverty level among married-couple families in the United States with a correlation coefficient (R) of 0.462 and weighted average of 7.1%, a difference of 48.4%.
Kenyan vs Immigrants from Dominica Married-Couple Family Poverty

Married-Couple Family Poverty Correlation Summary

MeasurementKenyanImmigrants from Dominica
Minimum0.40%0.91%
Maximum18.8%16.8%
Range18.3%15.9%
Mean5.1%7.1%
Median4.4%7.2%
Interquartile 25% (IQ1)3.0%5.4%
Interquartile 75% (IQ3)6.3%8.3%
Interquartile Range (IQR)3.3%2.9%
Standard Deviation (Sample)3.7%3.0%
Standard Deviation (Population)3.6%2.9%

Similar Demographics by Married-Couple Family Poverty

Demographics Similar to Kenyans by Married-Couple Family Poverty

In terms of married-couple family poverty, the demographic groups most similar to Kenyans are Immigrants from Philippines (4.8%, a difference of 0.020%), Celtic (4.8%, a difference of 0.10%), Taiwanese (4.8%, a difference of 0.11%), Immigrants from Indonesia (4.8%, a difference of 0.26%), and Immigrants from Eastern Asia (4.8%, a difference of 0.39%).
DemographicsRating | RankMarried-Couple Family Poverty
Immigrants | Bolivia
96.2
/100
|
#110
Exceptional
4.7%
Pakistanis
96.2
/100
|
#111
Exceptional
4.7%
Tongans
95.9
/100
|
#112
Exceptional
4.7%
Immigrants | Nepal
95.9
/100
|
#113
Exceptional
4.7%
Immigrants | Indonesia
95.1
/100
|
#114
Exceptional
4.8%
Taiwanese
94.8
/100
|
#115
Exceptional
4.8%
Celtics
94.8
/100
|
#116
Exceptional
4.8%
Kenyans
94.7
/100
|
#117
Exceptional
4.8%
Immigrants | Philippines
94.6
/100
|
#118
Exceptional
4.8%
Immigrants | Eastern Asia
94.0
/100
|
#119
Exceptional
4.8%
Immigrants | Southern Europe
93.4
/100
|
#120
Exceptional
4.8%
Indians (Asian)
93.2
/100
|
#121
Exceptional
4.8%
Whites/Caucasians
93.1
/100
|
#122
Exceptional
4.8%
Jordanians
93.1
/100
|
#123
Exceptional
4.8%
Romanians
92.5
/100
|
#124
Exceptional
4.8%

Demographics Similar to Immigrants from Dominica by Married-Couple Family Poverty

In terms of married-couple family poverty, the demographic groups most similar to Immigrants from Dominica are Immigrants from Armenia (7.1%, a difference of 0.0%), Immigrants from Nicaragua (7.1%, a difference of 0.050%), Hopi (7.1%, a difference of 0.080%), Immigrants from St. Vincent and the Grenadines (7.1%, a difference of 0.11%), and British West Indian (7.1%, a difference of 0.41%).
DemographicsRating | RankMarried-Couple Family Poverty
Cubans
0.0
/100
|
#304
Tragic
6.8%
Haitians
0.0
/100
|
#305
Tragic
6.8%
Immigrants | Haiti
0.0
/100
|
#306
Tragic
7.0%
Guatemalans
0.0
/100
|
#307
Tragic
7.0%
Spanish American Indians
0.0
/100
|
#308
Tragic
7.1%
Hopi
0.0
/100
|
#309
Tragic
7.1%
Immigrants | Nicaragua
0.0
/100
|
#310
Tragic
7.1%
Immigrants | Dominica
0.0
/100
|
#311
Tragic
7.1%
Immigrants | Armenia
0.0
/100
|
#312
Tragic
7.1%
Immigrants | St. Vincent and the Grenadines
0.0
/100
|
#313
Tragic
7.1%
British West Indians
0.0
/100
|
#314
Tragic
7.1%
Inupiat
0.0
/100
|
#315
Tragic
7.1%
Hondurans
0.0
/100
|
#316
Tragic
7.2%
Mexicans
0.0
/100
|
#317
Tragic
7.2%
Immigrants | Guatemala
0.0
/100
|
#318
Tragic
7.2%