Hungarian Married-Couple Family Poverty

COMPARE

Hungarian
Race
Ancestry
AfghanAfricanAlaska NativeAlaskan AthabascanAlbanianAleutAlsatianAmericanApacheArabArapahoArgentineanArmenianAssyrian/Chaldean/SyriacAustralianAustrianBahamianBangladeshiBarbadianBasqueBelgianBelizeanBermudanBhutaneseBlackfeetBolivianBrazilianBritishBritish West IndianBulgarianBurmeseCajunCambodianCanadianCape VerdeanCarpatho RusynCelticCentral AmericanCentral American IndianCherokeeCheyenneChickasawChileanChineseChippewaChoctawColombianColvilleComancheCosta RicanCreeCreekCroatianCrowCubanCypriotCzechCzechoslovakianDanishDelawareDominicanDutchDutch West IndianEastern EuropeanEcuadorianEgyptianEnglishEstonianEthiopianEuropeanFijianFilipinoFinnishFrenchFrench American IndianFrench CanadianGermanGerman RussianGhanaianGreekGuamanian/ChamorroGuatemalanGuyaneseHaitianHmongHonduranHopiHoumaHungarianIcelanderIndian (Asian)IndonesianInupiatIranianIraqiIrishIroquoisIsraeliItalianJamaicanJapaneseJordanianKenyanKiowaKoreanLaotianLatvianLebaneseLiberianLithuanianLumbeeLuxembourgerMacedonianMalaysianMalteseMarshalleseMenomineeMexicanMexican American IndianMongolianMoroccanNative HawaiianNavajoNepaleseNew ZealanderNicaraguanNigerianNorthern EuropeanNorwegianOkinawanOsageOttawaPaiutePakistaniPalestinianPanamanianParaguayanPennsylvania GermanPeruvianPimaPolishPortuguesePotawatomiPuebloPuerto RicanPuget Sound SalishRomanianRussianSalvadoranSamoanScandinavianScotch-IrishScottishSeminoleSenegaleseSerbianShoshoneSierra LeoneanSiouxSlavicSlovakSloveneSomaliSouth AfricanSouth AmericanSouth American IndianSoviet UnionSpaniardSpanishSpanish AmericanSpanish American IndianSri LankanSubsaharan AfricanSudaneseSwedishSwissSyrianTaiwaneseThaiTlingit-HaidaTohono O'OdhamTonganTrinidadian and TobagonianTsimshianTurkishU.S. Virgin IslanderUgandanUkrainianUruguayanUteVenezuelanVietnameseWelshWest IndianYakamaYaquiYugoslavianYumanYup'ikZimbabwean
Immigration
NonimmigrantsImmigrantsAfghanistanAfricaAlbaniaArgentinaArmeniaAsiaAustraliaAustriaBahamasBangladeshBarbadosBelarusBelgiumBelizeBoliviaBosnia and HerzegovinaBrazilBulgariaBurma/MyanmarCabo VerdeCambodiaCameroonCanadaCaribbeanCentral AmericaChileChinaColombiaCongoCosta RicaCroatiaCubaCzechoslovakiaDenmarkDominicaDominican RepublicEastern AfricaEastern AsiaEastern EuropeEcuadorEgyptEl SalvadorEnglandEritreaEthiopiaEuropeFijiFranceGermanyGhanaGreeceGrenadaGuatemalaGuyanaHaitiHondurasHong KongHungaryIndiaIndonesiaIranIraqIrelandIsraelItalyJamaicaJapanJordanKazakhstanKenyaKoreaKuwaitLaosLatin AmericaLatviaLebanonLiberiaLithuaniaMalaysiaMexicoMicronesiaMiddle AfricaMoldovaMoroccoNepalNetherlandsNicaraguaNigeriaNorth AmericaNorth MacedoniaNorthern AfricaNorthern EuropeNorwayOceaniaPakistanPanamaPeruPhilippinesPolandPortugalRomaniaRussiaSaudi ArabiaScotlandSenegalSerbiaSierra LeoneSingaporeSomaliaSouth AfricaSouth AmericaSouth Central AsiaSouth Eastern AsiaSouthern EuropeSpainSri LankaSt. Vincent and the GrenadinesSudanSwedenSwitzerlandSyriaTaiwanThailandTrinidad and TobagoTurkeyUgandaUkraineUruguayUzbekistanVenezuelaVietnamWest IndiesWestern AfricaWestern AsiaWestern EuropeYemenZaireZimbabweAzores
Select to Compare
Race
Ancestry
AfghanAfricanAlaska NativeAlaskan AthabascanAlbanianAleutAlsatianAmericanApacheArabArapahoArgentineanArmenianAssyrian/Chaldean/SyriacAustralianAustrianBahamianBangladeshiBarbadianBasqueBelgianBelizeanBermudanBhutaneseBlackfeetBolivianBrazilianBritishBritish West IndianBulgarianBurmeseCajunCambodianCanadianCape VerdeanCarpatho RusynCelticCentral AmericanCentral American IndianCherokeeCheyenneChickasawChileanChineseChippewaChoctawColombianColvilleComancheCosta RicanCreeCreekCroatianCrowCubanCypriotCzechCzechoslovakianDanishDelawareDominicanDutchDutch West IndianEastern EuropeanEcuadorianEgyptianEnglishEstonianEthiopianEuropeanFijianFilipinoFinnishFrenchFrench American IndianFrench CanadianGermanGerman RussianGhanaianGreekGuamanian/ChamorroGuatemalanGuyaneseHaitianHmongHonduranHopiHoumaIcelanderIndian (Asian)IndonesianInupiatIranianIraqiIrishIroquoisIsraeliItalianJamaicanJapaneseJordanianKenyanKiowaKoreanLaotianLatvianLebaneseLiberianLithuanianLumbeeLuxembourgerMacedonianMalaysianMalteseMarshalleseMenomineeMexicanMexican American IndianMongolianMoroccanNative HawaiianNavajoNepaleseNew ZealanderNicaraguanNigerianNorthern EuropeanNorwegianOkinawanOsageOttawaPaiutePakistaniPalestinianPanamanianParaguayanPennsylvania GermanPeruvianPimaPolishPortuguesePotawatomiPuebloPuerto RicanPuget Sound SalishRomanianRussianSalvadoranSamoanScandinavianScotch-IrishScottishSeminoleSenegaleseSerbianShoshoneSierra LeoneanSiouxSlavicSlovakSloveneSomaliSouth AfricanSouth AmericanSouth American IndianSoviet UnionSpaniardSpanishSpanish AmericanSpanish American IndianSri LankanSubsaharan AfricanSudaneseSwedishSwissSyrianTaiwaneseThaiTlingit-HaidaTohono O'OdhamTonganTrinidadian and TobagonianTsimshianTurkishU.S. Virgin IslanderUgandanUkrainianUruguayanUteVenezuelanVietnameseWelshWest IndianYakamaYaquiYugoslavianYumanYup'ikZimbabwean
Immigration
NonimmigrantsImmigrantsAfghanistanAfricaAlbaniaArgentinaArmeniaAsiaAustraliaAustriaBahamasBangladeshBarbadosBelarusBelgiumBelizeBoliviaBosnia and HerzegovinaBrazilBulgariaBurma/MyanmarCabo VerdeCambodiaCameroonCanadaCaribbeanCentral AmericaChileChinaColombiaCongoCosta RicaCroatiaCubaCzechoslovakiaDenmarkDominicaDominican RepublicEastern AfricaEastern AsiaEastern EuropeEcuadorEgyptEl SalvadorEnglandEritreaEthiopiaEuropeFijiFranceGermanyGhanaGreeceGrenadaGuatemalaGuyanaHaitiHondurasHong KongHungaryIndiaIndonesiaIranIraqIrelandIsraelItalyJamaicaJapanJordanKazakhstanKenyaKoreaKuwaitLaosLatin AmericaLatviaLebanonLiberiaLithuaniaMalaysiaMexicoMicronesiaMiddle AfricaMoldovaMoroccoNepalNetherlandsNicaraguaNigeriaNorth AmericaNorth MacedoniaNorthern AfricaNorthern EuropeNorwayOceaniaPakistanPanamaPeruPhilippinesPolandPortugalRomaniaRussiaSaudi ArabiaScotlandSenegalSerbiaSierra LeoneSingaporeSomaliaSouth AfricaSouth AmericaSouth Central AsiaSouth Eastern AsiaSouthern EuropeSpainSri LankaSt. Vincent and the GrenadinesSudanSwedenSwitzerlandSyriaTaiwanThailandTrinidad and TobagoTurkeyUgandaUkraineUruguayUzbekistanVenezuelaVietnamWest IndiesWestern AfricaWestern AsiaWestern EuropeYemenZaireZimbabweAzores
Married-Couple Family Poverty
Income
Poverty
Unemployment
Labor Participation
Family Structure
Vehicle Availability
Education Level
Disability

Hungarian Married-Couple Family Poverty
Fair

5.3%
POVERTY | MARRIED-COUPLE FAMILIES
34.7/ 100
METRIC RATING
186th/ 347
METRIC RANK

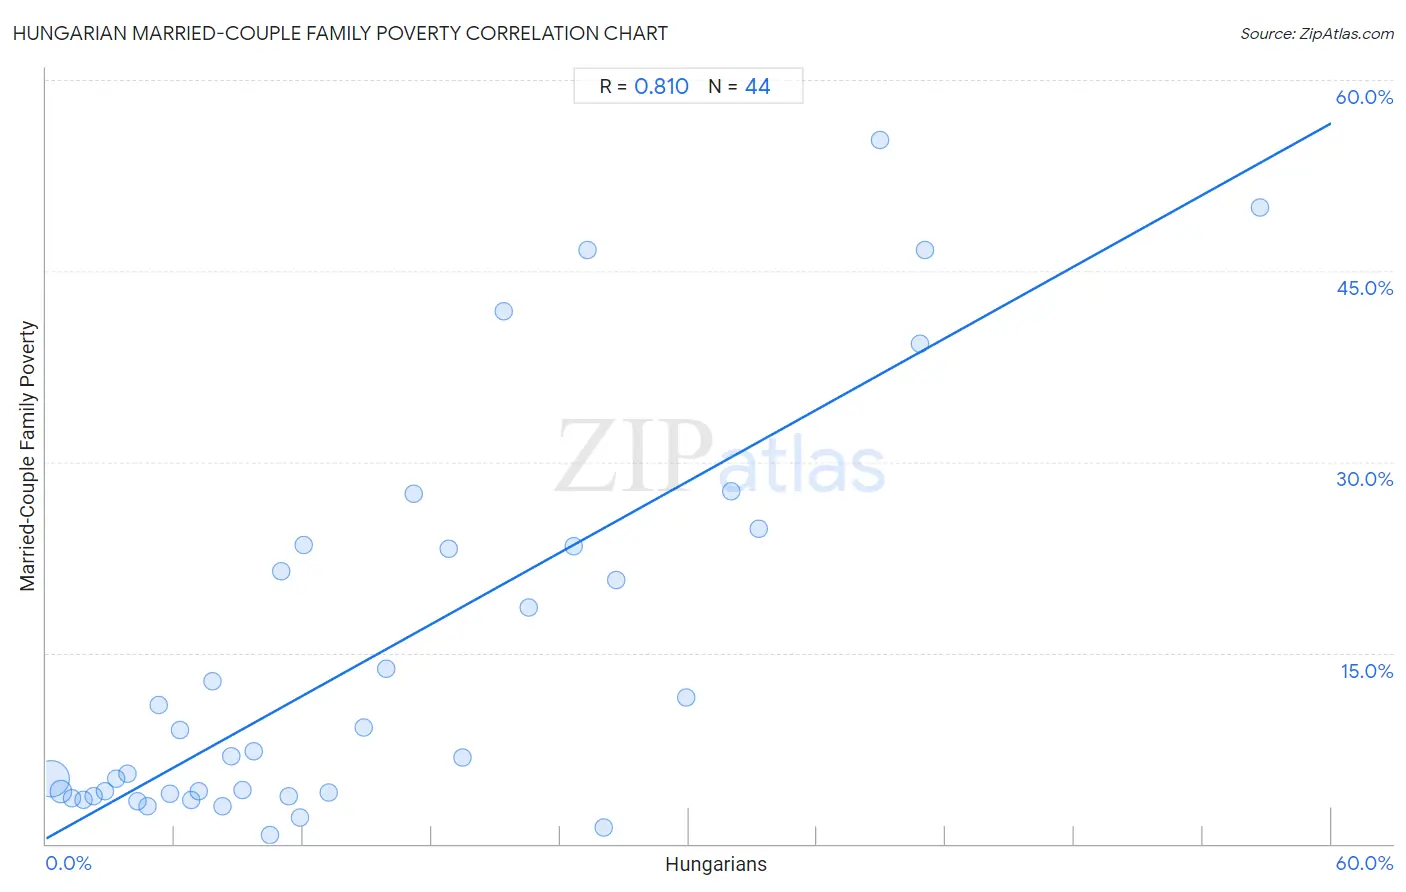
Hungarian Married-Couple Family Poverty Correlation Chart

The statistical analysis conducted on geographies consisting of 478,217,673 people shows a very strong positive correlation between the proportion of Hungarians and poverty level among married-couple families in the United States with a correlation coefficient (R) of 0.810 and weighted average of 5.3%. On average, for every 1% (one percent) increase in Hungarians within a typical geography, there is an increase of 0.94% in poverty level among married-couple families.
Hungarian Married-Couple Family Poverty
It is essential to understand that the correlation between the percentage of Hungarians and poverty level among married-couple families does not imply a direct cause-and-effect relationship. It remains uncertain whether the presence of Hungarians influences an upward or downward trend in the level of poverty level among married-couple families within an area, or if Hungarians simply ended up residing in those areas with higher or lower levels of poverty level among married-couple families due to other factors.

Demographics Similar to Hungarians by Married-Couple Family Poverty

In terms of married-couple family poverty, the demographic groups most similar to Hungarians are American (5.3%, a difference of 0.080%), Immigrants from Albania (5.3%, a difference of 0.11%), Nonimmigrants (5.3%, a difference of 0.13%), Israeli (5.3%, a difference of 0.20%), and South American Indian (5.3%, a difference of 0.29%).
DemographicsRating | RankMarried-Couple Family Poverty
Spanish
41.4
/100
|
#179
Average
5.3%
Immigrants from Sierra Leone
39.3
/100
|
#180
Fair
5.3%
Immigrants from Chile
38.8
/100
|
#181
Fair
5.3%
Immigrants from Vietnam
37.7
/100
|
#182
Fair
5.3%
Peruvians
37.6
/100
|
#183
Fair
5.3%
Nonimmigrants
35.8
/100
|
#184
Fair
5.3%
Americans
35.4
/100
|
#185
Fair
5.3%
Hungarians
34.7
/100
|
#186
Fair
5.3%
Immigrants from Albania
33.8
/100
|
#187
Fair
5.3%
Israelis
33.1
/100
|
#188
Fair
5.3%
South American Indians
32.5
/100
|
#189
Fair
5.3%
Ugandans
31.6
/100
|
#190
Fair
5.3%
Immigrants from Cabo Verde
30.9
/100
|
#191
Fair
5.3%
Cape Verdeans
30.7
/100
|
#192
Fair
5.3%
Malaysians
29.5
/100
|
#193
Fair
5.4%

Hungarian Married-Couple Family Poverty Correlation Summary

MeasurementHungarian DataMarried-Couple Family Poverty Data
Minimum0.21%0.71%
Maximum56.7%55.3%
Range56.5%54.5%
Mean15.3%14.8%
Median11.1%7.0%
Interquartile 25% (IQ1)5.5%3.9%
Interquartile 75% (IQ3)23.6%23.3%
Interquartile Range (IQR)18.1%19.4%
Standard Deviation (Sample)13.1%15.1%
Standard Deviation (Population)12.9%14.9%

Correlation Details

Hungarian PercentileSample SizeMarried-Couple Family Poverty
[
0.0%
-
0.5%
]
0.21%
353,738,0575.1%
[
0.5%
-
1.0%
]
0.68%
84,000,3504.1%
[
1.0%
-
1.5%
]
1.20%
20,861,1793.6%
[
1.5%
-
2.0%
]
1.73%
8,156,5163.5%
[
2.0%
-
2.5%
]
2.23%
3,792,1123.7%
[
2.5%
-
3.0%
]
2.75%
2,023,9274.2%
[
3.0%
-
3.5%
]
3.25%
1,749,6985.2%
[
3.5%
-
4.0%
]
3.77%
1,255,9155.5%
[
4.0%
-
4.5%
]
4.26%
865,9663.3%
[
4.5%
-
5.0%
]
4.73%
428,6113.0%
[
5.0%
-
5.5%
]
5.28%
411,78110.9%
[
5.5%
-
6.0%
]
5.77%
130,0354.0%
[
6.0%
-
6.5%
]
6.22%
131,3879.0%
[
6.5%
-
7.0%
]
6.77%
109,0403.4%
[
7.0%
-
7.5%
]
7.14%
53,9004.2%
[
7.5%
-
8.0%
]
7.75%
61,09312.7%
[
8.0%
-
8.5%
]
8.21%
34,6972.9%
[
8.5%
-
9.0%
]
8.66%
14,0386.9%
[
9.0%
-
9.5%
]
9.16%
14,5914.3%
[
9.5%
-
10.0%
]
9.71%
10,5917.2%
[
10.0%
-
10.5%
]
10.44%
2,5970.71%
[
10.5%
-
11.0%
]
10.95%
53,45721.4%
[
11.0%
-
11.5%
]
11.30%
25,9793.8%
[
11.5%
-
12.0%
]
11.84%
9,9012.1%
[
12.0%
-
12.5%
]
12.05%
73,86323.5%
[
13.0%
-
13.5%
]
13.20%
5684.0%
[
14.5%
-
15.0%
]
14.81%
549.1%
[
15.5%
-
16.0%
]
15.85%
16413.8%
[
17.0%
-
17.5%
]
17.14%
47,50927.5%
[
18.5%
-
19.0%
]
18.80%
94723.2%
[
19.0%
-
19.5%
]
19.42%
1,9216.8%
[
21.0%
-
21.5%
]
21.35%
28,28741.8%
[
22.5%
-
23.0%
]
22.53%
7,38518.6%
[
24.5%
-
25.0%
]
24.63%
64,19323.4%
[
25.0%
-
25.5%
]
25.29%
6,46046.7%
[
26.0%
-
26.5%
]
26.04%
1921.3%
[
26.5%
-
27.0%
]
26.60%
18820.7%
[
29.5%
-
30.0%
]
29.88%
80011.5%
[
31.5%
-
32.0%
]
31.96%
3,85827.7%
[
33.0%
-
33.5%
]
33.30%
87124.8%
[
38.5%
-
39.0%
]
38.95%
9,57855.3%
[
40.5%
-
41.0%
]
40.81%
34,39539.3%
[
41.0%
-
41.5%
]
41.06%
96246.6%
[
56.5%
-
57.0%
]
56.67%
6050.0%