Immigrants from Micronesia Married-Couple Family Poverty

COMPARE

Immigrants from Micronesia
Race
Ancestry
AfghanAfricanAlaska NativeAlaskan AthabascanAlbanianAleutAlsatianAmericanApacheArabArapahoArgentineanArmenianAssyrian/Chaldean/SyriacAustralianAustrianBahamianBangladeshiBarbadianBasqueBelgianBelizeanBermudanBhutaneseBlackfeetBolivianBrazilianBritishBritish West IndianBulgarianBurmeseCajunCambodianCanadianCape VerdeanCarpatho RusynCelticCentral AmericanCentral American IndianCherokeeCheyenneChickasawChileanChineseChippewaChoctawColombianColvilleComancheCosta RicanCreeCreekCroatianCrowCubanCypriotCzechCzechoslovakianDanishDelawareDominicanDutchDutch West IndianEastern EuropeanEcuadorianEgyptianEnglishEstonianEthiopianEuropeanFijianFilipinoFinnishFrenchFrench American IndianFrench CanadianGermanGerman RussianGhanaianGreekGuamanian/ChamorroGuatemalanGuyaneseHaitianHmongHonduranHopiHoumaHungarianIcelanderIndian (Asian)IndonesianInupiatIranianIraqiIrishIroquoisIsraeliItalianJamaicanJapaneseJordanianKenyanKiowaKoreanLaotianLatvianLebaneseLiberianLithuanianLumbeeLuxembourgerMacedonianMalaysianMalteseMarshalleseMenomineeMexicanMexican American IndianMongolianMoroccanNative HawaiianNavajoNepaleseNew ZealanderNicaraguanNigerianNorthern EuropeanNorwegianOkinawanOsageOttawaPaiutePakistaniPalestinianPanamanianParaguayanPennsylvania GermanPeruvianPimaPolishPortuguesePotawatomiPuebloPuerto RicanPuget Sound SalishRomanianRussianSalvadoranSamoanScandinavianScotch-IrishScottishSeminoleSenegaleseSerbianShoshoneSierra LeoneanSiouxSlavicSlovakSloveneSomaliSouth AfricanSouth AmericanSouth American IndianSoviet UnionSpaniardSpanishSpanish AmericanSpanish American IndianSri LankanSubsaharan AfricanSudaneseSwedishSwissSyrianTaiwaneseThaiTlingit-HaidaTohono O'OdhamTonganTrinidadian and TobagonianTsimshianTurkishU.S. Virgin IslanderUgandanUkrainianUruguayanUteVenezuelanVietnameseWelshWest IndianYakamaYaquiYugoslavianYumanYup'ikZimbabwean
Immigration
NonimmigrantsImmigrantsAfghanistanAfricaAlbaniaArgentinaArmeniaAsiaAustraliaAustriaBahamasBangladeshBarbadosBelarusBelgiumBelizeBoliviaBosnia and HerzegovinaBrazilBulgariaBurma/MyanmarCabo VerdeCambodiaCameroonCanadaCaribbeanCentral AmericaChileChinaColombiaCongoCosta RicaCroatiaCubaCzechoslovakiaDenmarkDominicaDominican RepublicEastern AfricaEastern AsiaEastern EuropeEcuadorEgyptEl SalvadorEnglandEritreaEthiopiaEuropeFijiFranceGermanyGhanaGreeceGrenadaGuatemalaGuyanaHaitiHondurasHong KongHungaryIndiaIndonesiaIranIraqIrelandIsraelItalyJamaicaJapanJordanKazakhstanKenyaKoreaKuwaitLaosLatin AmericaLatviaLebanonLiberiaLithuaniaMalaysiaMexicoMicronesiaMiddle AfricaMoldovaMoroccoNepalNetherlandsNicaraguaNigeriaNorth AmericaNorth MacedoniaNorthern AfricaNorthern EuropeNorwayOceaniaPakistanPanamaPeruPhilippinesPolandPortugalRomaniaRussiaSaudi ArabiaScotlandSenegalSerbiaSierra LeoneSingaporeSomaliaSouth AfricaSouth AmericaSouth Central AsiaSouth Eastern AsiaSouthern EuropeSpainSri LankaSt. Vincent and the GrenadinesSudanSwedenSwitzerlandSyriaTaiwanThailandTrinidad and TobagoTurkeyUgandaUkraineUruguayUzbekistanVenezuelaVietnamWest IndiesWestern AfricaWestern AsiaWestern EuropeYemenZaireZimbabweAzores
Select to Compare
Race
Ancestry
AfghanAfricanAlaska NativeAlaskan AthabascanAlbanianAleutAlsatianAmericanApacheArabArapahoArgentineanArmenianAssyrian/Chaldean/SyriacAustralianAustrianBahamianBangladeshiBarbadianBasqueBelgianBelizeanBermudanBhutaneseBlackfeetBolivianBrazilianBritishBritish West IndianBulgarianBurmeseCajunCambodianCanadianCape VerdeanCarpatho RusynCelticCentral AmericanCentral American IndianCherokeeCheyenneChickasawChileanChineseChippewaChoctawColombianColvilleComancheCosta RicanCreeCreekCroatianCrowCubanCypriotCzechCzechoslovakianDanishDelawareDominicanDutchDutch West IndianEastern EuropeanEcuadorianEgyptianEnglishEstonianEthiopianEuropeanFijianFilipinoFinnishFrenchFrench American IndianFrench CanadianGermanGerman RussianGhanaianGreekGuamanian/ChamorroGuatemalanGuyaneseHaitianHmongHonduranHopiHoumaHungarianIcelanderIndian (Asian)IndonesianInupiatIranianIraqiIrishIroquoisIsraeliItalianJamaicanJapaneseJordanianKenyanKiowaKoreanLaotianLatvianLebaneseLiberianLithuanianLumbeeLuxembourgerMacedonianMalaysianMalteseMarshalleseMenomineeMexicanMexican American IndianMongolianMoroccanNative HawaiianNavajoNepaleseNew ZealanderNicaraguanNigerianNorthern EuropeanNorwegianOkinawanOsageOttawaPaiutePakistaniPalestinianPanamanianParaguayanPennsylvania GermanPeruvianPimaPolishPortuguesePotawatomiPuebloPuerto RicanPuget Sound SalishRomanianRussianSalvadoranSamoanScandinavianScotch-IrishScottishSeminoleSenegaleseSerbianShoshoneSierra LeoneanSiouxSlavicSlovakSloveneSomaliSouth AfricanSouth AmericanSouth American IndianSoviet UnionSpaniardSpanishSpanish AmericanSpanish American IndianSri LankanSubsaharan AfricanSudaneseSwedishSwissSyrianTaiwaneseThaiTlingit-HaidaTohono O'OdhamTonganTrinidadian and TobagonianTsimshianTurkishU.S. Virgin IslanderUgandanUkrainianUruguayanUteVenezuelanVietnameseWelshWest IndianYakamaYaquiYugoslavianYumanYup'ikZimbabwean
Immigration
NonimmigrantsImmigrantsAfghanistanAfricaAlbaniaArgentinaArmeniaAsiaAustraliaAustriaBahamasBangladeshBarbadosBelarusBelgiumBelizeBoliviaBosnia and HerzegovinaBrazilBulgariaBurma/MyanmarCabo VerdeCambodiaCameroonCanadaCaribbeanCentral AmericaChileChinaColombiaCongoCosta RicaCroatiaCubaCzechoslovakiaDenmarkDominicaDominican RepublicEastern AfricaEastern AsiaEastern EuropeEcuadorEgyptEl SalvadorEnglandEritreaEthiopiaEuropeFijiFranceGermanyGhanaGreeceGrenadaGuatemalaGuyanaHaitiHondurasHong KongHungaryIndiaIndonesiaIranIraqIrelandIsraelItalyJamaicaJapanJordanKazakhstanKenyaKoreaKuwaitLaosLatin AmericaLatviaLebanonLiberiaLithuaniaMalaysiaMexicoMiddle AfricaMoldovaMoroccoNepalNetherlandsNicaraguaNigeriaNorth AmericaNorth MacedoniaNorthern AfricaNorthern EuropeNorwayOceaniaPakistanPanamaPeruPhilippinesPolandPortugalRomaniaRussiaSaudi ArabiaScotlandSenegalSerbiaSierra LeoneSingaporeSomaliaSouth AfricaSouth AmericaSouth Central AsiaSouth Eastern AsiaSouthern EuropeSpainSri LankaSt. Vincent and the GrenadinesSudanSwedenSwitzerlandSyriaTaiwanThailandTrinidad and TobagoTurkeyUgandaUkraineUruguayUzbekistanVenezuelaVietnamWest IndiesWestern AfricaWestern AsiaWestern EuropeYemenZaireZimbabweAzores
Married-Couple Family Poverty
Income
Poverty
Unemployment
Labor Participation
Family Structure
Vehicle Availability
Education Level
Disability

Immigrants from Micronesia Married-Couple Family Poverty
Poor

5.5%
POVERTY | MARRIED-COUPLE FAMILIES
14.4/ 100
METRIC RATING
210th/ 347
METRIC RANK

Immigrants from Micronesia Married-Couple Family Poverty Correlation Chart

The statistical analysis conducted on geographies consisting of 61,488,987 people shows no correlation between the proportion of Immigrants from Micronesia and poverty level among married-couple families in the United States with a correlation coefficient (R) of 0.009 and weighted average of 5.5%. On average, for every 1% (one percent) increase in Immigrants from Micronesia within a typical geography, there is an increase of 0.0073% in poverty level among married-couple families.
Immigrants from Micronesia Married-Couple Family Poverty
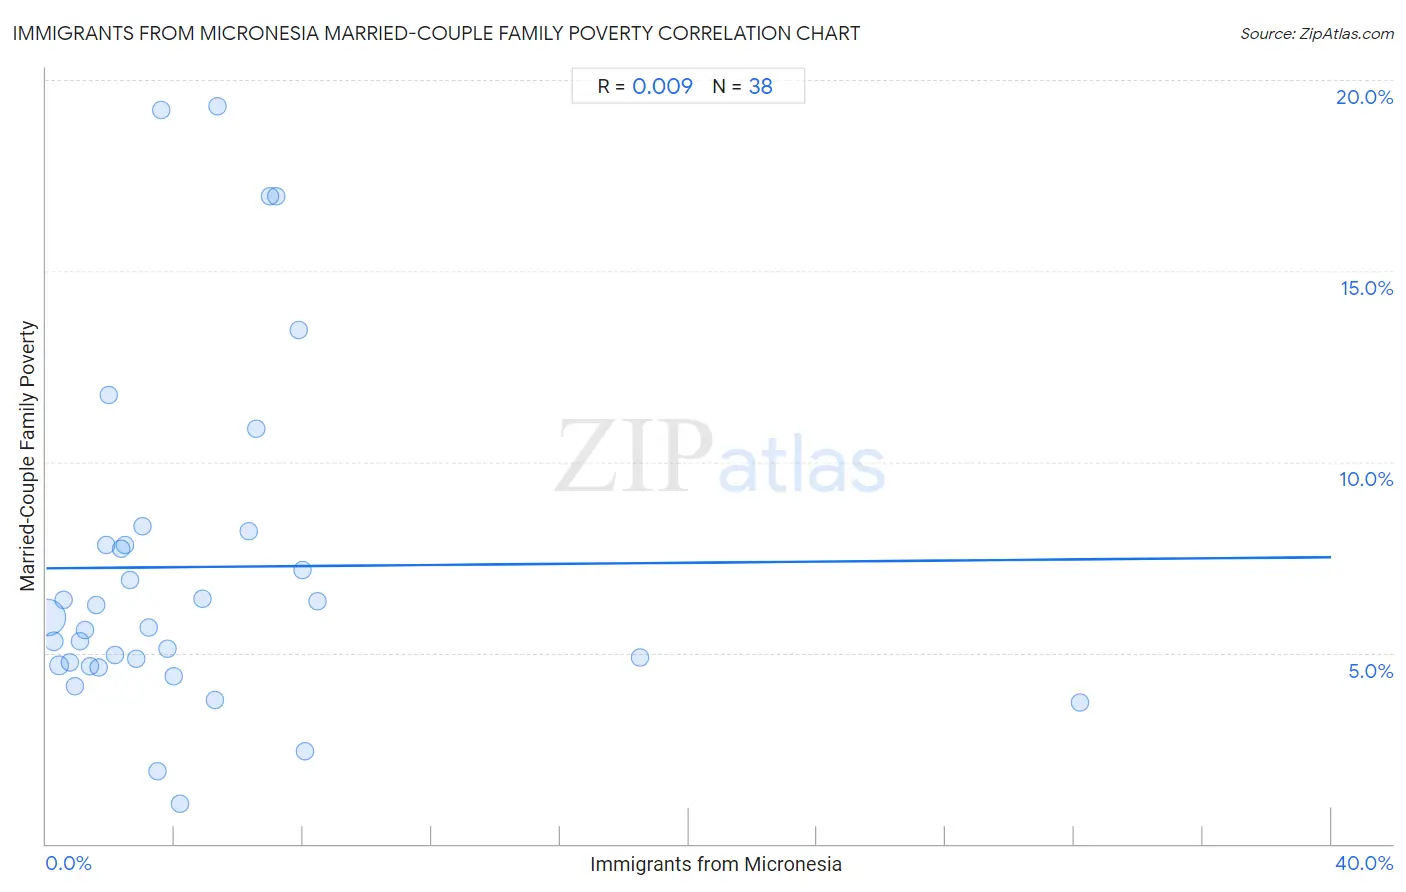
It is essential to understand that the correlation between the percentage of Immigrants from Micronesia and poverty level among married-couple families does not imply a direct cause-and-effect relationship. It remains uncertain whether the presence of Immigrants from Micronesia influences an upward or downward trend in the level of poverty level among married-couple families within an area, or if Immigrants from Micronesia simply ended up residing in those areas with higher or lower levels of poverty level among married-couple families due to other factors.

Demographics Similar to Immigrants from Micronesia by Married-Couple Family Poverty

In terms of married-couple family poverty, the demographic groups most similar to Immigrants from Micronesia are Nigerian (5.5%, a difference of 0.020%), Immigrants from Thailand (5.5%, a difference of 0.090%), Immigrants from Syria (5.5%, a difference of 0.21%), Immigrants from Liberia (5.5%, a difference of 0.26%), and Iroquois (5.5%, a difference of 0.31%).
DemographicsRating | RankMarried-Couple Family Poverty
Immigrants from Peru
21.8
/100
|
#203
Fair
5.4%
Immigrants from Costa Rica
19.4
/100
|
#204
Poor
5.4%
Chippewa
18.9
/100
|
#205
Poor
5.4%
Osage
18.4
/100
|
#206
Poor
5.4%
Immigrants from Africa
17.6
/100
|
#207
Poor
5.5%
French American Indians
16.1
/100
|
#208
Poor
5.5%
Immigrants from Syria
15.4
/100
|
#209
Poor
5.5%
Immigrants from Micronesia
14.4
/100
|
#210
Poor
5.5%
Nigerians
14.3
/100
|
#211
Poor
5.5%
Immigrants from Thailand
14.0
/100
|
#212
Poor
5.5%
Immigrants from Liberia
13.3
/100
|
#213
Poor
5.5%
Iroquois
13.1
/100
|
#214
Poor
5.5%
Armenians
12.8
/100
|
#215
Poor
5.5%
Potawatomi
12.4
/100
|
#216
Poor
5.5%
Immigrants from Nigeria
11.3
/100
|
#217
Poor
5.5%

Immigrants from Micronesia Married-Couple Family Poverty Correlation Summary

MeasurementImmigrants from Micronesia DataMarried-Couple Family Poverty Data
Minimum0.022%1.0%
Maximum32.2%19.3%
Range32.1%18.3%
Mean4.6%7.2%
Median3.1%5.8%
Interquartile 25% (IQ1)1.6%4.7%
Interquartile 75% (IQ3)6.3%7.8%
Interquartile Range (IQR)4.7%3.2%
Standard Deviation (Sample)5.7%4.5%
Standard Deviation (Population)5.7%4.4%

Correlation Details

Immigrants from Micronesia PercentileSample SizeMarried-Couple Family Poverty
[
0.0%
-
0.5%
]
0.022%
53,326,8455.9%
[
0.0%
-
0.5%
]
0.22%
3,437,8185.3%
[
0.0%
-
0.5%
]
0.39%
1,628,3834.7%
[
0.5%
-
1.0%
]
0.54%
906,0006.4%
[
0.5%
-
1.0%
]
0.73%
520,1424.8%
[
0.5%
-
1.0%
]
0.90%
465,4584.1%
[
1.0%
-
1.5%
]
1.05%
181,7675.3%
[
1.0%
-
1.5%
]
1.22%
79,6225.6%
[
1.0%
-
1.5%
]
1.35%
37,8684.6%
[
1.5%
-
2.0%
]
1.56%
122,8546.3%
[
1.5%
-
2.0%
]
1.63%
381,1414.6%
[
1.5%
-
2.0%
]
1.88%
3,0277.8%
[
1.5%
-
2.0%
]
1.95%
66711.8%
[
2.0%
-
2.5%
]
2.13%
133,4785.0%
[
2.0%
-
2.5%
]
2.33%
78,5267.7%
[
2.0%
-
2.5%
]
2.46%
1,9077.8%
[
2.5%
-
3.0%
]
2.59%
55,1756.9%
[
2.5%
-
3.0%
]
2.81%
3,7014.8%
[
2.5%
-
3.0%
]
2.99%
8,2548.3%
[
3.0%
-
3.5%
]
3.19%
58,7425.7%
[
3.0%
-
3.5%
]
3.48%
3,8501.9%
[
3.5%
-
4.0%
]
3.59%
92019.2%
[
3.5%
-
4.0%
]
3.77%
7,7975.1%
[
3.5%
-
4.0%
]
3.95%
11,2074.4%
[
4.0%
-
4.5%
]
4.17%
6241.0%
[
4.5%
-
5.0%
]
4.87%
10,0426.4%
[
5.0%
-
5.5%
]
5.26%
2,3563.8%
[
5.0%
-
5.5%
]
5.31%
41419.3%
[
6.0%
-
6.5%
]
6.28%
2,0058.2%
[
6.5%
-
7.0%
]
6.53%
3,47710.9%
[
6.5%
-
7.0%
]
6.97%
20116.9%
[
7.0%
-
7.5%
]
7.14%
19616.9%
[
7.5%
-
8.0%
]
7.87%
4,84213.4%
[
7.5%
-
8.0%
]
7.96%
5,3917.2%
[
8.0%
-
8.5%
]
8.05%
2,8202.4%
[
8.0%
-
8.5%
]
8.44%
3796.3%
[
18.0%
-
18.5%
]
18.47%
6934.9%
[
32.0%
-
32.5%
]
32.16%
3983.7%