Immigrants from Croatia Married-Couple Family Poverty
COMPARE
Immigrants from Croatia
Select to Compare
Married-Couple Family Poverty
Immigrants from Croatia Married-Couple Family Poverty
4.6%
POVERTY | MARRIED-COUPLE FAMILIES
98.7/ 100
METRIC RATING
84th/ 347
METRIC RANK
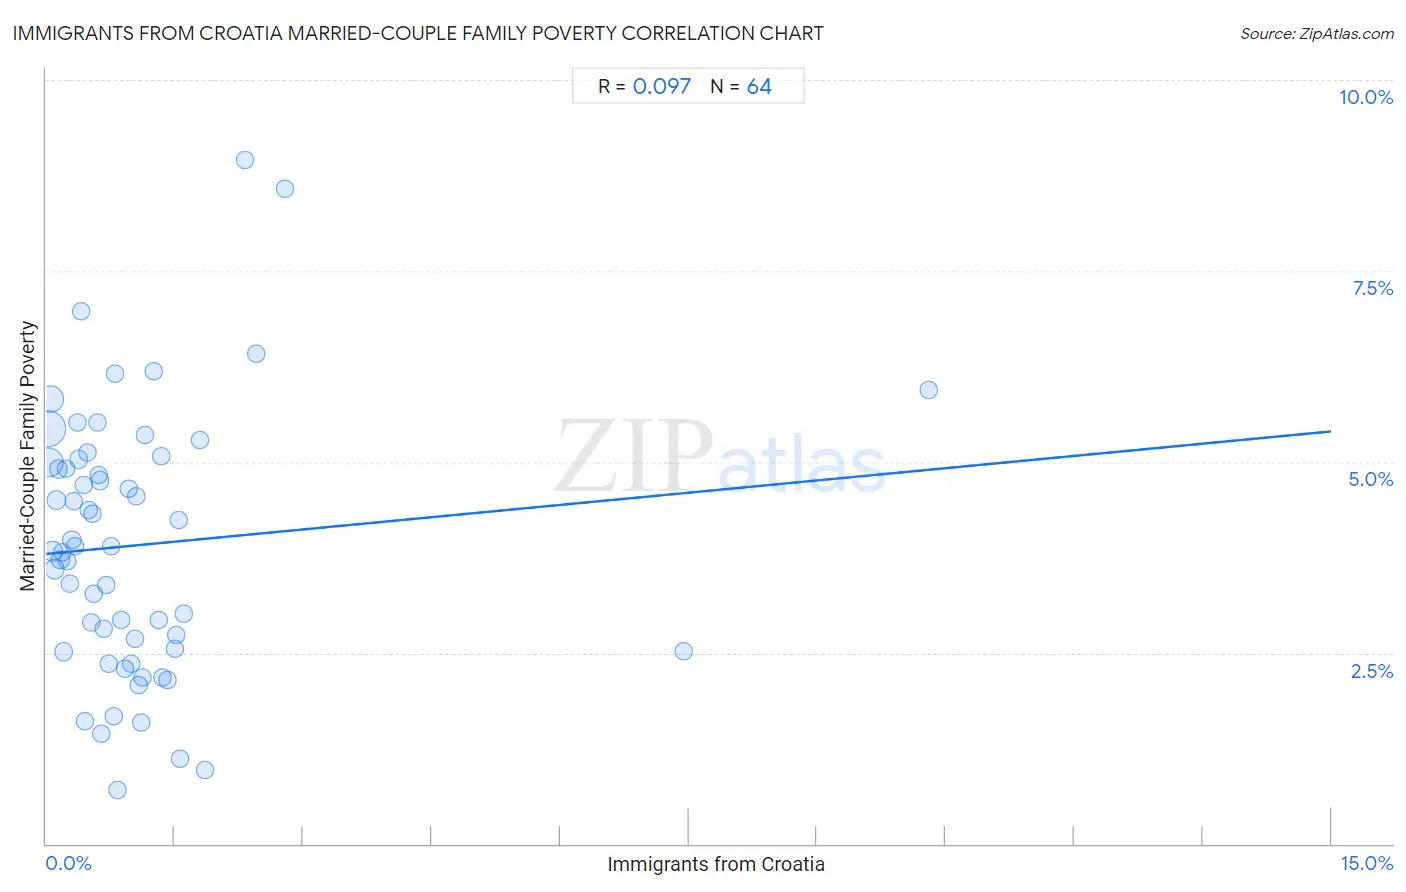
Immigrants from Croatia Married-Couple Family Poverty Correlation Chart
The statistical analysis conducted on geographies consisting of 132,064,447 people shows a slight positive correlation between the proportion of Immigrants from Croatia and poverty level among married-couple families in the United States with a correlation coefficient (R) of 0.097 and weighted average of 4.6%. On average, for every 1% (one percent) increase in Immigrants from Croatia within a typical geography, there is an increase of 0.11% in poverty level among married-couple families.
It is essential to understand that the correlation between the percentage of Immigrants from Croatia and poverty level among married-couple families does not imply a direct cause-and-effect relationship. It remains uncertain whether the presence of Immigrants from Croatia influences an upward or downward trend in the level of poverty level among married-couple families within an area, or if Immigrants from Croatia simply ended up residing in those areas with higher or lower levels of poverty level among married-couple families due to other factors.
Demographics Similar to Immigrants from Croatia by Married-Couple Family Poverty
In terms of married-couple family poverty, the demographic groups most similar to Immigrants from Croatia are Immigrants from Denmark (4.6%, a difference of 0.13%), South African (4.6%, a difference of 0.23%), Immigrants from Turkey (4.6%, a difference of 0.27%), Canadian (4.5%, a difference of 0.29%), and Immigrants from North Macedonia (4.6%, a difference of 0.35%).
| Demographics | Rating | Rank | Married-Couple Family Poverty |
| Immigrants from Latvia | 99.1 /100 | #77 | Exceptional 4.5% |
| Scotch-Irish | 99.1 /100 | #78 | Exceptional 4.5% |
| Immigrants from Iran | 99.0 /100 | #79 | Exceptional 4.5% |
| Icelanders | 99.0 /100 | #80 | Exceptional 4.5% |
| Immigrants from Greece | 98.9 /100 | #81 | Exceptional 4.5% |
| Canadians | 98.8 /100 | #82 | Exceptional 4.5% |
| Immigrants from Denmark | 98.8 /100 | #83 | Exceptional 4.6% |
| Immigrants from Croatia | 98.7 /100 | #84 | Exceptional 4.6% |
| South Africans | 98.7 /100 | #85 | Exceptional 4.6% |
| Immigrants from Turkey | 98.6 /100 | #86 | Exceptional 4.6% |
| Immigrants from North Macedonia | 98.6 /100 | #87 | Exceptional 4.6% |
| Bolivians | 98.6 /100 | #88 | Exceptional 4.6% |
| Immigrants from Czechoslovakia | 98.5 /100 | #89 | Exceptional 4.6% |
| Immigrants from Switzerland | 98.5 /100 | #90 | Exceptional 4.6% |
| Basques | 98.5 /100 | #91 | Exceptional 4.6% |
Immigrants from Croatia Married-Couple Family Poverty Correlation Summary
| Measurement | Immigrants from Croatia Data | Married-Couple Family Poverty Data |
| Minimum | 0.010% | 0.70% |
| Maximum | 10.3% | 8.9% |
| Range | 10.3% | 8.2% |
| Mean | 1.1% | 3.9% |
| Median | 0.71% | 3.9% |
| Interquartile 25% (IQ1) | 0.35% | 2.5% |
| Interquartile 75% (IQ3) | 1.3% | 5.0% |
| Interquartile Range (IQR) | 0.93% | 2.5% |
| Standard Deviation (Sample) | 1.6% | 1.7% |
| Standard Deviation (Population) | 1.5% | 1.7% |
Correlation Details
| Immigrants from Croatia Percentile | Sample Size | Married-Couple Family Poverty |
[ 0.0% - 0.5% ] 0.010% | 53,221,808 | 5.4% |
[ 0.0% - 0.5% ] 0.031% | 32,228,172 | 5.0% |
[ 0.0% - 0.5% ] 0.049% | 22,839,485 | 5.8% |
[ 0.0% - 0.5% ] 0.077% | 6,846,192 | 3.8% |
[ 0.0% - 0.5% ] 0.098% | 5,188,926 | 3.6% |
[ 0.0% - 0.5% ] 0.12% | 2,480,984 | 4.5% |
[ 0.0% - 0.5% ] 0.14% | 1,619,472 | 4.9% |
[ 0.0% - 0.5% ] 0.16% | 1,319,272 | 3.7% |
[ 0.0% - 0.5% ] 0.19% | 1,057,801 | 3.8% |
[ 0.0% - 0.5% ] 0.21% | 527,945 | 2.5% |
[ 0.0% - 0.5% ] 0.23% | 740,300 | 4.9% |
[ 0.0% - 0.5% ] 0.25% | 584,026 | 3.7% |
[ 0.0% - 0.5% ] 0.27% | 461,191 | 3.4% |
[ 0.0% - 0.5% ] 0.30% | 341,651 | 4.0% |
[ 0.0% - 0.5% ] 0.32% | 221,275 | 4.5% |
[ 0.0% - 0.5% ] 0.34% | 318,257 | 3.9% |
[ 0.0% - 0.5% ] 0.36% | 203,231 | 5.5% |
[ 0.0% - 0.5% ] 0.39% | 208,826 | 5.0% |
[ 0.0% - 0.5% ] 0.41% | 62,157 | 7.0% |
[ 0.0% - 0.5% ] 0.43% | 151,208 | 4.7% |
[ 0.0% - 0.5% ] 0.45% | 135,542 | 1.6% |
[ 0.0% - 0.5% ] 0.48% | 117,225 | 5.1% |
[ 0.0% - 0.5% ] 0.49% | 162,733 | 4.4% |
[ 0.5% - 1.0% ] 0.52% | 77,634 | 2.9% |
[ 0.5% - 1.0% ] 0.54% | 39,655 | 4.3% |
[ 0.5% - 1.0% ] 0.56% | 83,552 | 3.3% |
[ 0.5% - 1.0% ] 0.59% | 76,979 | 5.5% |
[ 0.5% - 1.0% ] 0.61% | 13,534 | 4.8% |
[ 0.5% - 1.0% ] 0.63% | 82,208 | 4.8% |
[ 0.5% - 1.0% ] 0.65% | 29,903 | 1.4% |
[ 0.5% - 1.0% ] 0.67% | 56,899 | 2.8% |
[ 0.5% - 1.0% ] 0.70% | 25,444 | 3.4% |
[ 0.5% - 1.0% ] 0.73% | 4,536 | 2.4% |
[ 0.5% - 1.0% ] 0.76% | 46,394 | 3.9% |
[ 0.5% - 1.0% ] 0.78% | 59,897 | 1.7% |
[ 0.5% - 1.0% ] 0.80% | 6,845 | 6.2% |
[ 0.5% - 1.0% ] 0.83% | 31,458 | 0.70% |
[ 0.5% - 1.0% ] 0.87% | 50,849 | 2.9% |
[ 0.5% - 1.0% ] 0.92% | 35,889 | 2.3% |
[ 0.5% - 1.0% ] 0.96% | 1,248 | 4.6% |
[ 0.5% - 1.0% ] 0.99% | 8,820 | 2.4% |
[ 1.0% - 1.5% ] 1.03% | 486 | 2.7% |
[ 1.0% - 1.5% ] 1.05% | 5,598 | 4.5% |
[ 1.0% - 1.5% ] 1.08% | 3,966 | 2.1% |
[ 1.0% - 1.5% ] 1.11% | 17,625 | 1.6% |
[ 1.0% - 1.5% ] 1.13% | 3,999 | 2.2% |
[ 1.0% - 1.5% ] 1.15% | 34,752 | 5.3% |
[ 1.0% - 1.5% ] 1.25% | 38,209 | 6.2% |
[ 1.0% - 1.5% ] 1.31% | 70,431 | 2.9% |
[ 1.0% - 1.5% ] 1.34% | 18,141 | 5.1% |
[ 1.0% - 1.5% ] 1.35% | 2,444 | 2.2% |
[ 1.0% - 1.5% ] 1.41% | 8,801 | 2.1% |
[ 1.0% - 1.5% ] 1.50% | 2,739 | 2.5% |
[ 1.5% - 2.0% ] 1.52% | 330 | 2.7% |
[ 1.5% - 2.0% ] 1.55% | 1,875 | 4.2% |
[ 1.5% - 2.0% ] 1.57% | 23,740 | 1.1% |
[ 1.5% - 2.0% ] 1.60% | 811 | 3.0% |
[ 1.5% - 2.0% ] 1.79% | 20,401 | 5.3% |
[ 1.5% - 2.0% ] 1.85% | 6,914 | 0.97% |
[ 2.0% - 2.5% ] 2.32% | 29,870 | 8.9% |
[ 2.0% - 2.5% ] 2.45% | 286 | 6.4% |
[ 2.5% - 3.0% ] 2.78% | 2,442 | 8.6% |
[ 7.0% - 7.5% ] 7.44% | 766 | 2.5% |
[ 10.0% - 10.5% ] 10.30% | 398 | 5.9% |