Guyanese Married-Couple Family Poverty
COMPARE
Guyanese
Select to Compare
Married-Couple Family Poverty
Guyanese Married-Couple Family Poverty
6.5%
POVERTY | MARRIED-COUPLE FAMILIES
0.0/ 100
METRIC RATING
286th/ 347
METRIC RANK
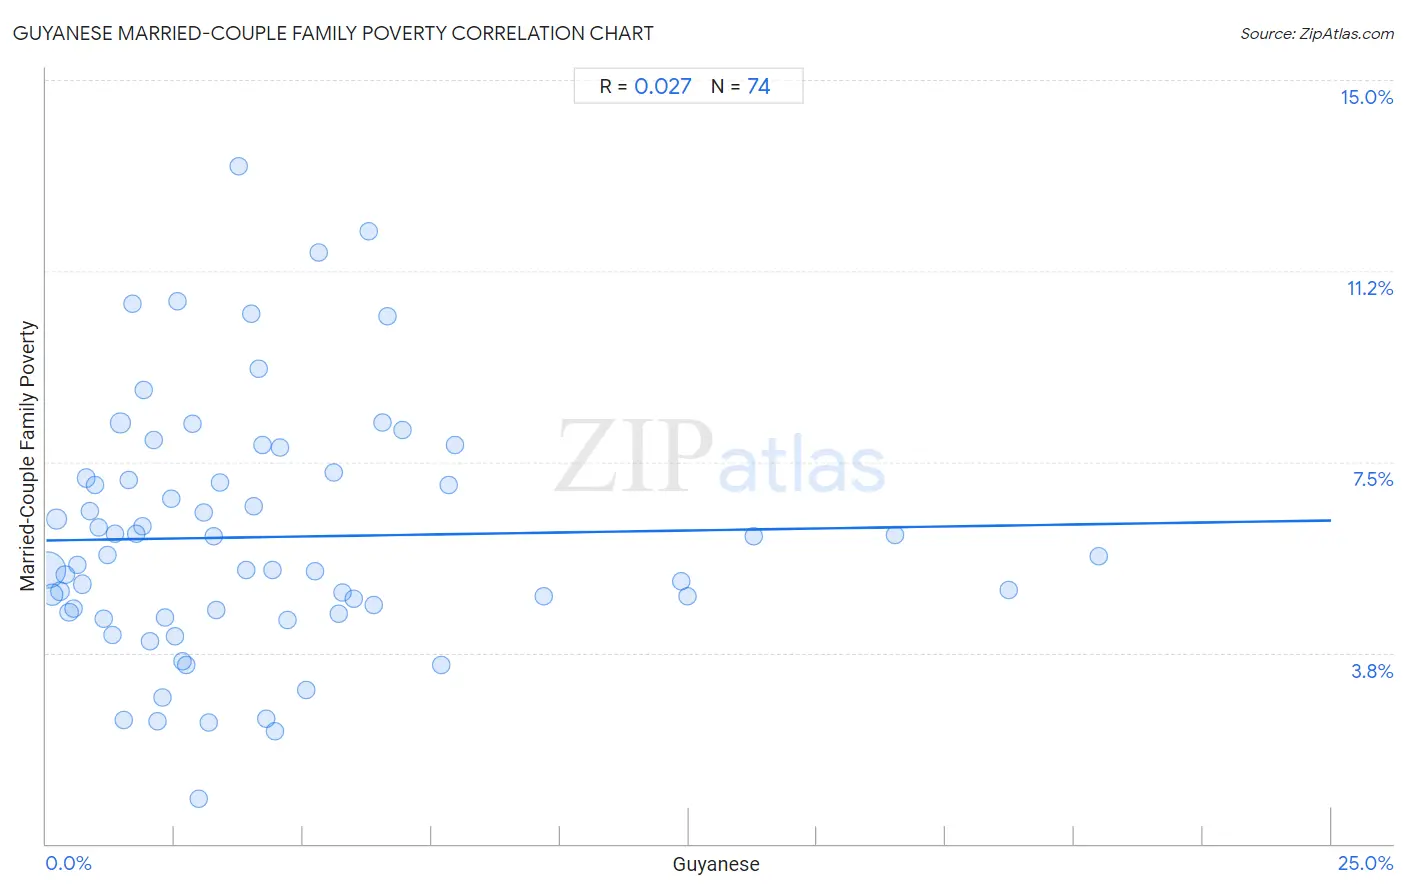
Guyanese Married-Couple Family Poverty Correlation Chart
The statistical analysis conducted on geographies consisting of 175,831,984 people shows no correlation between the proportion of Guyanese and poverty level among married-couple families in the United States with a correlation coefficient (R) of 0.027 and weighted average of 6.5%. On average, for every 1% (one percent) increase in Guyanese within a typical geography, there is an increase of 0.016% in poverty level among married-couple families.
It is essential to understand that the correlation between the percentage of Guyanese and poverty level among married-couple families does not imply a direct cause-and-effect relationship. It remains uncertain whether the presence of Guyanese influences an upward or downward trend in the level of poverty level among married-couple families within an area, or if Guyanese simply ended up residing in those areas with higher or lower levels of poverty level among married-couple families due to other factors.
Demographics Similar to Guyanese by Married-Couple Family Poverty
In terms of married-couple family poverty, the demographic groups most similar to Guyanese are Black/African American (6.5%, a difference of 0.10%), Ecuadorian (6.5%, a difference of 0.37%), Salvadoran (6.5%, a difference of 0.56%), Dutch West Indian (6.4%, a difference of 0.61%), and Ute (6.4%, a difference of 0.73%).
| Demographics | Rating | Rank | Married-Couple Family Poverty |
| Houma | 0.0 /100 | #279 | Tragic 6.4% |
| West Indians | 0.0 /100 | #280 | Tragic 6.4% |
| Mexican American Indians | 0.0 /100 | #281 | Tragic 6.4% |
| Seminole | 0.0 /100 | #282 | Tragic 6.4% |
| Ute | 0.0 /100 | #283 | Tragic 6.4% |
| Dutch West Indians | 0.0 /100 | #284 | Tragic 6.4% |
| Blacks/African Americans | 0.0 /100 | #285 | Tragic 6.5% |
| Guyanese | 0.0 /100 | #286 | Tragic 6.5% |
| Ecuadorians | 0.0 /100 | #287 | Tragic 6.5% |
| Salvadorans | 0.0 /100 | #288 | Tragic 6.5% |
| Nepalese | 0.0 /100 | #289 | Tragic 6.5% |
| Immigrants from Barbados | 0.0 /100 | #290 | Tragic 6.5% |
| Belizeans | 0.0 /100 | #291 | Tragic 6.5% |
| Immigrants from Lebanon | 0.0 /100 | #292 | Tragic 6.6% |
| Arapaho | 0.0 /100 | #293 | Tragic 6.6% |
Guyanese Married-Couple Family Poverty Correlation Summary
| Measurement | Guyanese Data | Married-Couple Family Poverty Data |
| Minimum | 0.028% | 0.88% |
| Maximum | 20.5% | 13.3% |
| Range | 20.5% | 12.4% |
| Mean | 4.2% | 6.0% |
| Median | 3.1% | 5.6% |
| Interquartile 25% (IQ1) | 1.5% | 4.6% |
| Interquartile 75% (IQ3) | 5.6% | 7.2% |
| Interquartile Range (IQR) | 4.1% | 2.6% |
| Standard Deviation (Sample) | 4.2% | 2.4% |
| Standard Deviation (Population) | 4.1% | 2.4% |
Correlation Details
| Guyanese Percentile | Sample Size | Married-Couple Family Poverty |
[ 0.0% - 0.5% ] 0.028% | 105,506,099 | 5.4% |
[ 0.0% - 0.5% ] 0.12% | 24,437,893 | 4.9% |
[ 0.0% - 0.5% ] 0.20% | 10,394,300 | 6.4% |
[ 0.0% - 0.5% ] 0.28% | 7,178,092 | 5.0% |
[ 0.0% - 0.5% ] 0.37% | 3,867,088 | 5.3% |
[ 0.0% - 0.5% ] 0.45% | 2,707,904 | 4.6% |
[ 0.5% - 1.0% ] 0.53% | 1,895,316 | 4.6% |
[ 0.5% - 1.0% ] 0.61% | 1,351,031 | 5.5% |
[ 0.5% - 1.0% ] 0.71% | 1,728,874 | 5.1% |
[ 0.5% - 1.0% ] 0.78% | 807,989 | 7.2% |
[ 0.5% - 1.0% ] 0.86% | 1,622,641 | 6.5% |
[ 0.5% - 1.0% ] 0.94% | 230,530 | 7.0% |
[ 1.0% - 1.5% ] 1.02% | 711,380 | 6.2% |
[ 1.0% - 1.5% ] 1.11% | 319,804 | 4.4% |
[ 1.0% - 1.5% ] 1.19% | 172,875 | 5.7% |
[ 1.0% - 1.5% ] 1.28% | 160,846 | 4.1% |
[ 1.0% - 1.5% ] 1.34% | 185,741 | 6.1% |
[ 1.0% - 1.5% ] 1.44% | 9,097,353 | 8.3% |
[ 1.5% - 2.0% ] 1.51% | 84,339 | 2.4% |
[ 1.5% - 2.0% ] 1.60% | 80,123 | 7.2% |
[ 1.5% - 2.0% ] 1.68% | 117,922 | 10.6% |
[ 1.5% - 2.0% ] 1.76% | 127,215 | 6.1% |
[ 1.5% - 2.0% ] 1.86% | 86,654 | 6.2% |
[ 1.5% - 2.0% ] 1.91% | 138,773 | 8.9% |
[ 2.0% - 2.5% ] 2.01% | 31,385 | 4.0% |
[ 2.0% - 2.5% ] 2.09% | 152,542 | 7.9% |
[ 2.0% - 2.5% ] 2.16% | 35,059 | 2.4% |
[ 2.0% - 2.5% ] 2.26% | 101,567 | 2.9% |
[ 2.0% - 2.5% ] 2.32% | 39,894 | 4.4% |
[ 2.0% - 2.5% ] 2.43% | 55,283 | 6.8% |
[ 2.0% - 2.5% ] 2.50% | 13,601 | 4.1% |
[ 2.5% - 3.0% ] 2.56% | 110,764 | 10.7% |
[ 2.5% - 3.0% ] 2.64% | 10,531 | 3.6% |
[ 2.5% - 3.0% ] 2.72% | 87,187 | 3.5% |
[ 2.5% - 3.0% ] 2.84% | 94,949 | 8.2% |
[ 2.5% - 3.0% ] 2.97% | 43,396 | 0.88% |
[ 3.0% - 3.5% ] 3.07% | 101,895 | 6.5% |
[ 3.0% - 3.5% ] 3.15% | 71,908 | 2.4% |
[ 3.0% - 3.5% ] 3.25% | 47,755 | 6.1% |
[ 3.0% - 3.5% ] 3.31% | 41,511 | 4.6% |
[ 3.0% - 3.5% ] 3.39% | 60,268 | 7.1% |
[ 3.5% - 4.0% ] 3.75% | 118,386 | 13.3% |
[ 3.5% - 4.0% ] 3.89% | 156,163 | 5.4% |
[ 3.5% - 4.0% ] 3.98% | 72,273 | 10.4% |
[ 4.0% - 4.5% ] 4.04% | 7,284 | 6.6% |
[ 4.0% - 4.5% ] 4.14% | 11,110 | 9.3% |
[ 4.0% - 4.5% ] 4.22% | 14,367 | 7.8% |
[ 4.0% - 4.5% ] 4.27% | 6,529 | 2.4% |
[ 4.0% - 4.5% ] 4.40% | 39,557 | 5.4% |
[ 4.0% - 4.5% ] 4.46% | 112,110 | 2.2% |
[ 4.5% - 5.0% ] 4.56% | 64,268 | 7.8% |
[ 4.5% - 5.0% ] 4.68% | 131,608 | 4.4% |
[ 5.0% - 5.5% ] 5.05% | 137,948 | 3.0% |
[ 5.0% - 5.5% ] 5.24% | 68,879 | 5.3% |
[ 5.0% - 5.5% ] 5.31% | 21,901 | 11.6% |
[ 5.5% - 6.0% ] 5.60% | 49,391 | 7.3% |
[ 5.5% - 6.0% ] 5.70% | 31,953 | 4.5% |
[ 5.5% - 6.0% ] 5.75% | 16,374 | 4.9% |
[ 5.5% - 6.0% ] 5.99% | 25,187 | 4.8% |
[ 6.0% - 6.5% ] 6.26% | 2,219 | 12.0% |
[ 6.0% - 6.5% ] 6.37% | 35,154 | 4.7% |
[ 6.5% - 7.0% ] 6.54% | 68,476 | 8.3% |
[ 6.5% - 7.0% ] 6.63% | 108,180 | 10.4% |
[ 6.5% - 7.0% ] 6.93% | 27,794 | 8.1% |
[ 7.5% - 8.0% ] 7.68% | 8,128 | 3.5% |
[ 7.5% - 8.0% ] 7.83% | 138,467 | 7.0% |
[ 7.5% - 8.0% ] 7.96% | 31,200 | 7.8% |
[ 9.5% - 10.0% ] 9.68% | 38,865 | 4.9% |
[ 12.0% - 12.5% ] 12.35% | 7,863 | 5.1% |
[ 12.0% - 12.5% ] 12.47% | 21,349 | 4.9% |
[ 13.5% - 14.0% ] 13.78% | 29,921 | 6.0% |
[ 16.5% - 17.0% ] 16.52% | 19,554 | 6.1% |
[ 18.5% - 19.0% ] 18.74% | 48,096 | 5.0% |
[ 20.0% - 20.5% ] 20.48% | 51,153 | 5.6% |