Hawaiian Married-Couple Family Poverty
COMPARE
Hawaiian
Select to Compare
Married-Couple Family Poverty
Hawaiian Married-Couple Family Poverty
5.1%
POVERTY | MARRIED-COUPLE FAMILIES
62.3/ 100
METRIC RATING
164th/ 347
METRIC RANK
Hawaiian Married-Couple Family Poverty Correlation Chart
The statistical analysis conducted on geographies consisting of 325,605,449 people shows a poor positive correlation between the proportion of Hawaiians and poverty level among married-couple families in the United States with a correlation coefficient (R) of 0.198 and weighted average of 5.1%. On average, for every 1% (one percent) increase in Hawaiians within a typical geography, there is an increase of 0.052% in poverty level among married-couple families.
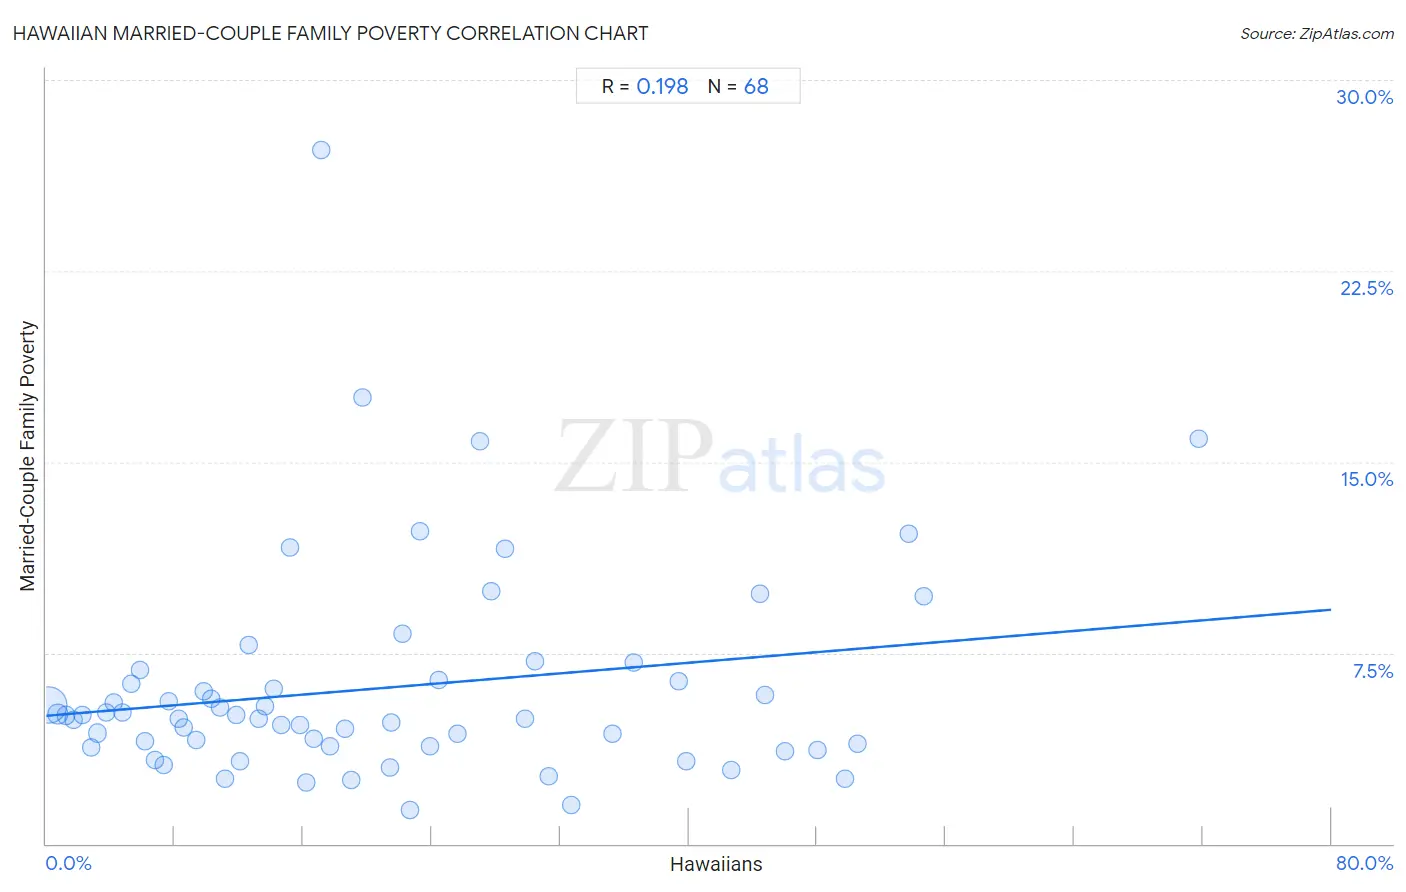
It is essential to understand that the correlation between the percentage of Hawaiians and poverty level among married-couple families does not imply a direct cause-and-effect relationship. It remains uncertain whether the presence of Hawaiians influences an upward or downward trend in the level of poverty level among married-couple families within an area, or if Hawaiians simply ended up residing in those areas with higher or lower levels of poverty level among married-couple families due to other factors.
Demographics Similar to Hawaiians by Married-Couple Family Poverty
In terms of married-couple family poverty, the demographic groups most similar to Hawaiians are Immigrants from Malaysia (5.1%, a difference of 0.010%), Paraguayan (5.1%, a difference of 0.10%), Costa Rican (5.1%, a difference of 0.10%), Sierra Leonean (5.1%, a difference of 0.24%), and Immigrants from Jordan (5.1%, a difference of 0.55%).
| Demographics | Rating | Rank | Married-Couple Family Poverty |
| Argentineans | 70.7 /100 | #157 | Good 5.1% |
| Immigrants from South Eastern Asia | 70.4 /100 | #158 | Good 5.1% |
| Immigrants from Saudi Arabia | 70.3 /100 | #159 | Good 5.1% |
| Pennsylvania Germans | 68.5 /100 | #160 | Good 5.1% |
| Ethiopians | 68.1 /100 | #161 | Good 5.1% |
| Immigrants from Jordan | 66.5 /100 | #162 | Good 5.1% |
| Sierra Leoneans | 64.1 /100 | #163 | Good 5.1% |
| Hawaiians | 62.3 /100 | #164 | Good 5.1% |
| Immigrants from Malaysia | 62.2 /100 | #165 | Good 5.1% |
| Paraguayans | 61.5 /100 | #166 | Good 5.1% |
| Costa Ricans | 61.5 /100 | #167 | Good 5.1% |
| Immigrants from Uganda | 54.9 /100 | #168 | Average 5.2% |
| Ottawa | 54.5 /100 | #169 | Average 5.2% |
| Immigrants from Argentina | 54.4 /100 | #170 | Average 5.2% |
| Bermudans | 52.9 /100 | #171 | Average 5.2% |
Hawaiian Married-Couple Family Poverty Correlation Summary
| Measurement | Hawaiian Data | Married-Couple Family Poverty Data |
| Minimum | 0.13% | 1.3% |
| Maximum | 71.7% | 27.3% |
| Range | 71.6% | 26.0% |
| Mean | 21.0% | 6.1% |
| Median | 16.9% | 5.0% |
| Interquartile 25% (IQ1) | 8.4% | 3.8% |
| Interquartile 75% (IQ3) | 30.1% | 6.4% |
| Interquartile Range (IQR) | 21.7% | 2.6% |
| Standard Deviation (Sample) | 16.1% | 4.2% |
| Standard Deviation (Population) | 16.0% | 4.2% |
Correlation Details
| Hawaiian Percentile | Sample Size | Married-Couple Family Poverty |
[ 0.0% - 0.5% ] 0.13% | 277,733,410 | 5.5% |
[ 0.5% - 1.0% ] 0.71% | 27,697,514 | 5.1% |
[ 1.0% - 1.5% ] 1.22% | 8,060,793 | 5.0% |
[ 1.5% - 2.0% ] 1.73% | 4,581,356 | 4.9% |
[ 2.0% - 2.5% ] 2.23% | 1,368,062 | 5.1% |
[ 2.5% - 3.0% ] 2.78% | 1,243,346 | 3.8% |
[ 3.0% - 3.5% ] 3.22% | 866,747 | 4.3% |
[ 3.5% - 4.0% ] 3.72% | 501,662 | 5.1% |
[ 4.0% - 4.5% ] 4.19% | 474,482 | 5.5% |
[ 4.5% - 5.0% ] 4.73% | 334,632 | 5.2% |
[ 5.0% - 5.5% ] 5.27% | 206,044 | 6.3% |
[ 5.5% - 6.0% ] 5.86% | 69,880 | 6.8% |
[ 6.0% - 6.5% ] 6.13% | 104,672 | 4.0% |
[ 6.5% - 7.0% ] 6.78% | 151,473 | 3.3% |
[ 7.0% - 7.5% ] 7.31% | 335,429 | 3.1% |
[ 7.5% - 8.0% ] 7.64% | 120,795 | 5.6% |
[ 8.0% - 8.5% ] 8.24% | 93,802 | 4.9% |
[ 8.5% - 9.0% ] 8.53% | 377,311 | 4.6% |
[ 9.0% - 9.5% ] 9.33% | 135,174 | 4.1% |
[ 9.5% - 10.0% ] 9.77% | 130,437 | 6.0% |
[ 10.0% - 10.5% ] 10.28% | 85,502 | 5.7% |
[ 10.5% - 11.0% ] 10.78% | 179,490 | 5.3% |
[ 11.0% - 11.5% ] 11.15% | 16,192 | 2.6% |
[ 11.5% - 12.0% ] 11.83% | 77,689 | 5.1% |
[ 12.0% - 12.5% ] 12.07% | 66,209 | 3.2% |
[ 12.5% - 13.0% ] 12.64% | 41,868 | 7.8% |
[ 13.0% - 13.5% ] 13.23% | 95,035 | 4.9% |
[ 13.5% - 14.0% ] 13.63% | 16,410 | 5.4% |
[ 14.0% - 14.5% ] 14.14% | 124,786 | 6.1% |
[ 14.5% - 15.0% ] 14.63% | 70,200 | 4.7% |
[ 15.0% - 15.5% ] 15.15% | 3,484 | 11.6% |
[ 15.5% - 16.0% ] 15.77% | 17,516 | 4.6% |
[ 16.0% - 16.5% ] 16.21% | 7,704 | 2.4% |
[ 16.5% - 17.0% ] 16.66% | 4,526 | 4.1% |
[ 17.0% - 17.5% ] 17.14% | 210 | 27.3% |
[ 17.5% - 18.0% ] 17.69% | 1,984 | 3.8% |
[ 18.5% - 19.0% ] 18.63% | 7,645 | 4.5% |
[ 19.0% - 19.5% ] 19.00% | 2,489 | 2.5% |
[ 19.5% - 20.0% ] 19.70% | 7,238 | 17.5% |
[ 21.0% - 21.5% ] 21.39% | 2,211 | 3.0% |
[ 21.5% - 22.0% ] 21.52% | 3,221 | 4.8% |
[ 22.0% - 22.5% ] 22.19% | 6,626 | 8.3% |
[ 22.5% - 23.0% ] 22.66% | 11,029 | 1.3% |
[ 23.0% - 23.5% ] 23.27% | 2,742 | 12.3% |
[ 23.5% - 24.0% ] 23.91% | 4,555 | 3.8% |
[ 24.0% - 24.5% ] 24.41% | 254 | 6.5% |
[ 25.5% - 26.0% ] 25.61% | 5,267 | 4.3% |
[ 27.0% - 27.5% ] 27.01% | 1,666 | 15.8% |
[ 27.5% - 28.0% ] 27.74% | 2,967 | 9.9% |
[ 28.5% - 29.0% ] 28.59% | 1,462 | 11.6% |
[ 29.5% - 30.0% ] 29.77% | 6,694 | 4.9% |
[ 30.0% - 30.5% ] 30.47% | 2,872 | 7.2% |
[ 31.0% - 31.5% ] 31.25% | 5,891 | 2.7% |
[ 32.5% - 33.0% ] 32.69% | 10,307 | 1.5% |
[ 35.0% - 35.5% ] 35.24% | 4,827 | 4.3% |
[ 36.5% - 37.0% ] 36.58% | 4,284 | 7.1% |
[ 39.0% - 39.5% ] 39.37% | 10,042 | 6.4% |
[ 39.5% - 40.0% ] 39.87% | 4,475 | 3.2% |
[ 42.5% - 43.0% ] 42.64% | 12,114 | 2.9% |
[ 44.0% - 44.5% ] 44.46% | 902 | 9.8% |
[ 44.5% - 45.0% ] 44.73% | 65,116 | 5.8% |
[ 45.5% - 46.0% ] 45.96% | 3,133 | 3.6% |
[ 47.5% - 48.0% ] 47.99% | 398 | 3.7% |
[ 49.5% - 50.0% ] 49.74% | 380 | 2.6% |
[ 50.0% - 50.5% ] 50.47% | 2,853 | 3.9% |
[ 53.5% - 54.0% ] 53.69% | 2,157 | 12.2% |
[ 54.5% - 55.0% ] 54.63% | 12,370 | 9.7% |
[ 71.5% - 72.0% ] 71.73% | 1,436 | 15.9% |