Luxembourger Married-Couple Family Poverty

COMPARE

Luxembourger
Race
Ancestry
AfghanAfricanAlaska NativeAlaskan AthabascanAlbanianAleutAlsatianAmericanApacheArabArapahoArgentineanArmenianAssyrian/Chaldean/SyriacAustralianAustrianBahamianBangladeshiBarbadianBasqueBelgianBelizeanBermudanBhutaneseBlackfeetBolivianBrazilianBritishBritish West IndianBulgarianBurmeseCajunCambodianCanadianCape VerdeanCarpatho RusynCelticCentral AmericanCentral American IndianCherokeeCheyenneChickasawChileanChineseChippewaChoctawColombianColvilleComancheCosta RicanCreeCreekCroatianCrowCubanCypriotCzechCzechoslovakianDanishDelawareDominicanDutchDutch West IndianEastern EuropeanEcuadorianEgyptianEnglishEstonianEthiopianEuropeanFijianFilipinoFinnishFrenchFrench American IndianFrench CanadianGermanGerman RussianGhanaianGreekGuamanian/ChamorroGuatemalanGuyaneseHaitianHmongHonduranHopiHoumaHungarianIcelanderIndian (Asian)IndonesianInupiatIranianIraqiIrishIroquoisIsraeliItalianJamaicanJapaneseJordanianKenyanKiowaKoreanLaotianLatvianLebaneseLiberianLithuanianLumbeeLuxembourgerMacedonianMalaysianMalteseMarshalleseMenomineeMexicanMexican American IndianMongolianMoroccanNative HawaiianNavajoNepaleseNew ZealanderNicaraguanNigerianNorthern EuropeanNorwegianOkinawanOsageOttawaPaiutePakistaniPalestinianPanamanianParaguayanPennsylvania GermanPeruvianPimaPolishPortuguesePotawatomiPuebloPuerto RicanPuget Sound SalishRomanianRussianSalvadoranSamoanScandinavianScotch-IrishScottishSeminoleSenegaleseSerbianShoshoneSierra LeoneanSiouxSlavicSlovakSloveneSomaliSouth AfricanSouth AmericanSouth American IndianSoviet UnionSpaniardSpanishSpanish AmericanSpanish American IndianSri LankanSubsaharan AfricanSudaneseSwedishSwissSyrianTaiwaneseThaiTlingit-HaidaTohono O'OdhamTonganTrinidadian and TobagonianTsimshianTurkishU.S. Virgin IslanderUgandanUkrainianUruguayanUteVenezuelanVietnameseWelshWest IndianYakamaYaquiYugoslavianYumanYup'ikZimbabwean
Immigration
NonimmigrantsImmigrantsAfghanistanAfricaAlbaniaArgentinaArmeniaAsiaAustraliaAustriaBahamasBangladeshBarbadosBelarusBelgiumBelizeBoliviaBosnia and HerzegovinaBrazilBulgariaBurma/MyanmarCabo VerdeCambodiaCameroonCanadaCaribbeanCentral AmericaChileChinaColombiaCongoCosta RicaCroatiaCubaCzechoslovakiaDenmarkDominicaDominican RepublicEastern AfricaEastern AsiaEastern EuropeEcuadorEgyptEl SalvadorEnglandEritreaEthiopiaEuropeFijiFranceGermanyGhanaGreeceGrenadaGuatemalaGuyanaHaitiHondurasHong KongHungaryIndiaIndonesiaIranIraqIrelandIsraelItalyJamaicaJapanJordanKazakhstanKenyaKoreaKuwaitLaosLatin AmericaLatviaLebanonLiberiaLithuaniaMalaysiaMexicoMicronesiaMiddle AfricaMoldovaMoroccoNepalNetherlandsNicaraguaNigeriaNorth AmericaNorth MacedoniaNorthern AfricaNorthern EuropeNorwayOceaniaPakistanPanamaPeruPhilippinesPolandPortugalRomaniaRussiaSaudi ArabiaScotlandSenegalSerbiaSierra LeoneSingaporeSomaliaSouth AfricaSouth AmericaSouth Central AsiaSouth Eastern AsiaSouthern EuropeSpainSri LankaSt. Vincent and the GrenadinesSudanSwedenSwitzerlandSyriaTaiwanThailandTrinidad and TobagoTurkeyUgandaUkraineUruguayUzbekistanVenezuelaVietnamWest IndiesWestern AfricaWestern AsiaWestern EuropeYemenZaireZimbabweAzores
Select to Compare
Race
Ancestry
AfghanAfricanAlaska NativeAlaskan AthabascanAlbanianAleutAlsatianAmericanApacheArabArapahoArgentineanArmenianAssyrian/Chaldean/SyriacAustralianAustrianBahamianBangladeshiBarbadianBasqueBelgianBelizeanBermudanBhutaneseBlackfeetBolivianBrazilianBritishBritish West IndianBulgarianBurmeseCajunCambodianCanadianCape VerdeanCarpatho RusynCelticCentral AmericanCentral American IndianCherokeeCheyenneChickasawChileanChineseChippewaChoctawColombianColvilleComancheCosta RicanCreeCreekCroatianCrowCubanCypriotCzechCzechoslovakianDanishDelawareDominicanDutchDutch West IndianEastern EuropeanEcuadorianEgyptianEnglishEstonianEthiopianEuropeanFijianFilipinoFinnishFrenchFrench American IndianFrench CanadianGermanGerman RussianGhanaianGreekGuamanian/ChamorroGuatemalanGuyaneseHaitianHmongHonduranHopiHoumaHungarianIcelanderIndian (Asian)IndonesianInupiatIranianIraqiIrishIroquoisIsraeliItalianJamaicanJapaneseJordanianKenyanKiowaKoreanLaotianLatvianLebaneseLiberianLithuanianLumbeeMacedonianMalaysianMalteseMarshalleseMenomineeMexicanMexican American IndianMongolianMoroccanNative HawaiianNavajoNepaleseNew ZealanderNicaraguanNigerianNorthern EuropeanNorwegianOkinawanOsageOttawaPaiutePakistaniPalestinianPanamanianParaguayanPennsylvania GermanPeruvianPimaPolishPortuguesePotawatomiPuebloPuerto RicanPuget Sound SalishRomanianRussianSalvadoranSamoanScandinavianScotch-IrishScottishSeminoleSenegaleseSerbianShoshoneSierra LeoneanSiouxSlavicSlovakSloveneSomaliSouth AfricanSouth AmericanSouth American IndianSoviet UnionSpaniardSpanishSpanish AmericanSpanish American IndianSri LankanSubsaharan AfricanSudaneseSwedishSwissSyrianTaiwaneseThaiTlingit-HaidaTohono O'OdhamTonganTrinidadian and TobagonianTsimshianTurkishU.S. Virgin IslanderUgandanUkrainianUruguayanUteVenezuelanVietnameseWelshWest IndianYakamaYaquiYugoslavianYumanYup'ikZimbabwean
Immigration
NonimmigrantsImmigrantsAfghanistanAfricaAlbaniaArgentinaArmeniaAsiaAustraliaAustriaBahamasBangladeshBarbadosBelarusBelgiumBelizeBoliviaBosnia and HerzegovinaBrazilBulgariaBurma/MyanmarCabo VerdeCambodiaCameroonCanadaCaribbeanCentral AmericaChileChinaColombiaCongoCosta RicaCroatiaCubaCzechoslovakiaDenmarkDominicaDominican RepublicEastern AfricaEastern AsiaEastern EuropeEcuadorEgyptEl SalvadorEnglandEritreaEthiopiaEuropeFijiFranceGermanyGhanaGreeceGrenadaGuatemalaGuyanaHaitiHondurasHong KongHungaryIndiaIndonesiaIranIraqIrelandIsraelItalyJamaicaJapanJordanKazakhstanKenyaKoreaKuwaitLaosLatin AmericaLatviaLebanonLiberiaLithuaniaMalaysiaMexicoMicronesiaMiddle AfricaMoldovaMoroccoNepalNetherlandsNicaraguaNigeriaNorth AmericaNorth MacedoniaNorthern AfricaNorthern EuropeNorwayOceaniaPakistanPanamaPeruPhilippinesPolandPortugalRomaniaRussiaSaudi ArabiaScotlandSenegalSerbiaSierra LeoneSingaporeSomaliaSouth AfricaSouth AmericaSouth Central AsiaSouth Eastern AsiaSouthern EuropeSpainSri LankaSt. Vincent and the GrenadinesSudanSwedenSwitzerlandSyriaTaiwanThailandTrinidad and TobagoTurkeyUgandaUkraineUruguayUzbekistanVenezuelaVietnamWest IndiesWestern AfricaWestern AsiaWestern EuropeYemenZaireZimbabweAzores
Married-Couple Family Poverty
Income
Poverty
Unemployment
Labor Participation
Family Structure
Vehicle Availability
Education Level
Disability

Luxembourger Married-Couple Family Poverty
Exceptional

3.9%
POVERTY | MARRIED-COUPLE FAMILIES
100.0/ 100
METRIC RATING
6th/ 347
METRIC RANK

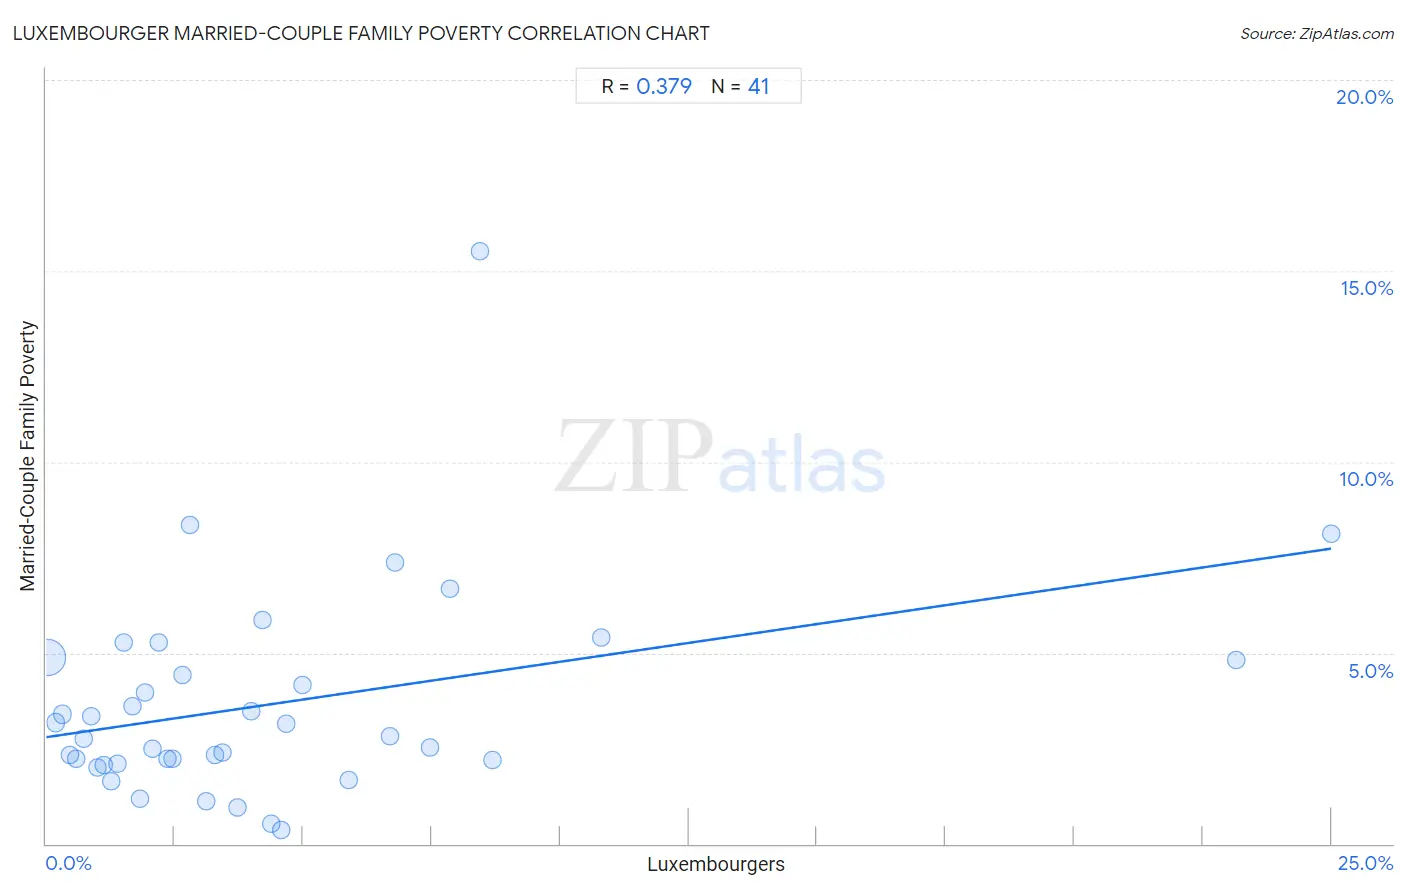
Luxembourger Married-Couple Family Poverty Correlation Chart

The statistical analysis conducted on geographies consisting of 143,792,583 people shows a mild positive correlation between the proportion of Luxembourgers and poverty level among married-couple families in the United States with a correlation coefficient (R) of 0.379 and weighted average of 3.9%. On average, for every 1% (one percent) increase in Luxembourgers within a typical geography, there is an increase of 0.20% in poverty level among married-couple families.
Luxembourger Married-Couple Family Poverty
It is essential to understand that the correlation between the percentage of Luxembourgers and poverty level among married-couple families does not imply a direct cause-and-effect relationship. It remains uncertain whether the presence of Luxembourgers influences an upward or downward trend in the level of poverty level among married-couple families within an area, or if Luxembourgers simply ended up residing in those areas with higher or lower levels of poverty level among married-couple families due to other factors.

Demographics Similar to Luxembourgers by Married-Couple Family Poverty

In terms of married-couple family poverty, the demographic groups most similar to Luxembourgers are Latvian (3.9%, a difference of 0.52%), Swedish (3.9%, a difference of 0.61%), Slovene (3.8%, a difference of 0.76%), Thai (3.9%, a difference of 1.1%), and Croatian (3.9%, a difference of 1.5%).
DemographicsRating | RankMarried-Couple Family Poverty
Immigrants from India
100.0
/100
|
#1
Exceptional
3.6%
Chinese
100.0
/100
|
#2
Exceptional
3.6%
Norwegians
100.0
/100
|
#3
Exceptional
3.7%
Slovenes
100.0
/100
|
#4
Exceptional
3.8%
Swedes
100.0
/100
|
#5
Exceptional
3.9%
Luxembourgers
100.0
/100
|
#6
Exceptional
3.9%
Latvians
100.0
/100
|
#7
Exceptional
3.9%
Thais
100.0
/100
|
#8
Exceptional
3.9%
Croatians
100.0
/100
|
#9
Exceptional
3.9%
Carpatho Rusyns
100.0
/100
|
#10
Exceptional
3.9%
Lithuanians
100.0
/100
|
#11
Exceptional
4.0%
Bulgarians
100.0
/100
|
#12
Exceptional
4.0%
Czechs
100.0
/100
|
#13
Exceptional
4.0%
Slovaks
100.0
/100
|
#14
Exceptional
4.0%
Poles
100.0
/100
|
#15
Exceptional
4.0%

Luxembourger Married-Couple Family Poverty Correlation Summary

MeasurementLuxembourger DataMarried-Couple Family Poverty Data
Minimum0.026%0.35%
Maximum25.0%15.5%
Range25.0%15.1%
Mean4.4%3.7%
Median2.8%2.8%
Interquartile 25% (IQ1)1.3%2.1%
Interquartile 75% (IQ3)5.4%4.8%
Interquartile Range (IQR)4.1%2.7%
Standard Deviation (Sample)5.2%2.7%
Standard Deviation (Population)5.2%2.7%

Correlation Details

Luxembourger PercentileSample SizeMarried-Couple Family Poverty
[
0.0%
-
0.5%
]
0.026%
132,861,4004.9%
[
0.0%
-
0.5%
]
0.18%
7,417,3683.2%
[
0.0%
-
0.5%
]
0.32%
1,461,6973.4%
[
0.0%
-
0.5%
]
0.46%
821,1262.3%
[
0.5%
-
1.0%
]
0.59%
397,3102.2%
[
0.5%
-
1.0%
]
0.73%
183,8062.7%
[
0.5%
-
1.0%
]
0.88%
165,5173.3%
[
1.0%
-
1.5%
]
1.01%
87,2822.0%
[
1.0%
-
1.5%
]
1.12%
48,3592.1%
[
1.0%
-
1.5%
]
1.27%
39,5201.7%
[
1.0%
-
1.5%
]
1.39%
107,0562.1%
[
1.5%
-
2.0%
]
1.51%
32,3495.3%
[
1.5%
-
2.0%
]
1.67%
13,0153.6%
[
1.5%
-
2.0%
]
1.81%
60,0171.2%
[
1.5%
-
2.0%
]
1.93%
3,9954.0%
[
2.0%
-
2.5%
]
2.06%
18,9902.5%
[
2.0%
-
2.5%
]
2.20%
7,6935.3%
[
2.0%
-
2.5%
]
2.36%
14,1392.2%
[
2.0%
-
2.5%
]
2.45%
3,9222.2%
[
2.5%
-
3.0%
]
2.66%
3,4264.4%
[
2.5%
-
3.0%
]
2.80%
1438.3%
[
3.0%
-
3.5%
]
3.12%
1,7631.1%
[
3.0%
-
3.5%
]
3.27%
6,2322.3%
[
3.0%
-
3.5%
]
3.44%
9602.4%
[
3.5%
-
4.0%
]
3.72%
1,9100.94%
[
3.5%
-
4.0%
]
3.98%
5,0293.5%
[
4.0%
-
4.5%
]
4.21%
2,4465.9%
[
4.0%
-
4.5%
]
4.39%
3,3270.51%
[
4.5%
-
5.0%
]
4.56%
2,4330.35%
[
4.5%
-
5.0%
]
4.67%
1,0703.2%
[
4.5%
-
5.0%
]
4.99%
3,8054.2%
[
5.5%
-
6.0%
]
5.88%
5,4421.7%
[
6.5%
-
7.0%
]
6.69%
1,1362.8%
[
6.5%
-
7.0%
]
6.78%
6787.4%
[
7.0%
-
7.5%
]
7.46%
3,0432.5%
[
7.5%
-
8.0%
]
7.87%
2676.7%
[
8.0%
-
8.5%
]
8.43%
1,28115.5%
[
8.5%
-
9.0%
]
8.69%
2,0952.2%
[
10.5%
-
11.0%
]
10.80%
2875.4%
[
23.0%
-
23.5%
]
23.16%
9934.8%
[
25.0%
-
25.5%
]
25.00%
2568.1%