Trinidadian and Tobagonian Married-Couple Family Poverty

COMPARE

Trinidadian and Tobagonian
Race
Ancestry
AfghanAfricanAlaska NativeAlaskan AthabascanAlbanianAleutAlsatianAmericanApacheArabArapahoArgentineanArmenianAssyrian/Chaldean/SyriacAustralianAustrianBahamianBangladeshiBarbadianBasqueBelgianBelizeanBermudanBhutaneseBlackfeetBolivianBrazilianBritishBritish West IndianBulgarianBurmeseCajunCambodianCanadianCape VerdeanCarpatho RusynCelticCentral AmericanCentral American IndianCherokeeCheyenneChickasawChileanChineseChippewaChoctawColombianColvilleComancheCosta RicanCreeCreekCroatianCrowCubanCypriotCzechCzechoslovakianDanishDelawareDominicanDutchDutch West IndianEastern EuropeanEcuadorianEgyptianEnglishEstonianEthiopianEuropeanFijianFilipinoFinnishFrenchFrench American IndianFrench CanadianGermanGerman RussianGhanaianGreekGuamanian/ChamorroGuatemalanGuyaneseHaitianHmongHonduranHopiHoumaHungarianIcelanderIndian (Asian)IndonesianInupiatIranianIraqiIrishIroquoisIsraeliItalianJamaicanJapaneseJordanianKenyanKiowaKoreanLaotianLatvianLebaneseLiberianLithuanianLumbeeLuxembourgerMacedonianMalaysianMalteseMarshalleseMenomineeMexicanMexican American IndianMongolianMoroccanNative HawaiianNavajoNepaleseNew ZealanderNicaraguanNigerianNorthern EuropeanNorwegianOkinawanOsageOttawaPaiutePakistaniPalestinianPanamanianParaguayanPennsylvania GermanPeruvianPimaPolishPortuguesePotawatomiPuebloPuerto RicanPuget Sound SalishRomanianRussianSalvadoranSamoanScandinavianScotch-IrishScottishSeminoleSenegaleseSerbianShoshoneSierra LeoneanSiouxSlavicSlovakSloveneSomaliSouth AfricanSouth AmericanSouth American IndianSoviet UnionSpaniardSpanishSpanish AmericanSpanish American IndianSri LankanSubsaharan AfricanSudaneseSwedishSwissSyrianTaiwaneseThaiTlingit-HaidaTohono O'OdhamTonganTrinidadian and TobagonianTsimshianTurkishU.S. Virgin IslanderUgandanUkrainianUruguayanUteVenezuelanVietnameseWelshWest IndianYakamaYaquiYugoslavianYumanYup'ikZimbabwean
Immigration
NonimmigrantsImmigrantsAfghanistanAfricaAlbaniaArgentinaArmeniaAsiaAustraliaAustriaBahamasBangladeshBarbadosBelarusBelgiumBelizeBoliviaBosnia and HerzegovinaBrazilBulgariaBurma/MyanmarCabo VerdeCambodiaCameroonCanadaCaribbeanCentral AmericaChileChinaColombiaCongoCosta RicaCroatiaCubaCzechoslovakiaDenmarkDominicaDominican RepublicEastern AfricaEastern AsiaEastern EuropeEcuadorEgyptEl SalvadorEnglandEritreaEthiopiaEuropeFijiFranceGermanyGhanaGreeceGrenadaGuatemalaGuyanaHaitiHondurasHong KongHungaryIndiaIndonesiaIranIraqIrelandIsraelItalyJamaicaJapanJordanKazakhstanKenyaKoreaKuwaitLaosLatin AmericaLatviaLebanonLiberiaLithuaniaMalaysiaMexicoMicronesiaMiddle AfricaMoldovaMoroccoNepalNetherlandsNicaraguaNigeriaNorth AmericaNorth MacedoniaNorthern AfricaNorthern EuropeNorwayOceaniaPakistanPanamaPeruPhilippinesPolandPortugalRomaniaRussiaSaudi ArabiaScotlandSenegalSerbiaSierra LeoneSingaporeSomaliaSouth AfricaSouth AmericaSouth Central AsiaSouth Eastern AsiaSouthern EuropeSpainSri LankaSt. Vincent and the GrenadinesSudanSwedenSwitzerlandSyriaTaiwanThailandTrinidad and TobagoTurkeyUgandaUkraineUruguayUzbekistanVenezuelaVietnamWest IndiesWestern AfricaWestern AsiaWestern EuropeYemenZaireZimbabweAzores
Select to Compare
Race
Ancestry
AfghanAfricanAlaska NativeAlaskan AthabascanAlbanianAleutAlsatianAmericanApacheArabArapahoArgentineanArmenianAssyrian/Chaldean/SyriacAustralianAustrianBahamianBangladeshiBarbadianBasqueBelgianBelizeanBermudanBhutaneseBlackfeetBolivianBrazilianBritishBritish West IndianBulgarianBurmeseCajunCambodianCanadianCape VerdeanCarpatho RusynCelticCentral AmericanCentral American IndianCherokeeCheyenneChickasawChileanChineseChippewaChoctawColombianColvilleComancheCosta RicanCreeCreekCroatianCrowCubanCypriotCzechCzechoslovakianDanishDelawareDominicanDutchDutch West IndianEastern EuropeanEcuadorianEgyptianEnglishEstonianEthiopianEuropeanFijianFilipinoFinnishFrenchFrench American IndianFrench CanadianGermanGerman RussianGhanaianGreekGuamanian/ChamorroGuatemalanGuyaneseHaitianHmongHonduranHopiHoumaHungarianIcelanderIndian (Asian)IndonesianInupiatIranianIraqiIrishIroquoisIsraeliItalianJamaicanJapaneseJordanianKenyanKiowaKoreanLaotianLatvianLebaneseLiberianLithuanianLumbeeLuxembourgerMacedonianMalaysianMalteseMarshalleseMenomineeMexicanMexican American IndianMongolianMoroccanNative HawaiianNavajoNepaleseNew ZealanderNicaraguanNigerianNorthern EuropeanNorwegianOkinawanOsageOttawaPaiutePakistaniPalestinianPanamanianParaguayanPennsylvania GermanPeruvianPimaPolishPortuguesePotawatomiPuebloPuerto RicanPuget Sound SalishRomanianRussianSalvadoranSamoanScandinavianScotch-IrishScottishSeminoleSenegaleseSerbianShoshoneSierra LeoneanSiouxSlavicSlovakSloveneSomaliSouth AfricanSouth AmericanSouth American IndianSoviet UnionSpaniardSpanishSpanish AmericanSpanish American IndianSri LankanSubsaharan AfricanSudaneseSwedishSwissSyrianTaiwaneseThaiTlingit-HaidaTohono O'OdhamTonganTsimshianTurkishU.S. Virgin IslanderUgandanUkrainianUruguayanUteVenezuelanVietnameseWelshWest IndianYakamaYaquiYugoslavianYumanYup'ikZimbabwean
Immigration
NonimmigrantsImmigrantsAfghanistanAfricaAlbaniaArgentinaArmeniaAsiaAustraliaAustriaBahamasBangladeshBarbadosBelarusBelgiumBelizeBoliviaBosnia and HerzegovinaBrazilBulgariaBurma/MyanmarCabo VerdeCambodiaCameroonCanadaCaribbeanCentral AmericaChileChinaColombiaCongoCosta RicaCroatiaCubaCzechoslovakiaDenmarkDominicaDominican RepublicEastern AfricaEastern AsiaEastern EuropeEcuadorEgyptEl SalvadorEnglandEritreaEthiopiaEuropeFijiFranceGermanyGhanaGreeceGrenadaGuatemalaGuyanaHaitiHondurasHong KongHungaryIndiaIndonesiaIranIraqIrelandIsraelItalyJamaicaJapanJordanKazakhstanKenyaKoreaKuwaitLaosLatin AmericaLatviaLebanonLiberiaLithuaniaMalaysiaMexicoMicronesiaMiddle AfricaMoldovaMoroccoNepalNetherlandsNicaraguaNigeriaNorth AmericaNorth MacedoniaNorthern AfricaNorthern EuropeNorwayOceaniaPakistanPanamaPeruPhilippinesPolandPortugalRomaniaRussiaSaudi ArabiaScotlandSenegalSerbiaSierra LeoneSingaporeSomaliaSouth AfricaSouth AmericaSouth Central AsiaSouth Eastern AsiaSouthern EuropeSpainSri LankaSt. Vincent and the GrenadinesSudanSwedenSwitzerlandSyriaTaiwanThailandTrinidad and TobagoTurkeyUgandaUkraineUruguayUzbekistanVenezuelaVietnamWest IndiesWestern AfricaWestern AsiaWestern EuropeYemenZaireZimbabweAzores
Married-Couple Family Poverty
Income
Poverty
Unemployment
Labor Participation
Family Structure
Vehicle Availability
Education Level
Disability

Trinidadian and Tobagonian Married-Couple Family Poverty
Tragic

6.2%
POVERTY | MARRIED-COUPLE FAMILIES
0.1/ 100
METRIC RATING
272nd/ 347
METRIC RANK

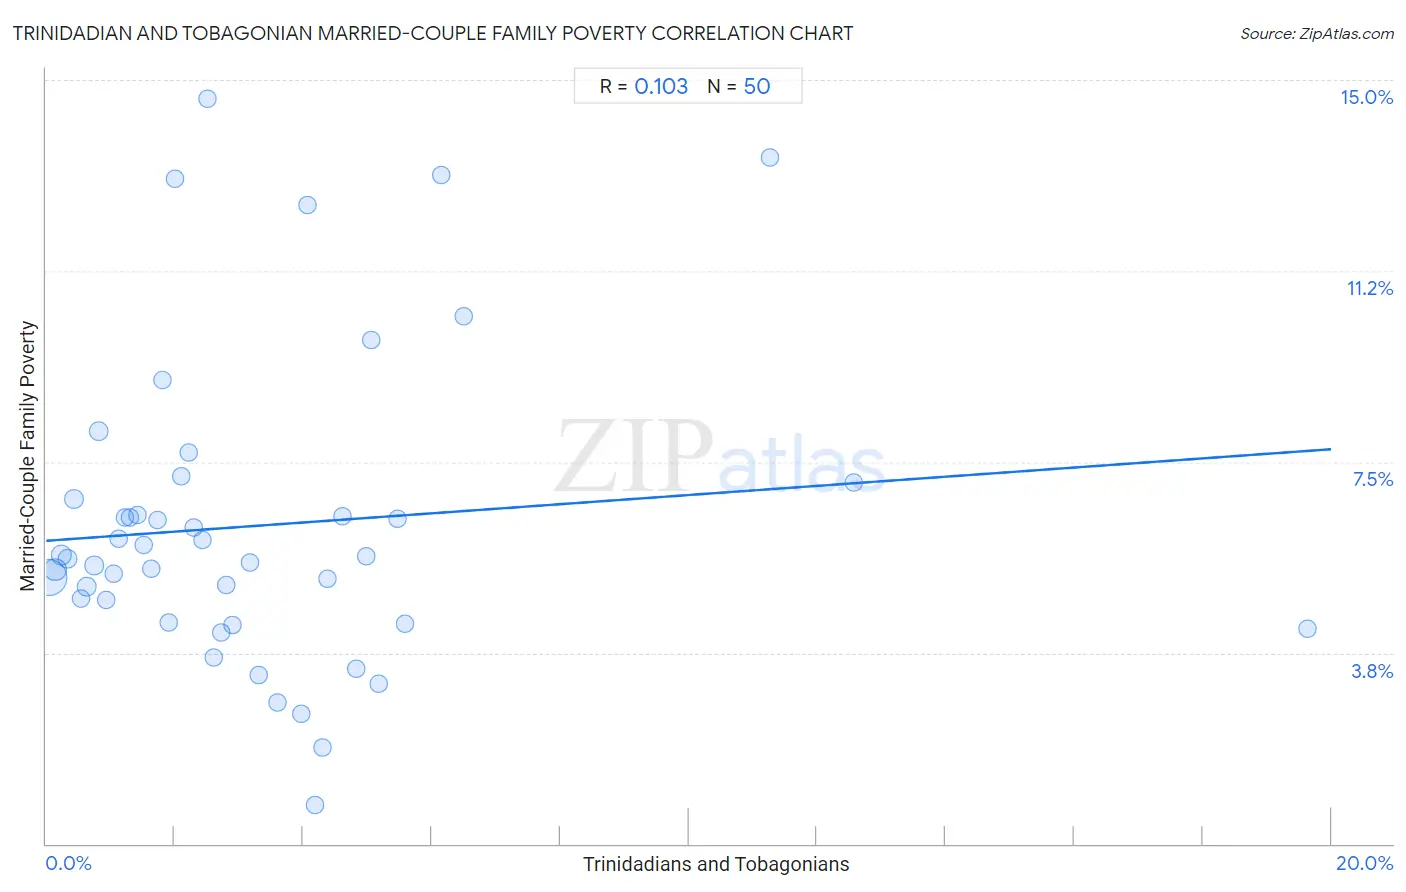
Trinidadian and Tobagonian Married-Couple Family Poverty Correlation Chart

The statistical analysis conducted on geographies consisting of 218,634,387 people shows a poor positive correlation between the proportion of Trinidadians and Tobagonians and poverty level among married-couple families in the United States with a correlation coefficient (R) of 0.103 and weighted average of 6.2%. On average, for every 1% (one percent) increase in Trinidadians and Tobagonians within a typical geography, there is an increase of 0.090% in poverty level among married-couple families.
Trinidadian and Tobagonian Married-Couple Family Poverty
It is essential to understand that the correlation between the percentage of Trinidadians and Tobagonians and poverty level among married-couple families does not imply a direct cause-and-effect relationship. It remains uncertain whether the presence of Trinidadians and Tobagonians influences an upward or downward trend in the level of poverty level among married-couple families within an area, or if Trinidadians and Tobagonians simply ended up residing in those areas with higher or lower levels of poverty level among married-couple families due to other factors.

Demographics Similar to Trinidadians and Tobagonians by Married-Couple Family Poverty

In terms of married-couple family poverty, the demographic groups most similar to Trinidadians and Tobagonians are Immigrants from Bahamas (6.2%, a difference of 0.030%), Immigrants from Jamaica (6.2%, a difference of 0.25%), Immigrants from West Indies (6.2%, a difference of 0.29%), Alaska Native (6.2%, a difference of 0.46%), and Colville (6.3%, a difference of 0.78%).
DemographicsRating | RankMarried-Couple Family Poverty
Blackfeet
0.2
/100
|
#265
Tragic
6.2%
Creek
0.2
/100
|
#266
Tragic
6.2%
Spanish Americans
0.2
/100
|
#267
Tragic
6.2%
Alaska Natives
0.2
/100
|
#268
Tragic
6.2%
Immigrants from West Indies
0.1
/100
|
#269
Tragic
6.2%
Immigrants from Jamaica
0.1
/100
|
#270
Tragic
6.2%
Immigrants from Bahamas
0.1
/100
|
#271
Tragic
6.2%
Trinidadians and Tobagonians
0.1
/100
|
#272
Tragic
6.2%
Colville
0.1
/100
|
#273
Tragic
6.3%
Barbadians
0.1
/100
|
#274
Tragic
6.3%
Choctaw
0.1
/100
|
#275
Tragic
6.3%
Yaqui
0.1
/100
|
#276
Tragic
6.3%
Indonesians
0.1
/100
|
#277
Tragic
6.3%
Immigrants from Trinidad and Tobago
0.1
/100
|
#278
Tragic
6.4%
Houma
0.0
/100
|
#279
Tragic
6.4%

Trinidadian and Tobagonian Married-Couple Family Poverty Correlation Summary

MeasurementTrinidadian and Tobagonian DataMarried-Couple Family Poverty Data
Minimum0.036%0.75%
Maximum19.6%14.6%
Range19.6%13.9%
Mean3.3%6.3%
Median2.5%5.6%
Interquartile 25% (IQ1)1.2%4.3%
Interquartile 75% (IQ3)4.4%6.8%
Interquartile Range (IQR)3.1%2.4%
Standard Deviation (Sample)3.5%3.0%
Standard Deviation (Population)3.4%3.0%

Correlation Details

Trinidadian and Tobagonian PercentileSample SizeMarried-Couple Family Poverty
[
0.0%
-
0.5%
]
0.036%
132,584,7695.2%
[
0.0%
-
0.5%
]
0.14%
32,028,2555.4%
[
0.0%
-
0.5%
]
0.23%
16,337,2455.7%
[
0.0%
-
0.5%
]
0.34%
8,620,4965.6%
[
0.0%
-
0.5%
]
0.44%
5,032,5106.8%
[
0.5%
-
1.0%
]
0.54%
3,198,7944.8%
[
0.5%
-
1.0%
]
0.63%
2,398,3375.0%
[
0.5%
-
1.0%
]
0.75%
2,085,4225.5%
[
0.5%
-
1.0%
]
0.82%
9,436,0518.1%
[
0.5%
-
1.0%
]
0.93%
855,2194.8%
[
1.0%
-
1.5%
]
1.05%
690,4735.3%
[
1.0%
-
1.5%
]
1.13%
860,6856.0%
[
1.0%
-
1.5%
]
1.23%
823,7406.4%
[
1.0%
-
1.5%
]
1.31%
477,2926.4%
[
1.0%
-
1.5%
]
1.42%
518,9496.5%
[
1.5%
-
2.0%
]
1.51%
228,6185.9%
[
1.5%
-
2.0%
]
1.63%
203,9455.4%
[
1.5%
-
2.0%
]
1.73%
214,2646.4%
[
1.5%
-
2.0%
]
1.82%
220,0789.1%
[
1.5%
-
2.0%
]
1.91%
157,3864.3%
[
2.0%
-
2.5%
]
2.01%
113,27013.1%
[
2.0%
-
2.5%
]
2.09%
76,3207.2%
[
2.0%
-
2.5%
]
2.21%
48,6547.7%
[
2.0%
-
2.5%
]
2.30%
211,8766.2%
[
2.0%
-
2.5%
]
2.43%
119,1056.0%
[
2.5%
-
3.0%
]
2.52%
105,64114.6%
[
2.5%
-
3.0%
]
2.61%
14,2533.7%
[
2.5%
-
3.0%
]
2.73%
41,7974.2%
[
2.5%
-
3.0%
]
2.81%
23,2775.1%
[
2.5%
-
3.0%
]
2.90%
49,9854.3%
[
3.0%
-
3.5%
]
3.16%
24,9945.5%
[
3.0%
-
3.5%
]
3.31%
73,8793.3%
[
3.5%
-
4.0%
]
3.61%
8,2602.8%
[
3.5%
-
4.0%
]
3.97%
57,1922.5%
[
4.0%
-
4.5%
]
4.07%
87,69812.5%
[
4.0%
-
4.5%
]
4.17%
10,4950.75%
[
4.0%
-
4.5%
]
4.30%
7,9531.9%
[
4.0%
-
4.5%
]
4.38%
150,3875.2%
[
4.5%
-
5.0%
]
4.62%
101,0536.4%
[
4.5%
-
5.0%
]
4.83%
100,0823.4%
[
4.5%
-
5.0%
]
4.98%
51,1535.6%
[
5.0%
-
5.5%
]
5.05%
58,4769.9%
[
5.0%
-
5.5%
]
5.17%
6,8513.1%
[
5.0%
-
5.5%
]
5.47%
78,5066.4%
[
5.5%
-
6.0%
]
5.57%
2,3324.3%
[
6.0%
-
6.5%
]
6.14%
29,82013.1%
[
6.0%
-
6.5%
]
6.49%
1,51010.4%
[
11.0%
-
11.5%
]
11.27%
63013.5%
[
12.5%
-
13.0%
]
12.56%
4,1797.1%
[
19.5%
-
20.0%
]
19.63%
2,2314.2%